Google has announced that they're ending support for the Web Vitals Chrome extension in January 2025.
Read this article to learn what tools you can use instead.
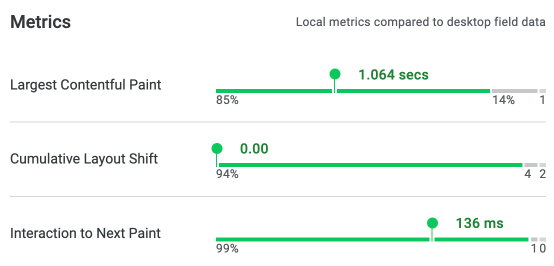
Web Vitals reporting in Chrome DevTools
Google has been busy working on improvements to the Performance tab in Chrome's developer tools.
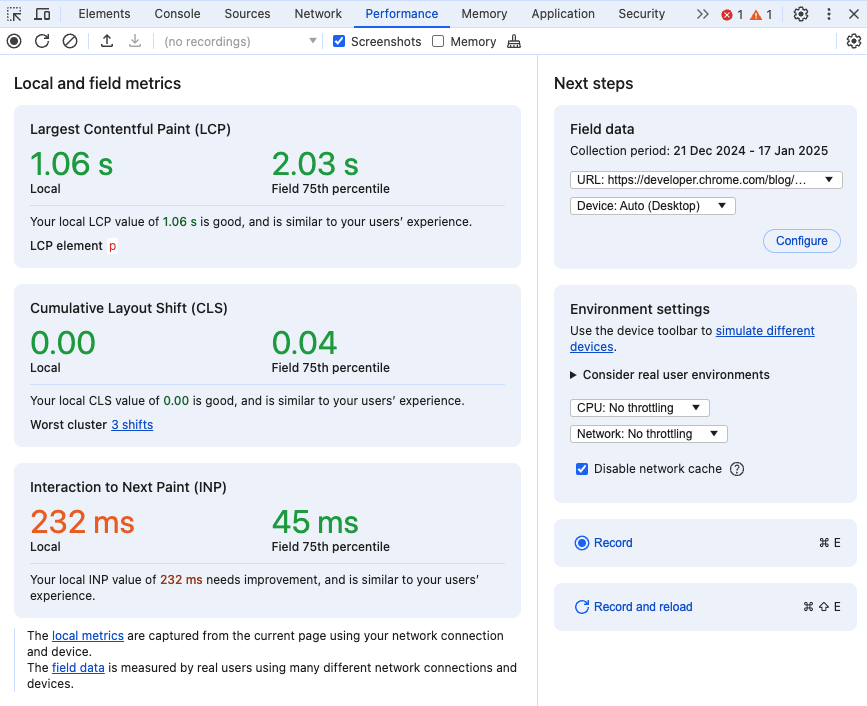
While previously the Performance tab was only used to collect for in-depth performance profiles, it now prominently provides a summary of web vitals metrics on the page.

Follow these steps to view DevTools performance data:
- Right click on the page
- Select Inspect
- Select the Performance tab at the top of Chrome DevTools
You can also set up DevTools to show field data in addition to the local page speed metrics.
Web vitals console logs
Google's Web Vitals extension also showed a list of reported metrics and page interactions in the DevTools console.

If you want to view interactions and layout shifts, this data is now also shown in the Performance tab, right below the high-level Core Web Vitals metrics.

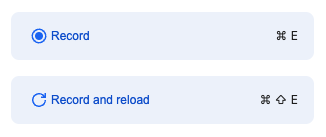
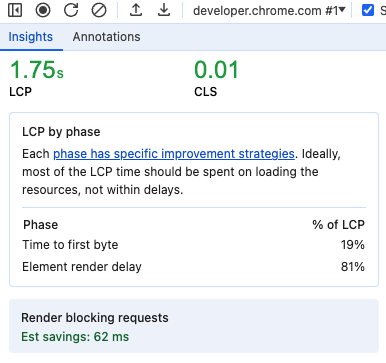
To view the Largest Contentful Paint component breakdown, click Record and reload.
Ensure the sidebar on the left is expanded and open the LCP by phase breakdown
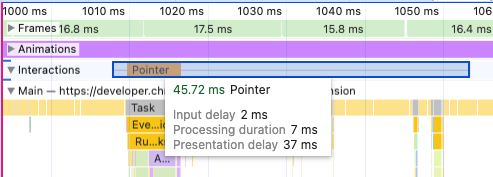
You can also find the Interaction to Next Paint component breakdown in the Interactions lane of the performance recording.
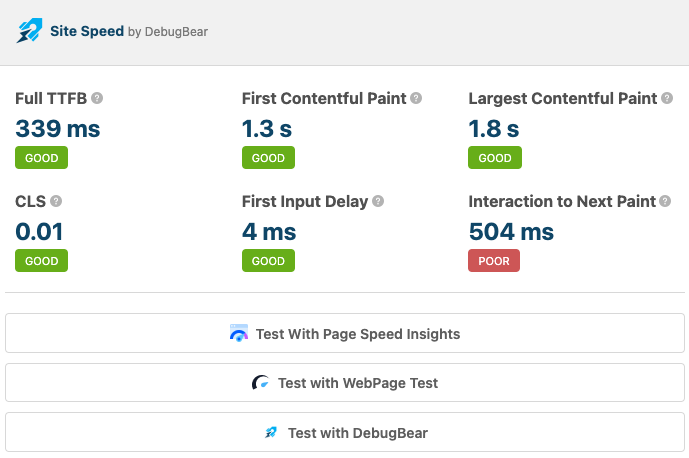
DebugBear Site Speed Chrome extension
If you want to view local Core Web Vitals data without opening DevTools you can switch to the Site Speed extension by DebugBear instead.
Simply click the extension icon to see the Core Web Vitals metrics at a glance.
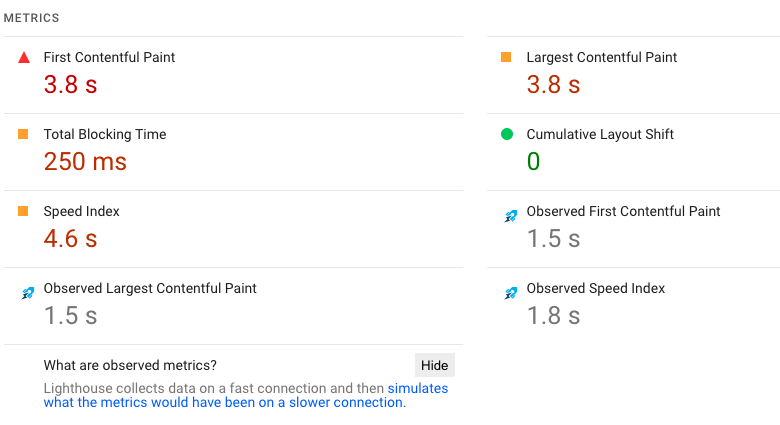
As a bonus, it can surface observed metrics for the simulated data on PageSpeed Insights!
Run a full website speed test
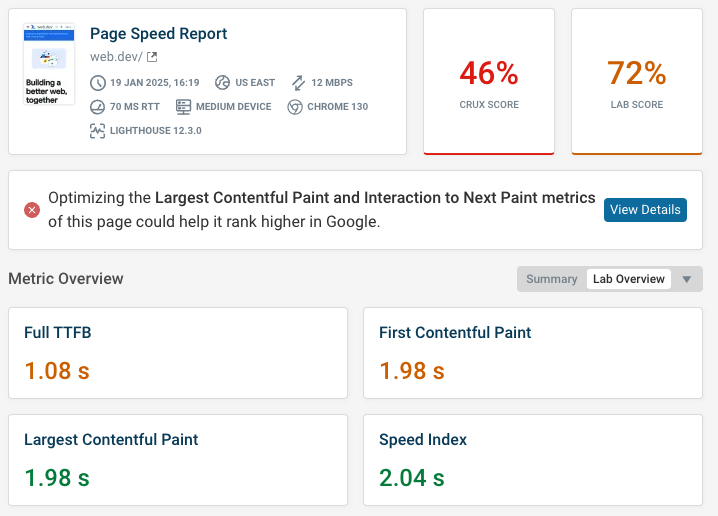
Instead of viewing local data, running a website speed test from a controlled lab environment can give you more detailed insights into your page performance.
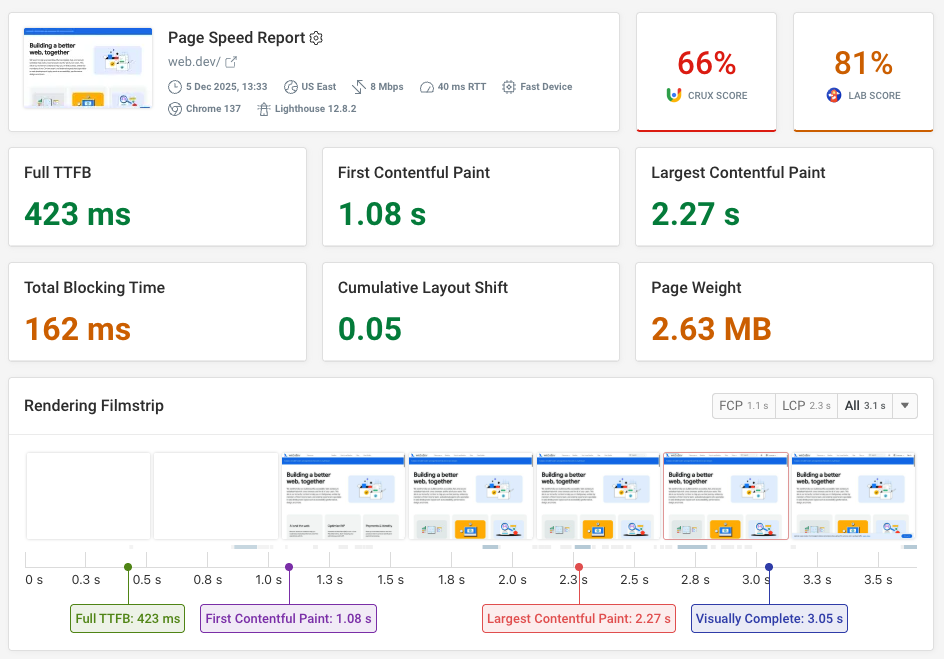
The test result summary will tell you the lab-based metrics as well as show how the page is doing in the Chrome UX Report data that impacts SEO.
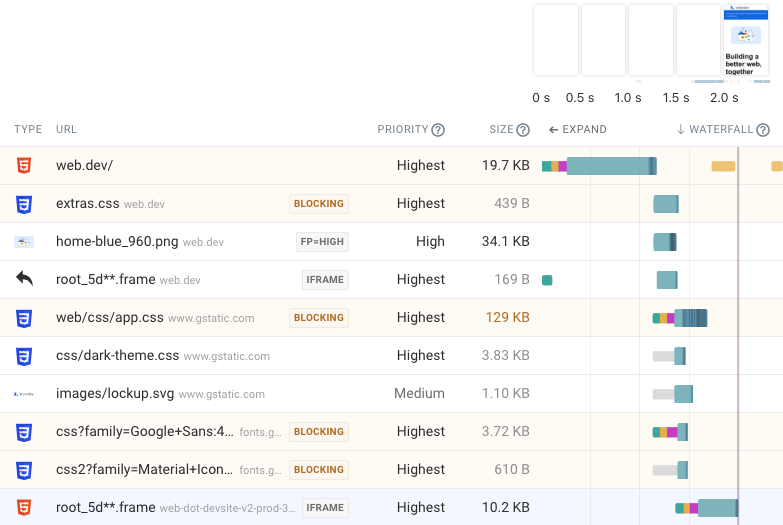
The network request waterfall can help you understand what's happening on the network when loading the page. Depending on what resources have loaded, different parts of the website content will show up in the rendering filmstrip at the top.
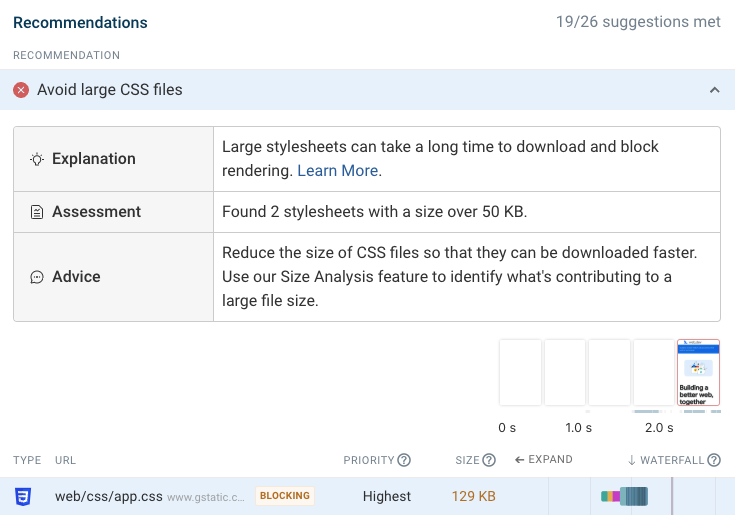
You also get tailored recommendations to improve your website performance.

Run A Free Page Speed Test
Test Your Website:
- Automated Recommendations
- Detailed Request Waterfall
- Web Vitals Assessment
