
Ahrefs is a comprehensive SEO monitoring solution. Since the Core Web Vitals impact SEO, Ahrefs also provides a Performance section where you can crawl and audit your website to identify slow pages.
In this article we'll explain how to get started with Performance testing in Ahrefs and what else you can do to keep track of your Core Web Vitals.
How to view Performance data in Ahrefs
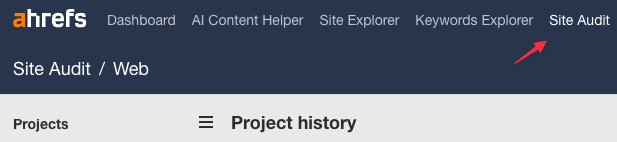
To view page speed data in Ahrefs, first select Audits from the navigation at the top of the page.
Select a project and then open the most recent audit result.
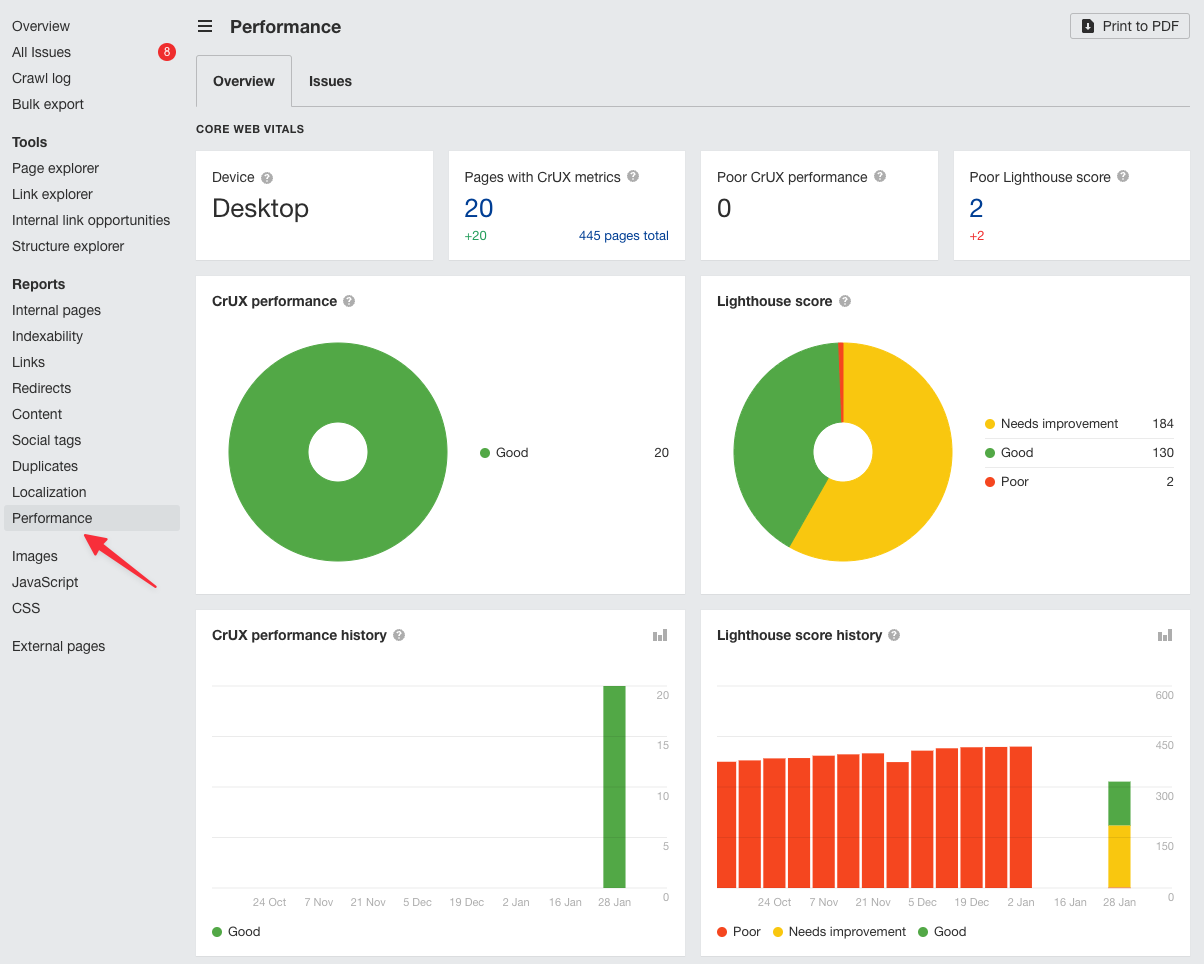
Finally select Performance in the sidebar.
Review Ahrefs metrics
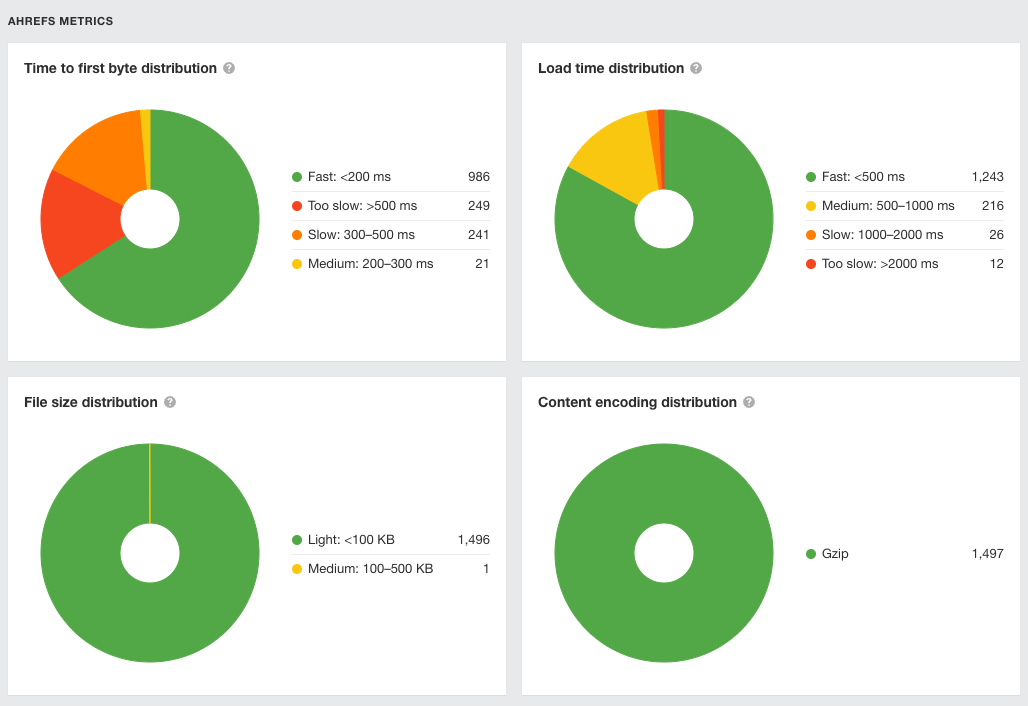
Ahrefs reports data about four metrics:
- Time to First Byte: how quickly your server responds to requests
- Load Time: how quickly scripts and images on the page are loaded
- File Size: download size of the HTML document
- Content encoding: how server responses are compressed
For each of these metrics Ahrefs provides a distribution of how many pages on your website are fast enough, could be improved, or are doing poorly.
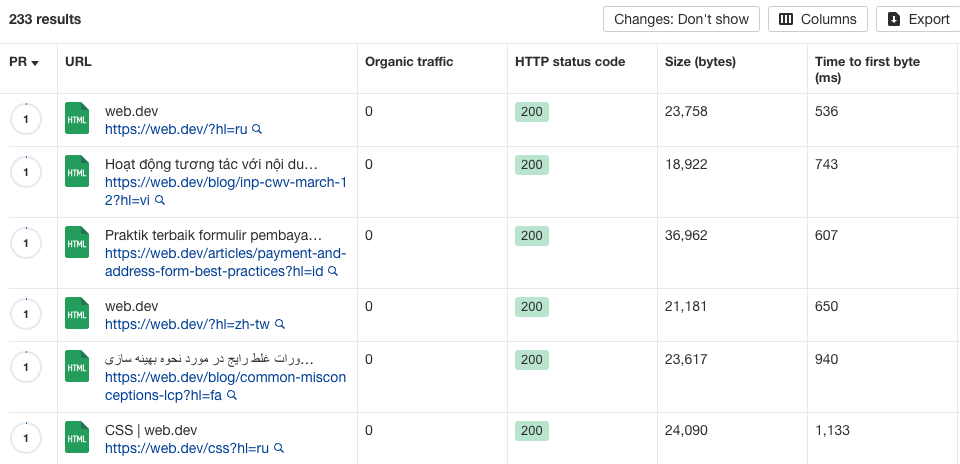
You can click on each set of pages in the charts to go into the Page Explorer and view more details about that URL. For example, you can find specific pages that have large HTML or slow server response times.
View Core Web Vitals from Google CrUX
Ahrefs also supports viewing the data from Google's Chrome User Experience Report (CrUX), which is what impacts rankings. However, this first requires some setup.
Add a PageSpeed Insights API key to Ahrefs crawl settings
To collect CrUX data, Ahrefs uses the PageSpeed Insights API. You need to provide your own API key.
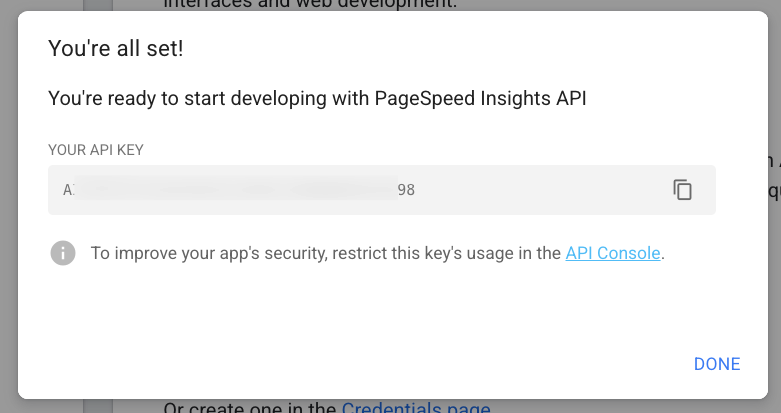
First, you need to get an API key from Google. Go to this page, click "Get Key" and log into your Google account if necessary.
Select a Google Cloud project for the API key and click Next. If you click Show Key you can copy the API key from Google.
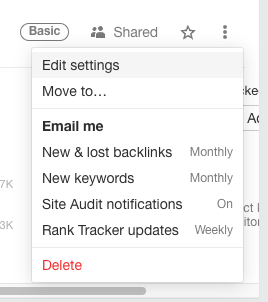
Now take this API key and put it into Ahrefs. First, edit the project settings where you want to view CrUX data.
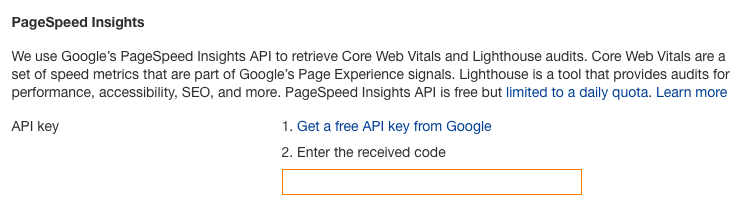
Then select Audit and Crawl Settings. Scroll down to the PageSpeed Insights, paste your API key, and click Save at the bottom of the page.
Once you're done, return to the audit result and click New crawl.
Viewing Core Web Vitals metrics in Ahrefs
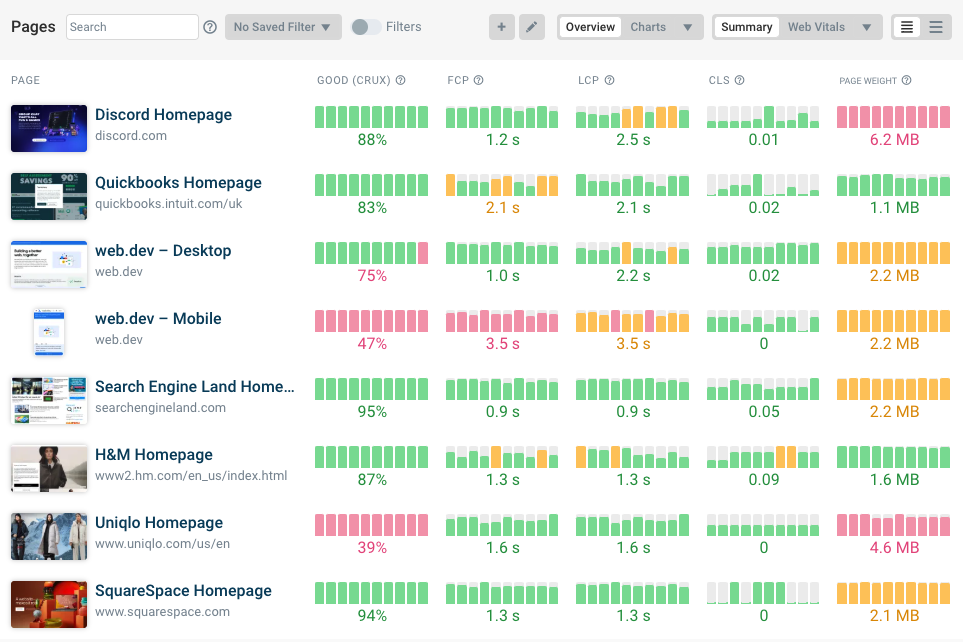
Now that the data is collected, you can see CrUX performance data at the top of your dashboard. Open this report and sort by one of the Core Web Vitals metrics to identify pages that could be optimized.
For example, here we can see scores for:
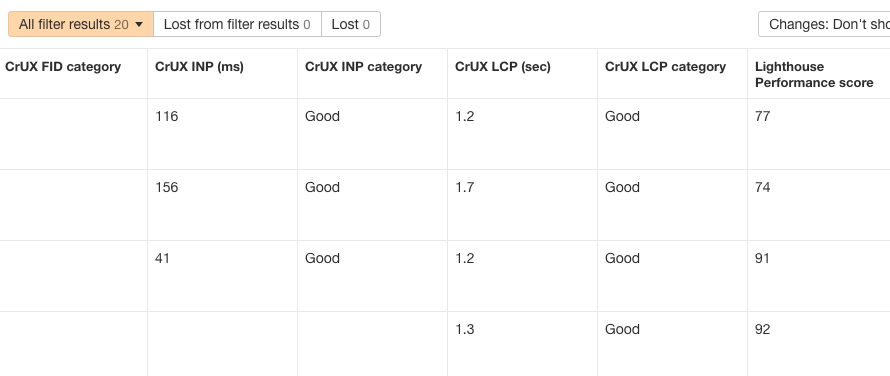
Not all pages on your website will have URL-level CrUX data!
Getting more in-depth Core Web Vitals analytics
The Core Web Vitals data in tools like Ahrefs and Google Search Console is a great starting point to see how your website is performing.
However, to get more in-depth reporting and performance recommendations you need a Core Web Vitals monitoring tool.
DebugBear provides comprehensive website performance reporting:
- Synthetic testing with custom page speed advice
- Google CrUX monitoring for your website and competitors
- Real user monitoring to improve SEO and Interaction to Next Paint
Let's see how each of these features can help you make your website faster.
Synthetic monitoring
Synthetic tests – tests run in a controlled lab environment – let you track your metrics and those of your competitors over time. Each includes a full Lighthouse report with Performance, SEO, and Accessibility scores.
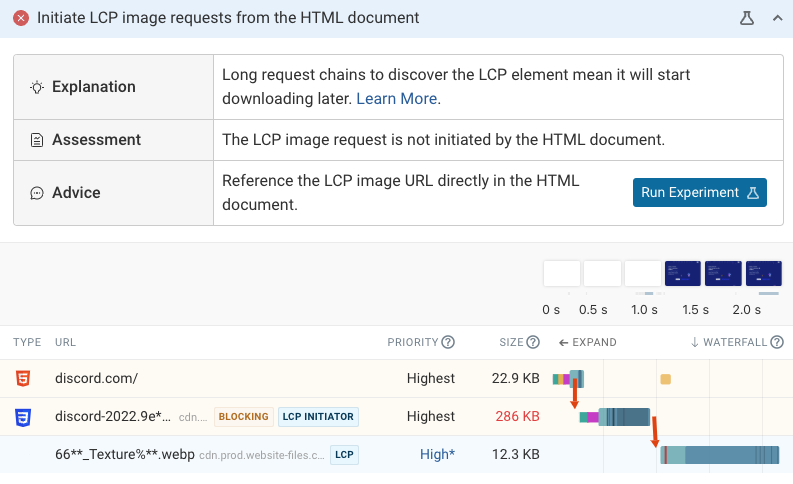
Lab data provides the most in-depth reporting, including concrete recommendations to improve your page load time.
CrUX monitoring
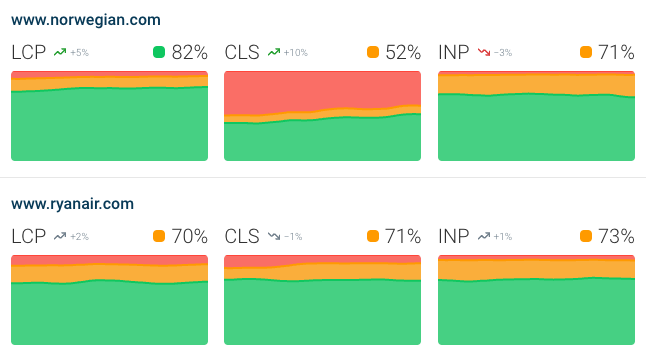
The CrUX trends dashboard in DebugBear makes it easy to compare your website to other websites in your industry, as well as see how overall website performance has changed over time.
Real user monitoring
Real user monitoring matters for SEO, because Google looks at real user data to determine rankings. With DebugBear you can get instant updates when your data changes. In contrast, CrUX data comes with a 28-day delay for full reporting.
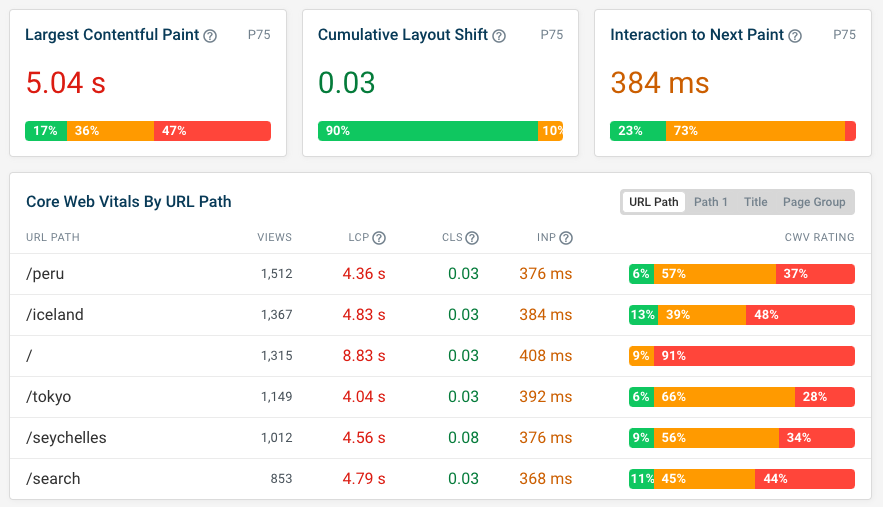
RUM data is also essential for debugging Interaction to Next Paint, as it can tell you what elements cause poor interactions and what scripts on your page are responsible for those delays.


Monitor Page Speed & Core Web Vitals
DebugBear monitoring includes:
- In-depth Page Speed Reports
- Automated Recommendations
- Real User Analytics Data