
Monitoring your web application is important to deliver a good user experience and achieve business success. Learn what aspects of your app to monitor and what tools are available.
What is web application monitoring
Web application monitoring means continuously collecting data on various aspects of a complex website. For example:
- Website performance
- JavaScript errors
- Server performance
- Uptime / Availability
Web app monitoring tools collect metrics about the website, display them in dashboards, and provide detailed data to inspect website issues.
Let's take a look at different tools that you can use to track your web application.
Monitoring web application performance
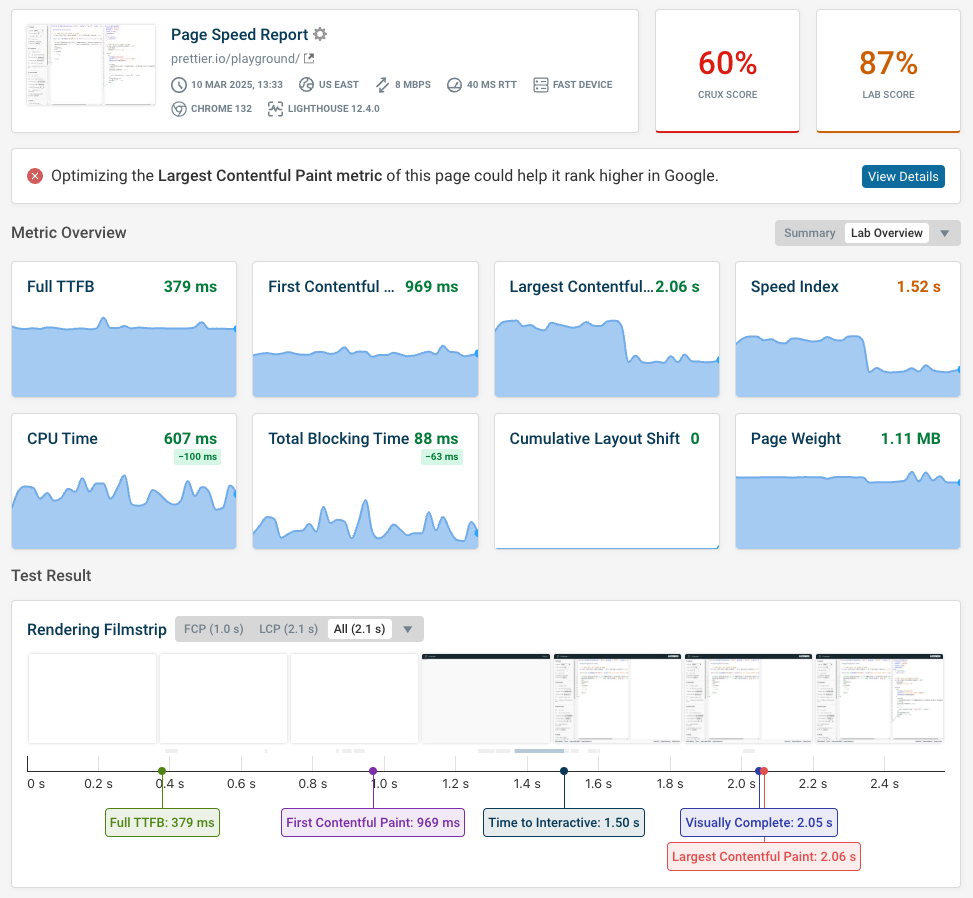
One aspect of web app monitoring is website performance monitoring. It measures how quickly applications load and how fast they process user interactions once loaded.
You can use a tool like DebugBear synthetic monitoring to track page speed metric over time and check how visitors experience the loading process.
Check out this our guide on how to build a performant front-end architecture.
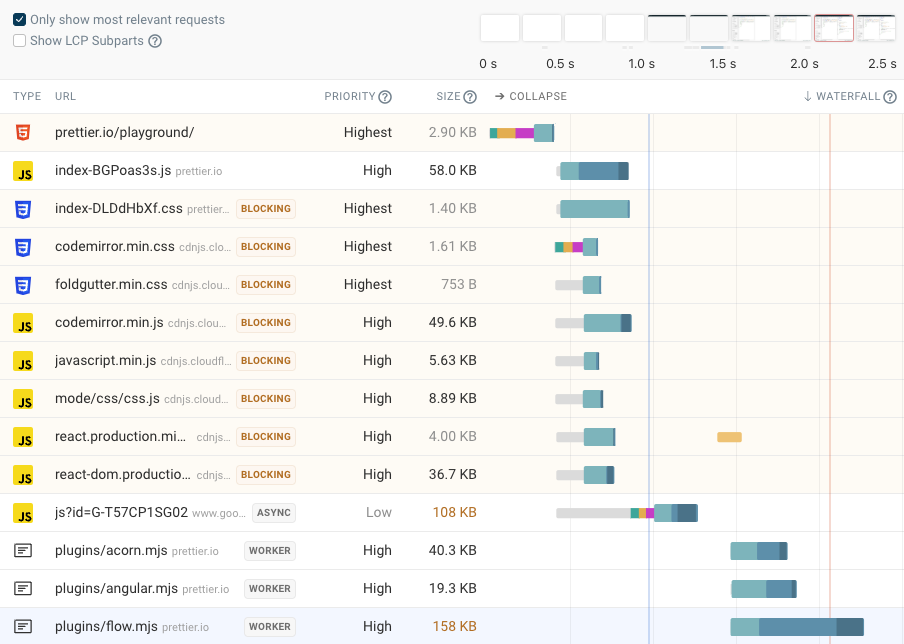
You can also use request waterfall visualizations to see when different JavaScript files on your website load and execute, and what that means for what visitors can see on your website.
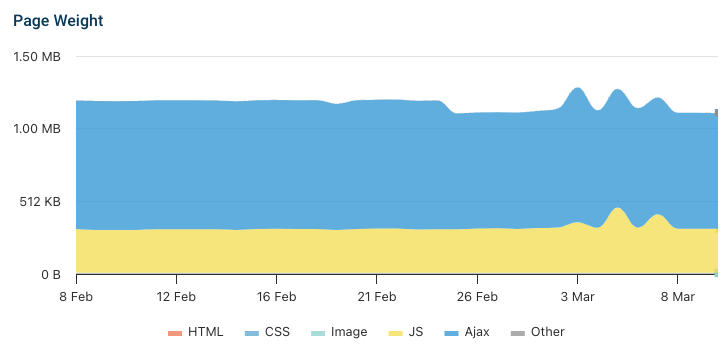
Web applications often load a large amount of JavaScript code, so it's worth measuring page weight over time and optimizing bundle sizes.
Monitoring backend performance
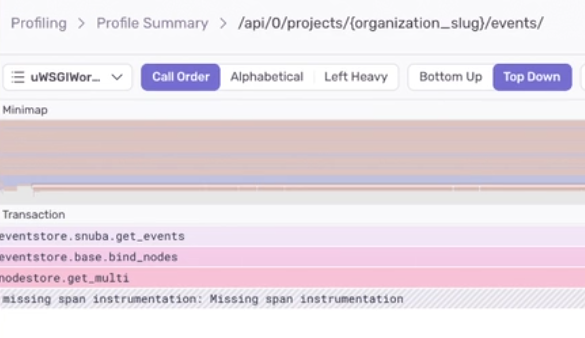
The loading speed of your website depends both on front-end application logic, and backend request durations. An application monitoring tool like Sentry can help you track what's happening on the backend.
For example, you can profile your application to see what code is taking a long time to run, or to identify slow database queries and API requests.
If you're struggling with backend performance, check out our article explaining how to reduce server response time.
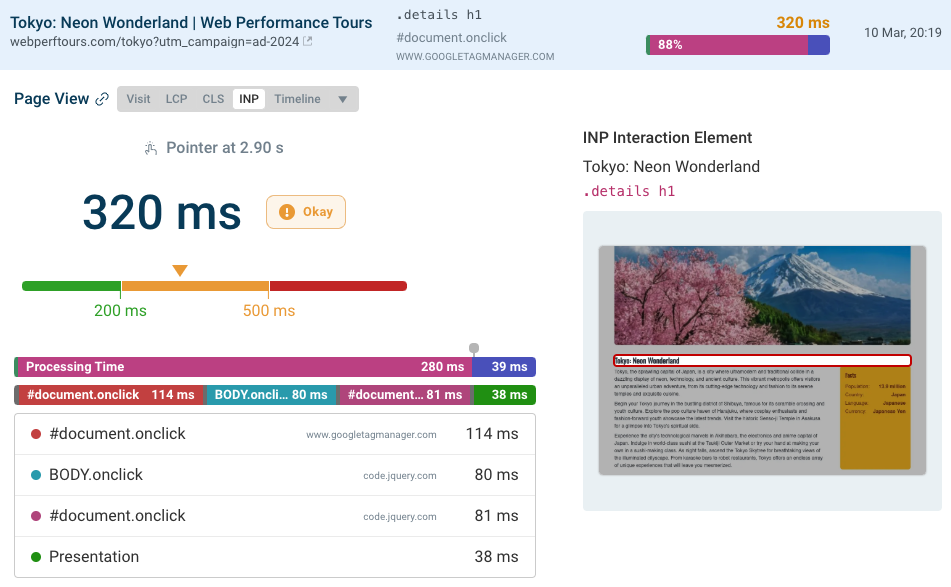
Monitoring responsiveness and slow interactions
Front-end application code can often be sluggish and cause pages to freeze after a user interaction. These input delays can be measured using the Interaction to Next Paint metric.
You can use a real-user monitoring tool to identify slow interactions and see what scripts are delaying them. The script data is provided by the Long Animation Frames API.
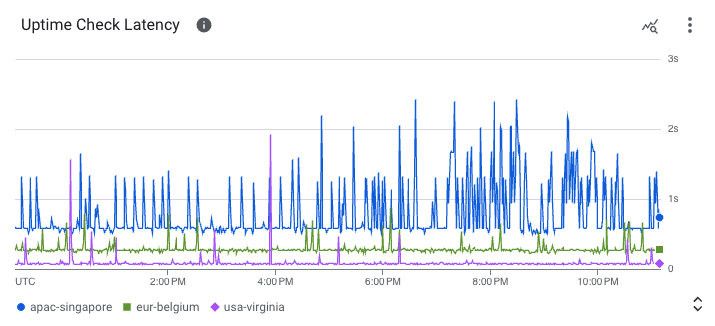
Monitoring web app availability
Even more important than performance is whether your website is available for visitors at all. A lot of downtime will quickly lose you users.
You can use a number of uptime monitoring services, for example Onlineornot or the uptime checks built into Google Cloud.
That way you'll get alerted when your website isn't available, allowing you to fix issues quickly and maximize uptime for your application.
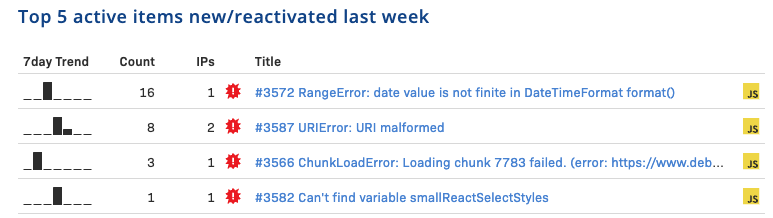
Error monitoring for web applications
Another thing to monitor for your application are JavaScript errors. Tools like Rollbar can tell you when errors occur, how many users impacted, and what led up to issues.
Identifying errors your users encounter on your website lets you build a service that is reliable.
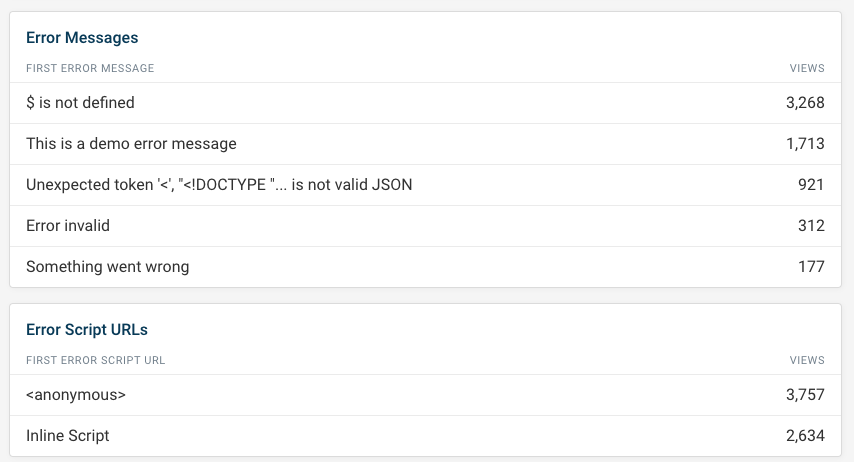
DebugBear real user monitoring also provides error monitoring functionality so you can see common error messages, what scripts are causing issues, and what pages on your website are impacted.
Comprehensive application performance monitoring (APM) solutions
So far we've looked at more specialized tools for specific use cases. However, there are also many comprehensive IT monitoring solutions available, which also include performance monitoring for web apps. Two common tools are:
- DataDog
- New Relic
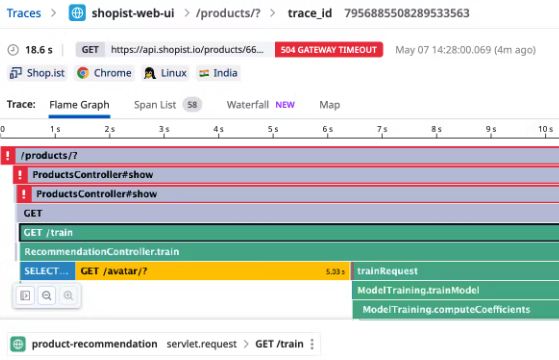
For example, here's an example performance trace from DataDog, showing how the server spent handling a network request and what components contributed to the overall request duration.
Core Web Vitals monitoring
Google's Core Web Vitals metrics assess the loading speed, visual stability, and interaction responsiveness of your website or application.
DebugBear real user monitoring provides you with insight on where your site is doing poorly on the web vitals assessment, and what's causing these issues.

In addition to synthetic data, DebugBear also collects data from Google's Chrome User Experience Report (CrUX), allowing you to see how your website performs for Chrome users and compare your website against the competition.


Monitor Page Speed & Core Web Vitals
DebugBear monitoring includes:
- In-depth Page Speed Reports
- Automated Recommendations
- Real User Analytics Data