
This guide covers some modern web performance features of Chrome DevTools, with a focus on the new Performance Panel features which helps you optimize Core Web Vitals and improve your general web performance.
What We'll Cover
We higlight some of these exciting performance features in our new post: Our Favorite DevTools Features of 2025
In this guide, we'll dive deep into the new Performance Panel features in Chrome DevTools. We'll explore what the new features are, how to access it, and how to use it effectively while fixing your web performance and Core Web Vitals.
While the next section dives straight into the new Performance Panel features, later sections in this post also cover a quick refresher on Core Web Vitals and give more context on how to use the Performance Panel in your workflow.
If you enjoy learning visually, this video is a helpful companion to the features shown in this post.
Introducing the New Performance Panel in DevTools
As of August 2024, the new Performance Panel features in Chrome DevTools is still experimental, and is only available after enabling experimental features. The user interface may change in future updates.
The new Performance Panel features in Chrome DevTools consists of two main components:
A DevTools landing page for the performance panel. The landing page displays lab and field metrics for Core Web Vitals:
A sidebar in the Performance Panel that you can open after recording. The sidebar provides additional information such as LCP load phases (covered later in this guide):
Note: This feature is currently experimental, and the user interface may change in future updates.
What Does the New Performance Panel Show?
The new Performance Panel has useful information to help you understand and optimize your website's performance. Here's a quick overview of what you can find (you can match the numbers overlayed on the screenshot with the list that follows the image):
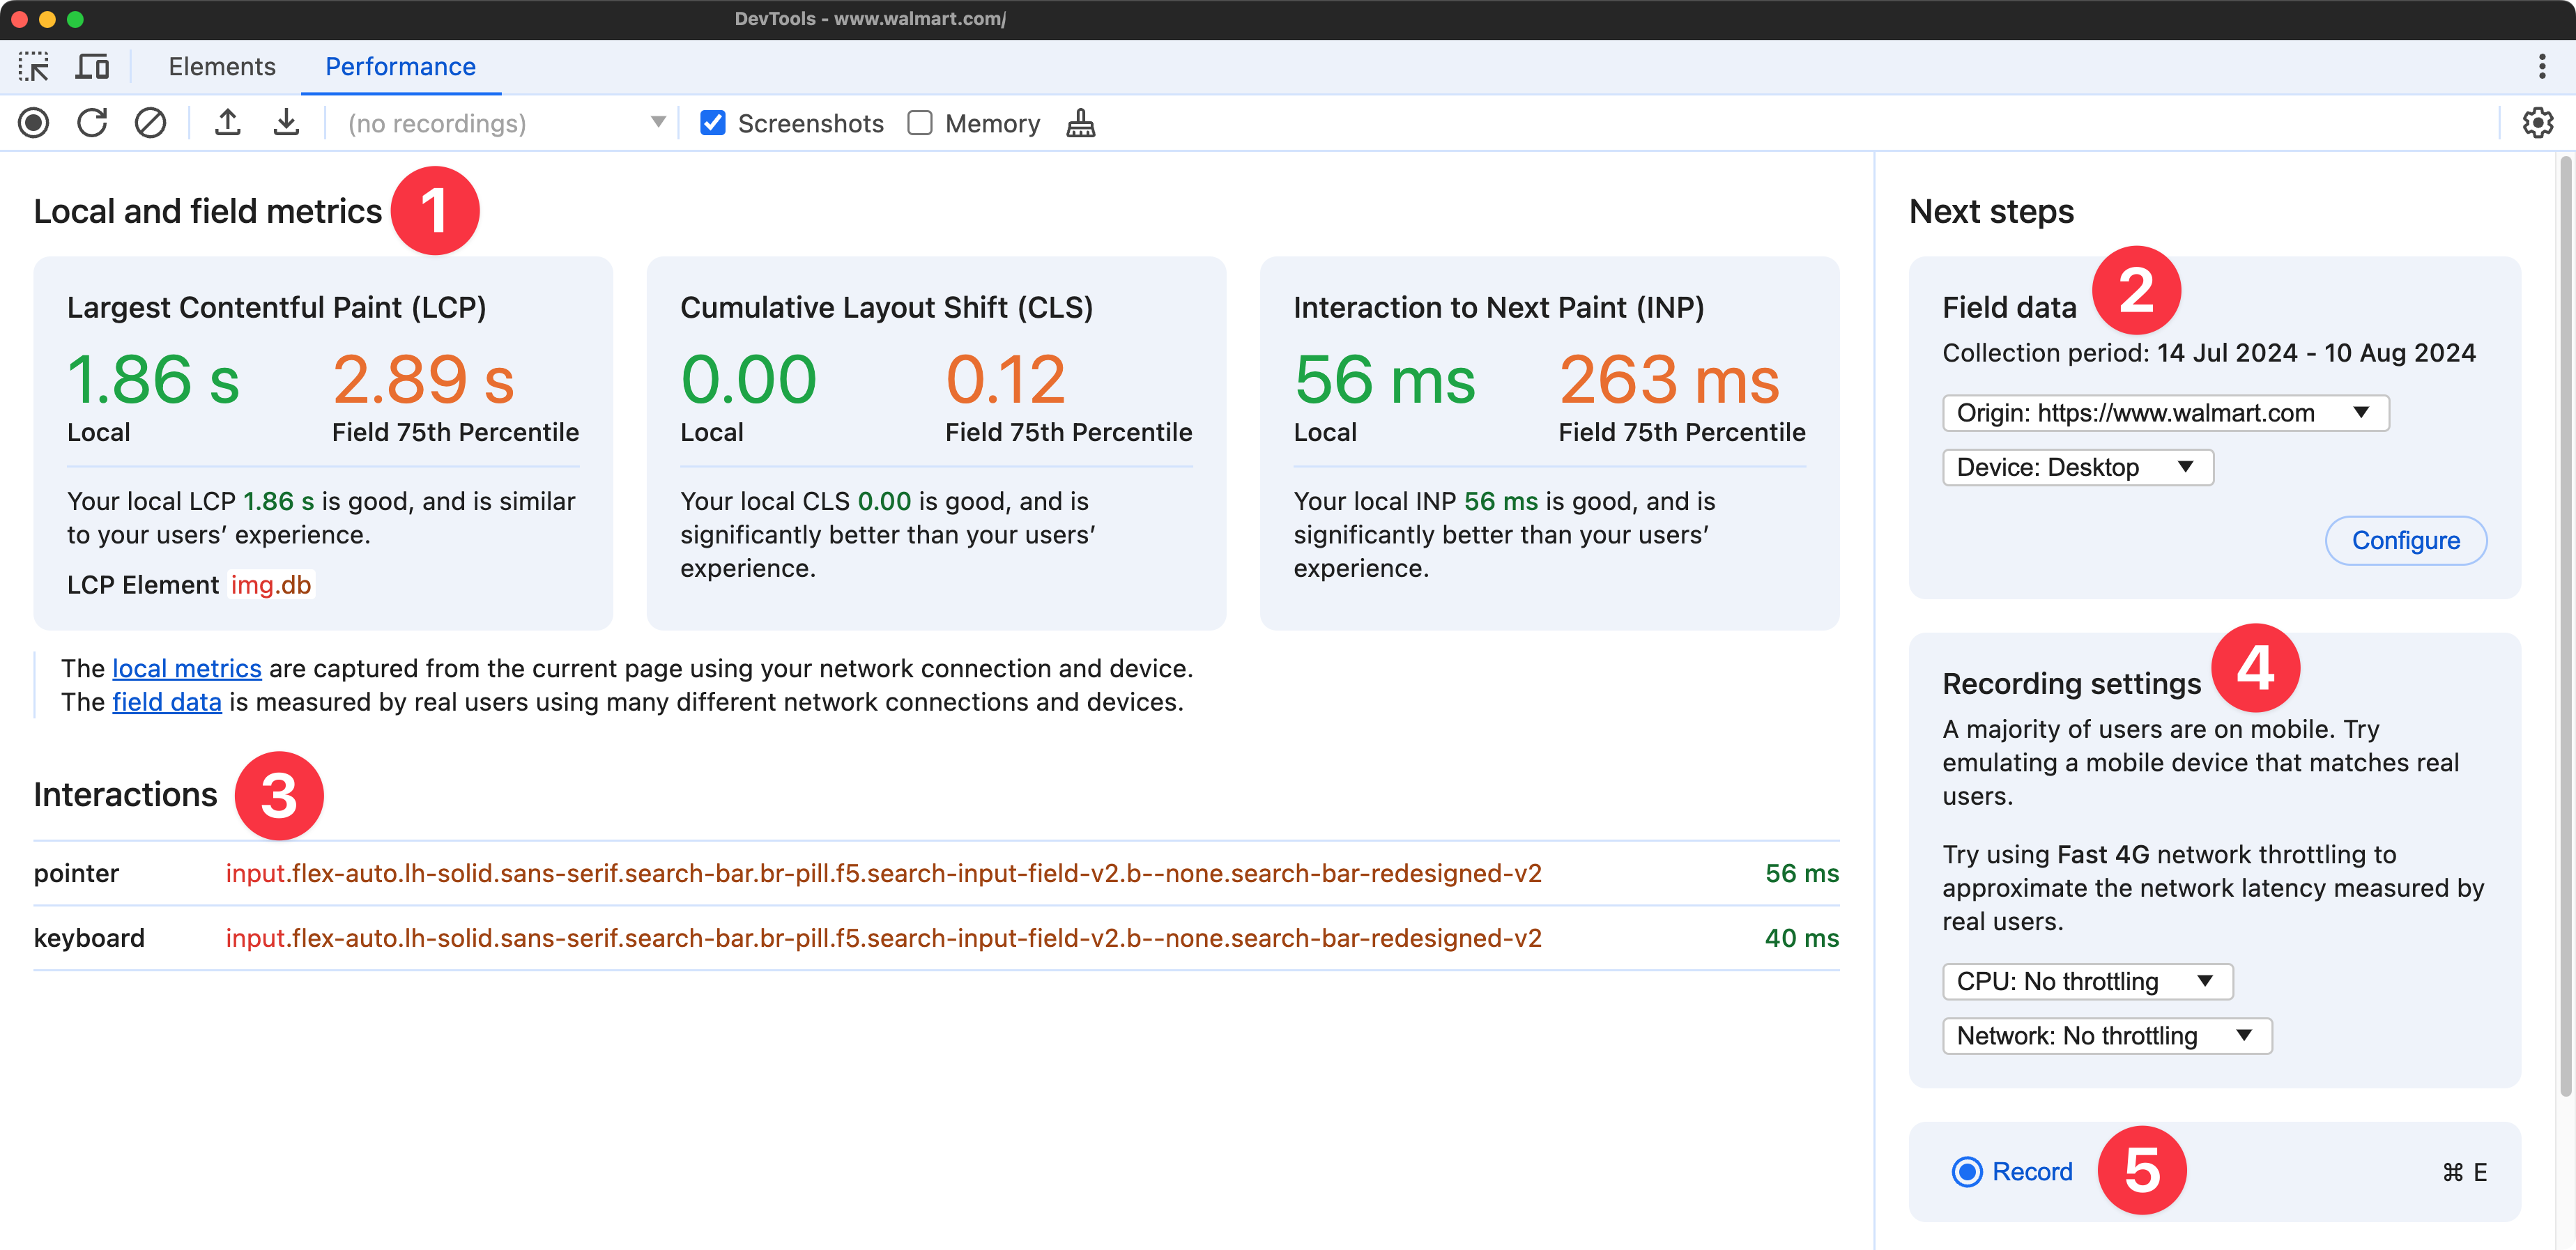
- Core Web Vitals Data: Lab and field data for LCP, CLS and INP.
- CrUX Data Settings: Customizations for field data from the Chrome User Experience Report.
- INP Interaction Element: The element that was interacted with to trigger the INP.
- Recording Settings: Controls to throttle CPU and network conditions.
- Recording Controls: Controls to start a new recording.
Core Web Vitals Data: Lab and Field
One prominent feature of the Performance Panel is its ability to show both lab and field data for Core Web Vitals:
- Lab Data: This represents the performance metrics collected from your local browsing session.
- Field Data: This comes from the Chrome User Experience Report (CrUX), representing real-world user experiences.
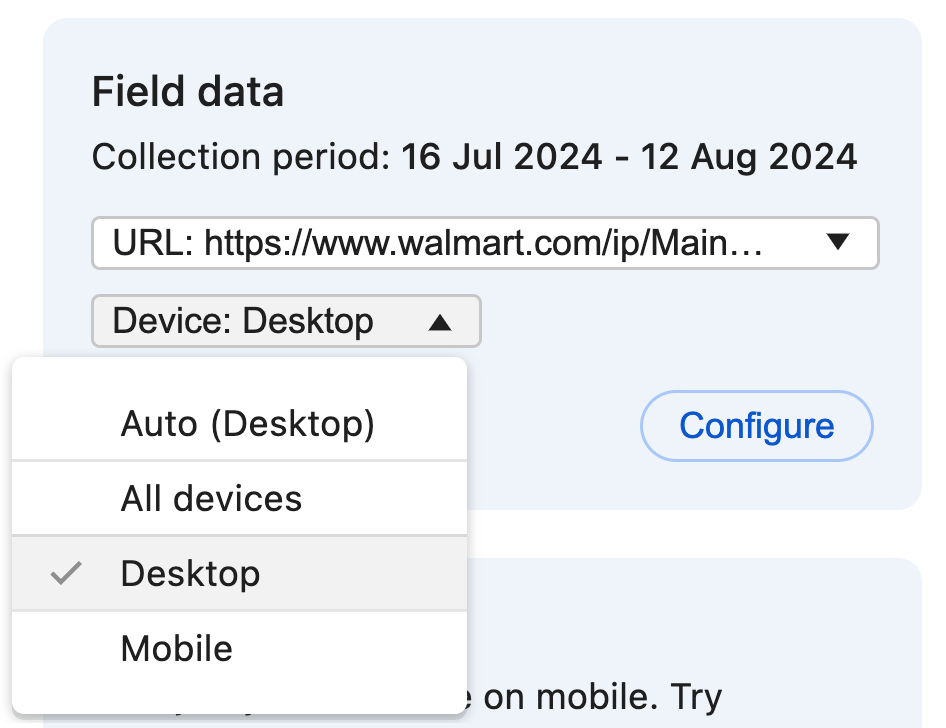
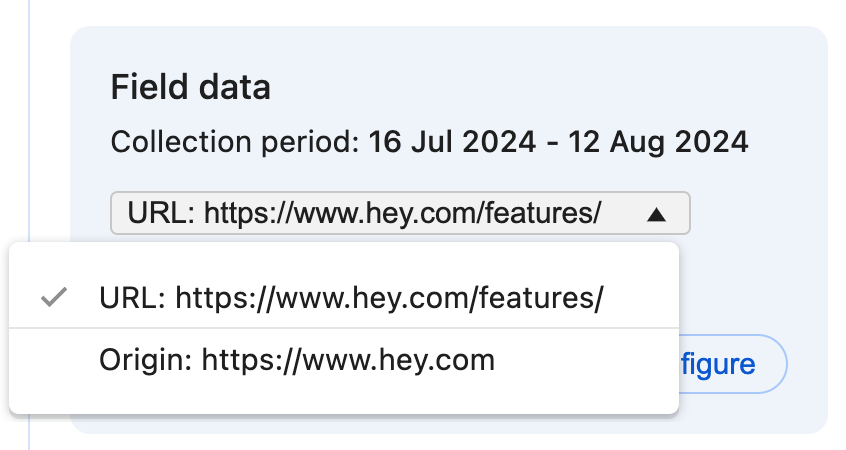
The field data from CrUX can be customized to show data for the entire origin or just the current URL, with options for desktop, mobile, or all devices.
In addition to raw metrics, the Performance Panel provides friendly interpretations. For example:
"Your local LCP 540 ms is good and is rated the same as 97% of real-user LCP experiences. Additionally, the field data 75th percentile LCP 993 ms is good."
Interactive Elements
The Performance Panel can link to elements that are important for understanding performance metrics. These include:
- The LCP element: The largest element considered for the LCP metric.
- The INP target element (what element was interacted with to trigger the INP).
Clicking on these elements takes you to the corresponding node in the Elements Panel DOM tree.
LCP Requests Discovery
This section shows up after collecting a page load recording through the Performance Panel. This section provides useful recommendations about your LCP resource:
- Whether you're lazy loading the LCP (which you shouldn't).
- If you're using
fetchpriority=highfor the LCP resource. - Whether the request is discoverable directly from the main HTML document.
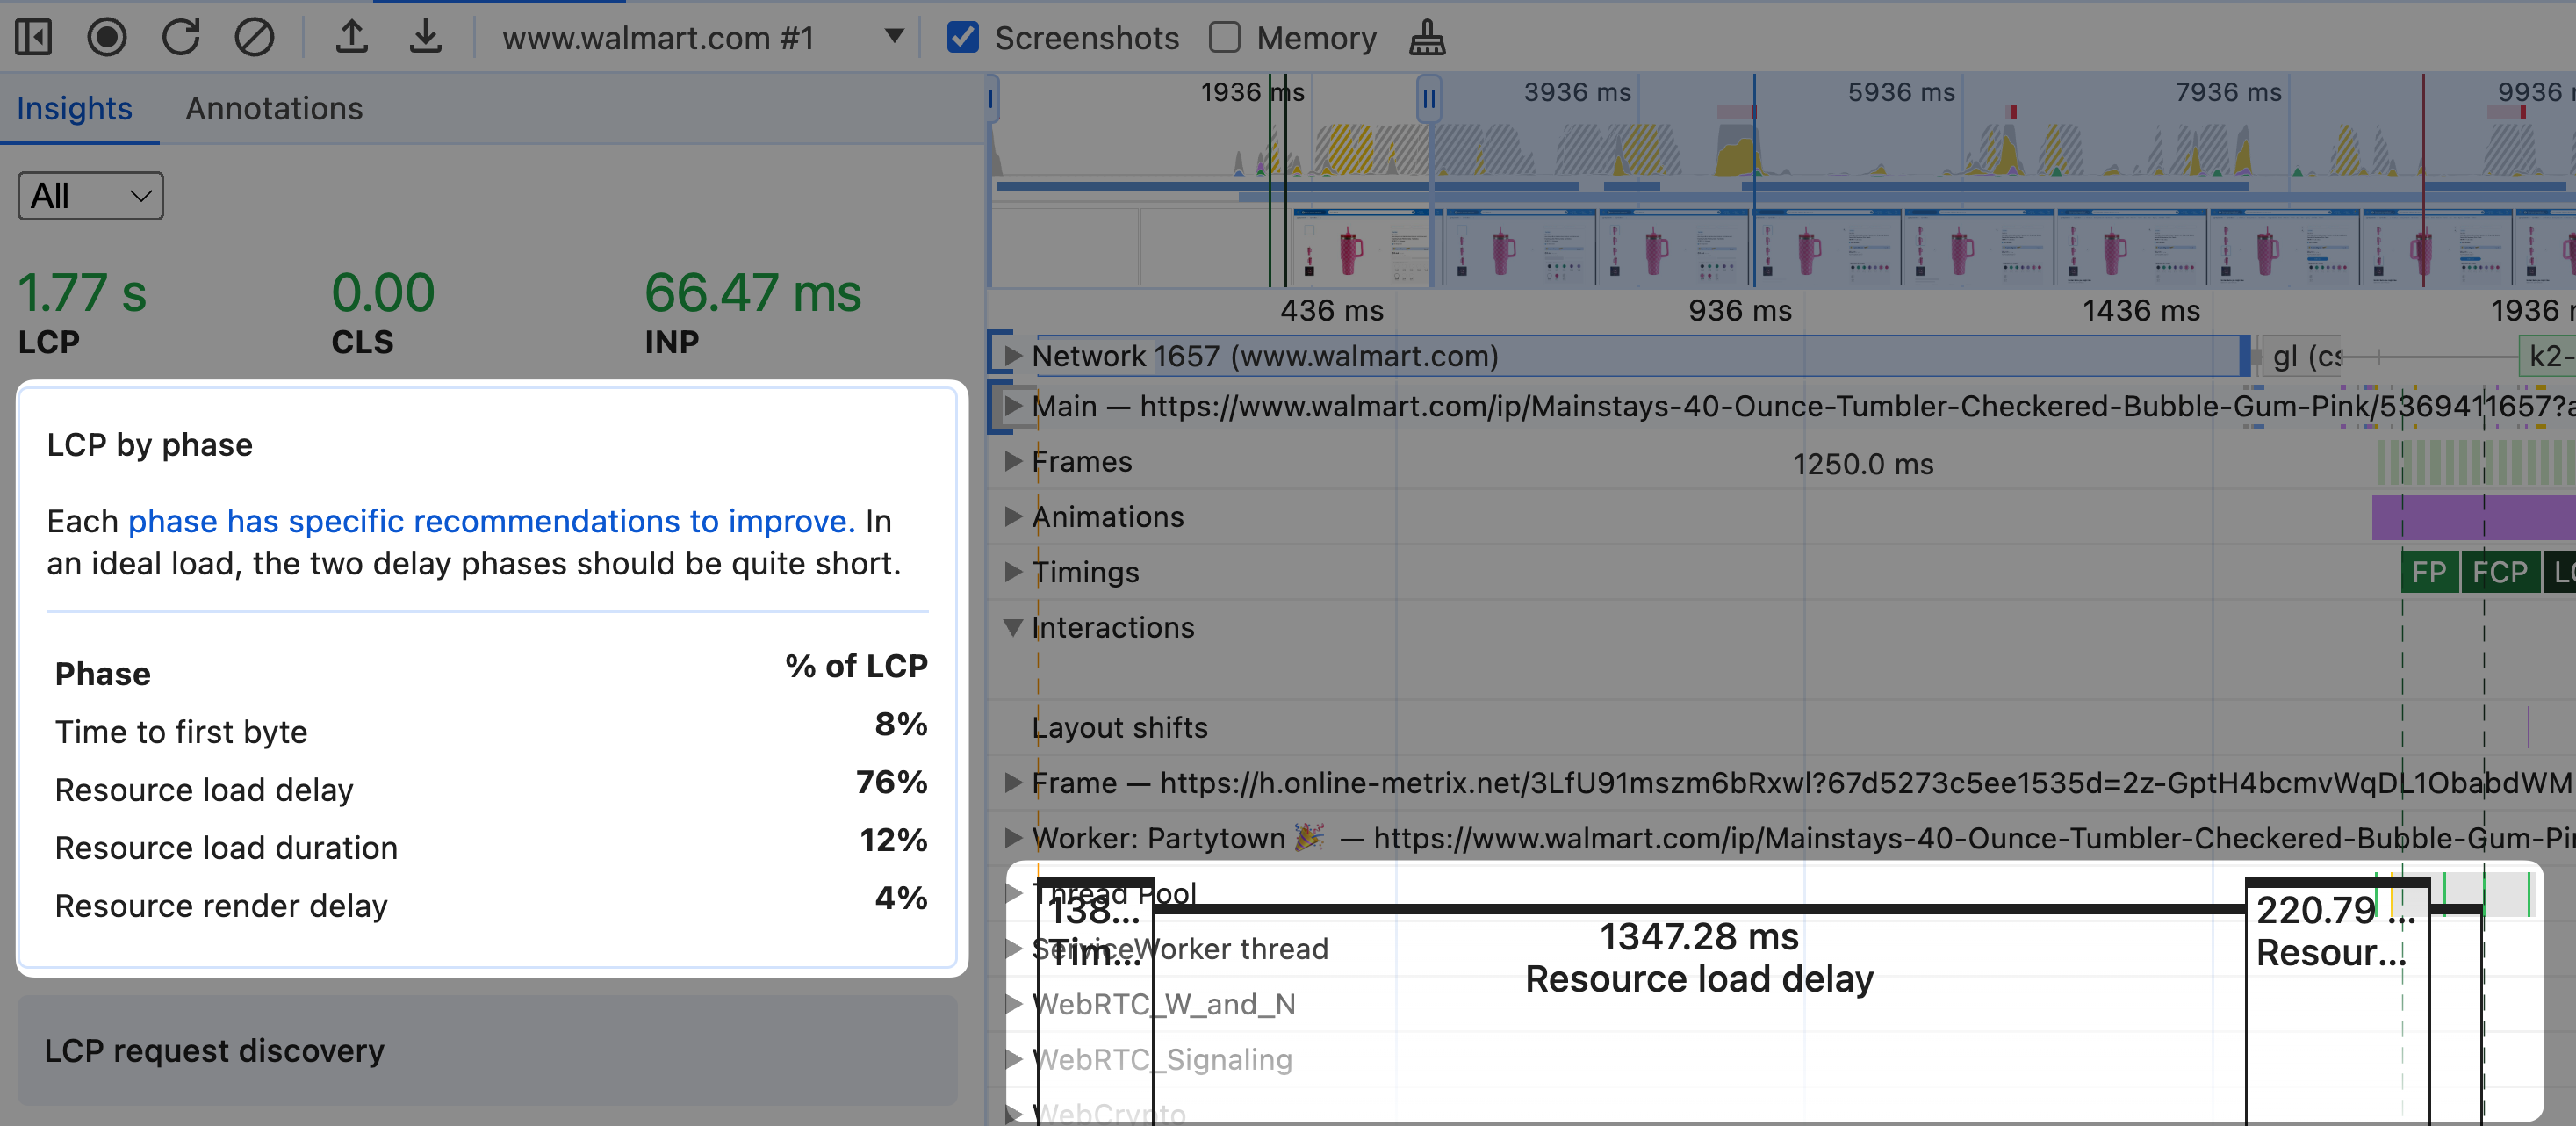
LCP by Phase
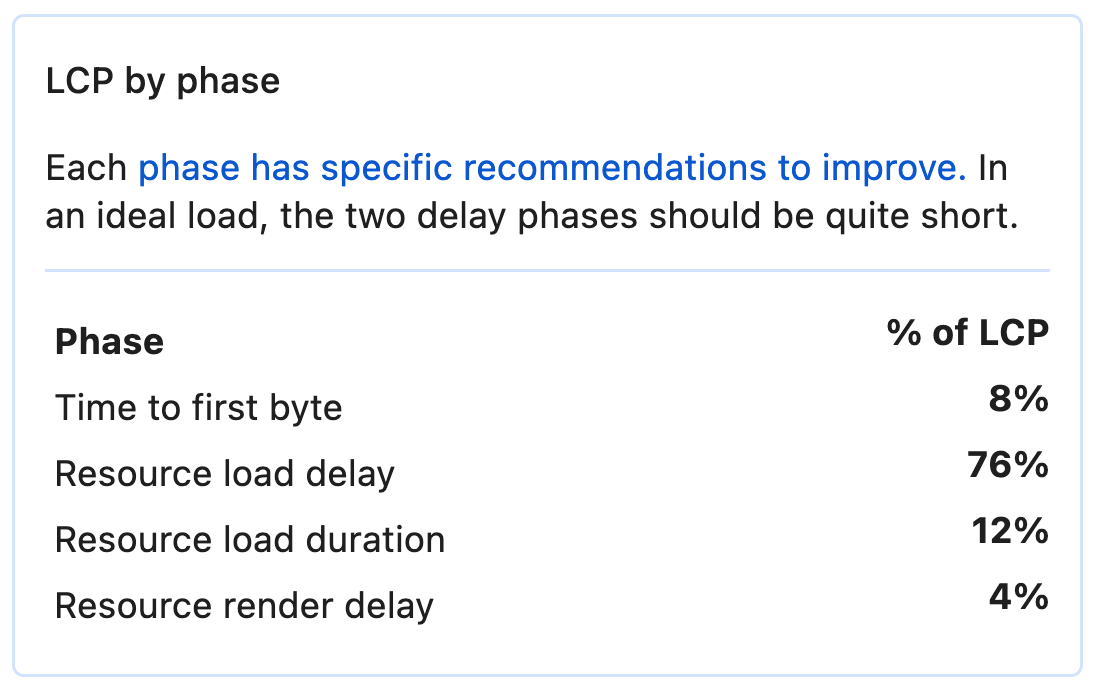
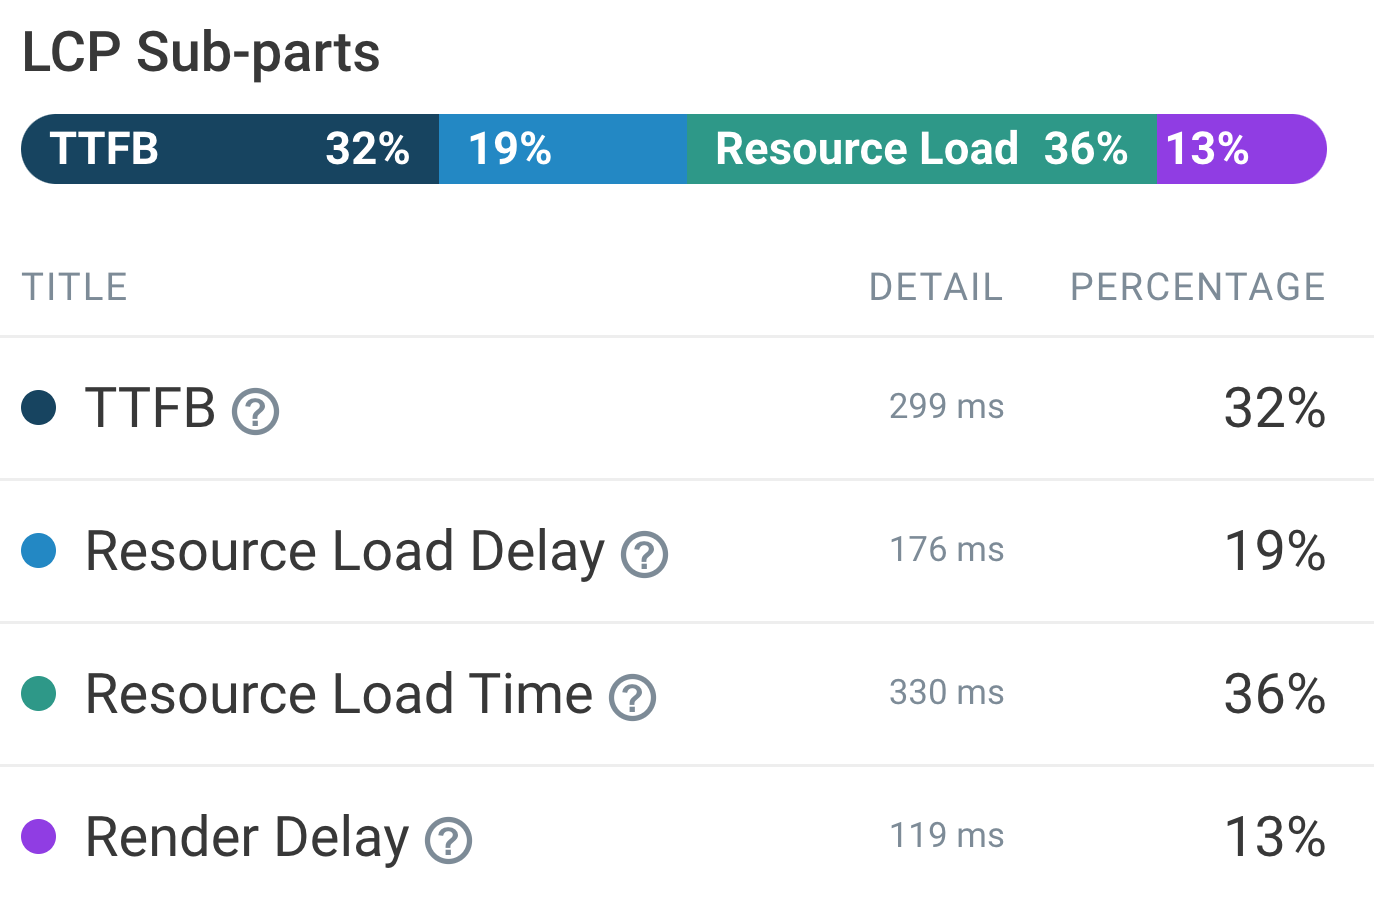
The LCP by phase section also shows up once you collect a page load recording through the Performance Panel. This section breaks down the LCP timing into different phases, also known as LCP sub-parts. It includes:
- Time to first byte: The time taken to receive the first byte of the HTML document response.
- Resource load delay: The time taken to discover and request the LCP resource.
- Resource load duration: The time taken to download the LCP resource.
- Resource render delay: The time taken to render the LCP resource, once downloaded.
When you open this section, DevTools overlays annotations on the performance panel profile, visually breaking down the different LCP phases.
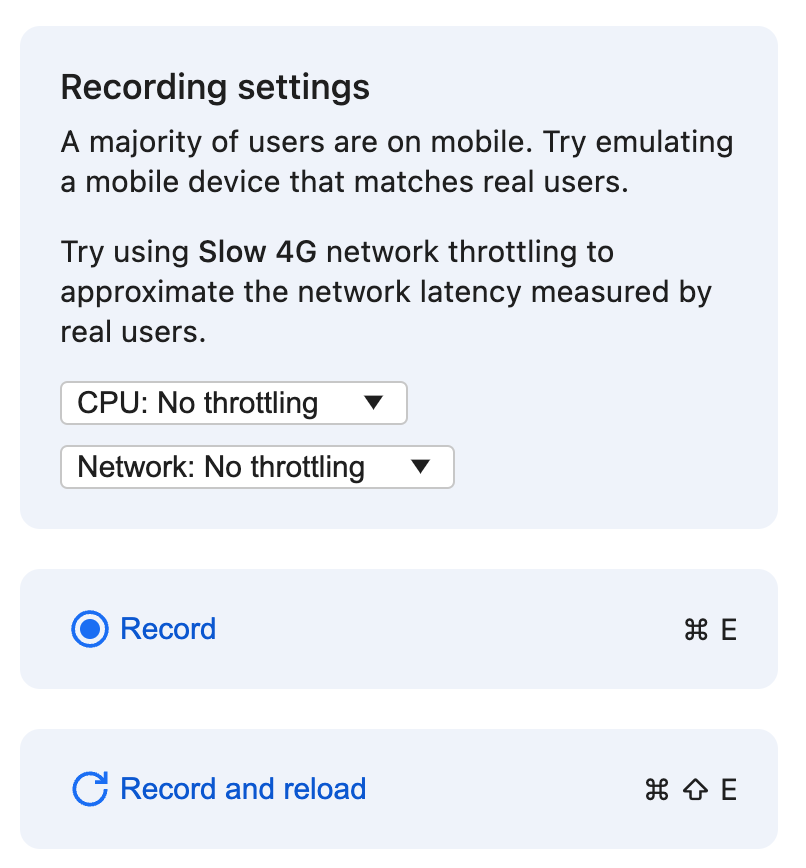
Recording and Throttling Controls
The updated Performance Panel also includes controls to:
- Start a new recording.
- Throttle CPU and network conditions, allowing you to simulate real user experiences.
How to Use the new Performance Panel features
Now that you know more about the new Performance features, here's how to enable and use these features in Chrome DevTools.
Enabling the Performance Panel Features
To access these new features, you'll need to enable some experiments in Chrome Canary DevTools:
- Download, install, and open Chrome Canary from here.
- Open Chrome DevTools (Cmd + Alt + I / F12 on Windows).
- Go to the Settings panel of DevTools (click the gear icon or press F1).
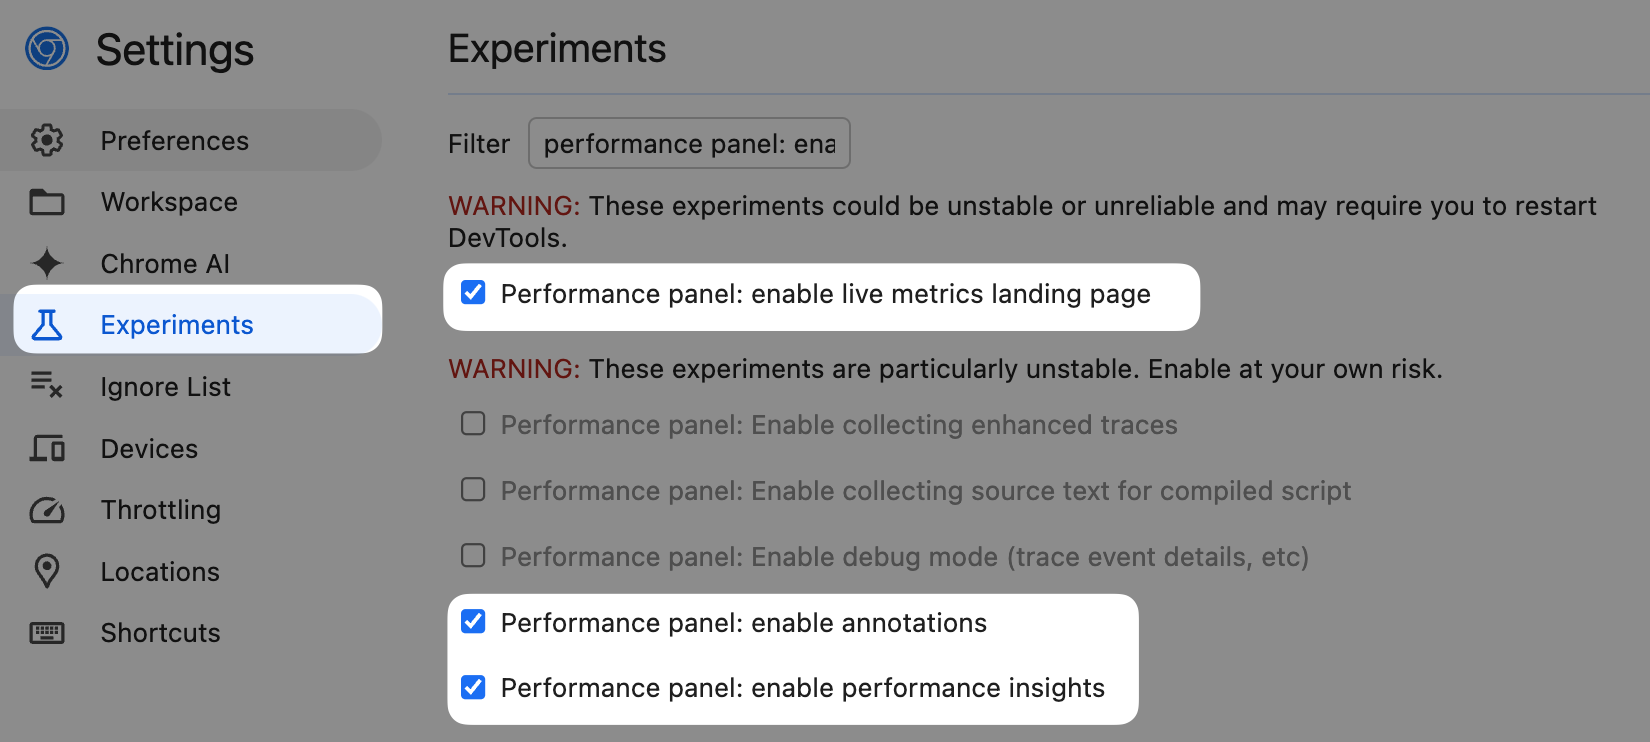
- Navigate to the Experiments tab.
- Enable the following experiments:
- "Performance panel: enable live metrics landing page"
- "Performance panel: enable annotations"
- "Performance panel: enable performance insights"
- Reload DevTools with Alt + R, and also reload the current webpage.
Configuring CrUX Access
CrUX data within the Performance Panel is opt-in, as the URL you are viewing is sent to the CrUX API.
DevTools provides a privacy disclosure when you enable CrUX data access.
To enable this feature and view field data from the Chrome User Experience Report:
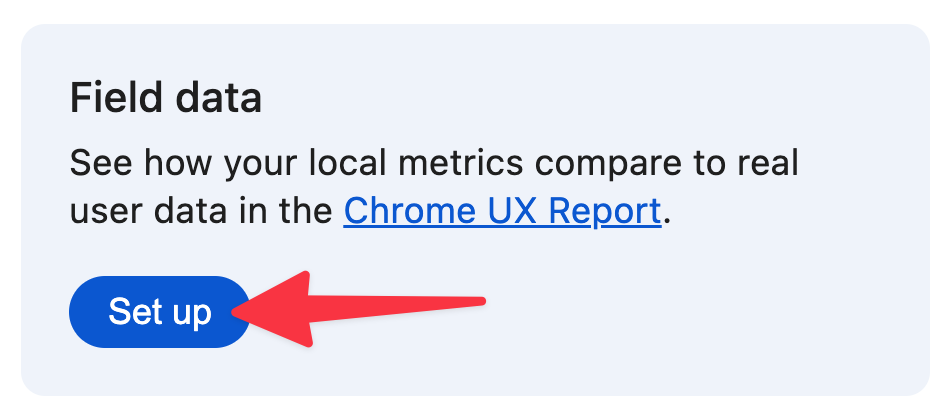
- In the new Performance Panel landing page, click Set up under Field Data.
- Click "Ok" to opt in.
That's it! You're now set up to view field data from CrUX. It's a good time to familiarize yourself with the customizations available, such as choosing between origin-level and URL-level data, and selecting device types.
Choosing Between Origin and URL Data:
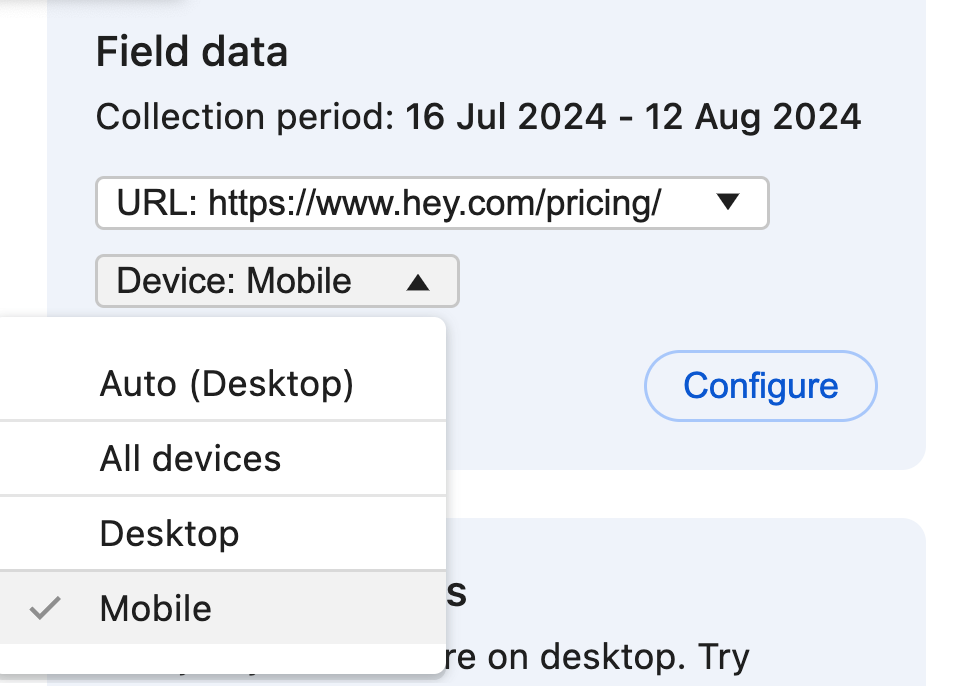
Selecting Device Types:
A Quick Refresher on Core Web Vitals
Core Web Vitals are three metrics that Google considers important in a webpage's overall user experience. The Core Web Vitals are:
- Largest Contentful Paint (LCP): How quickly does the main page content render?
- Interaction to Next Paint (INP): How quickly does the page respond to user input?
- Cumulative Layout Shift (CLS): How stable is the visual page layout?
Core Web Vitals can be measured in both lab and field environments. Google currently uses Core Web Vitals as a ranking factor in search results, making them important for SEO.
Does your website pass Core Web Vitals? Run a Core Web Vitals test on your website to see how you're performing:
Run A Free Page Speed Test
Test Your Website:
- Automated Recommendations
- Detailed Request Waterfall
- Web Vitals Assessment
At this point, you understand what the new Performance Panel features are, how to enable them, and how to configure them for your needs. Next, you'll see some ways to incorporate these Performance features into your workflow.
Using The New Performance Features in Your Workflow
At this point, you know how to access and configure the new Performance Panel. But what are some ways of incorporating it into your development and performance debugging workflow?
-
Continuous Monitoring: Keep the Performance Panel open while browsing your site (and competitors' sites) to quickly gauge Core Web Vitals performance across different pages.
-
Development Feedback Loop: Use it during performance debugging and development. Take note of small improvements to lab data as you make changes.
Also think about regressions: for example, you might fix an LCP issue by loading it earlier, but this could exacerbate CLS issues as other network resources are now delayed.
-
Comparative Analysis: Use the origin vs URL data to understand how specific pages perform compared to your site as a whole.
-
Device-Specific Optimization: Regularly switch between mobile and desktop views to ensure good performance across devices.
-
Interaction Testing: Click around your page to trigger INP measurements and identify slow interactions.
Understanding the Data: Lab vs Field in The Performance Panel
It's time to dive deeper into interpreting the data that the Performance Panel provides. One important concept to understand is the difference between lab data and field data.
Why Lab and Field Data Differ
Lab data and field data measure performance differently:
- Lab Data is collected in a controlled environment with specific device and network settings.
- Field Data represents real-world usage across various devices, networks, and user behaviors.
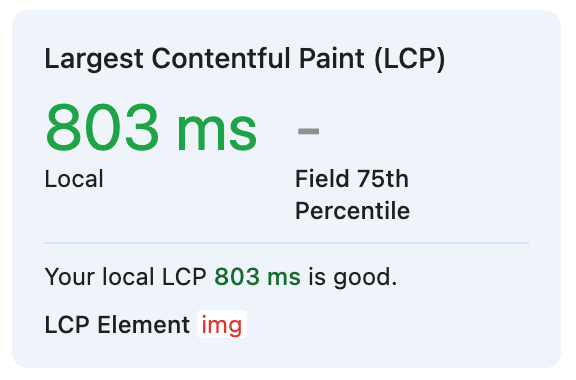
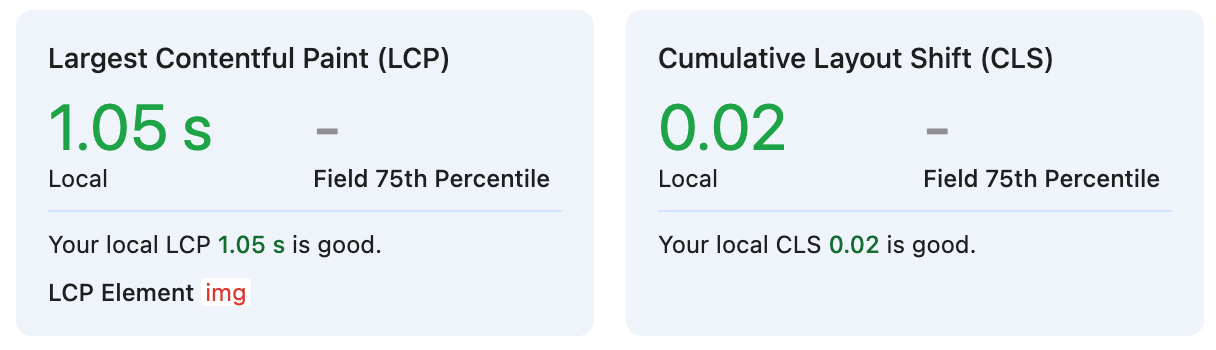
When you're using the new Performance Panel, it's important to check both lab and field data. For example, the following screenshot shows a "Good" lab score for the LCP metric as the page was opened on a fast network with a fast machine:
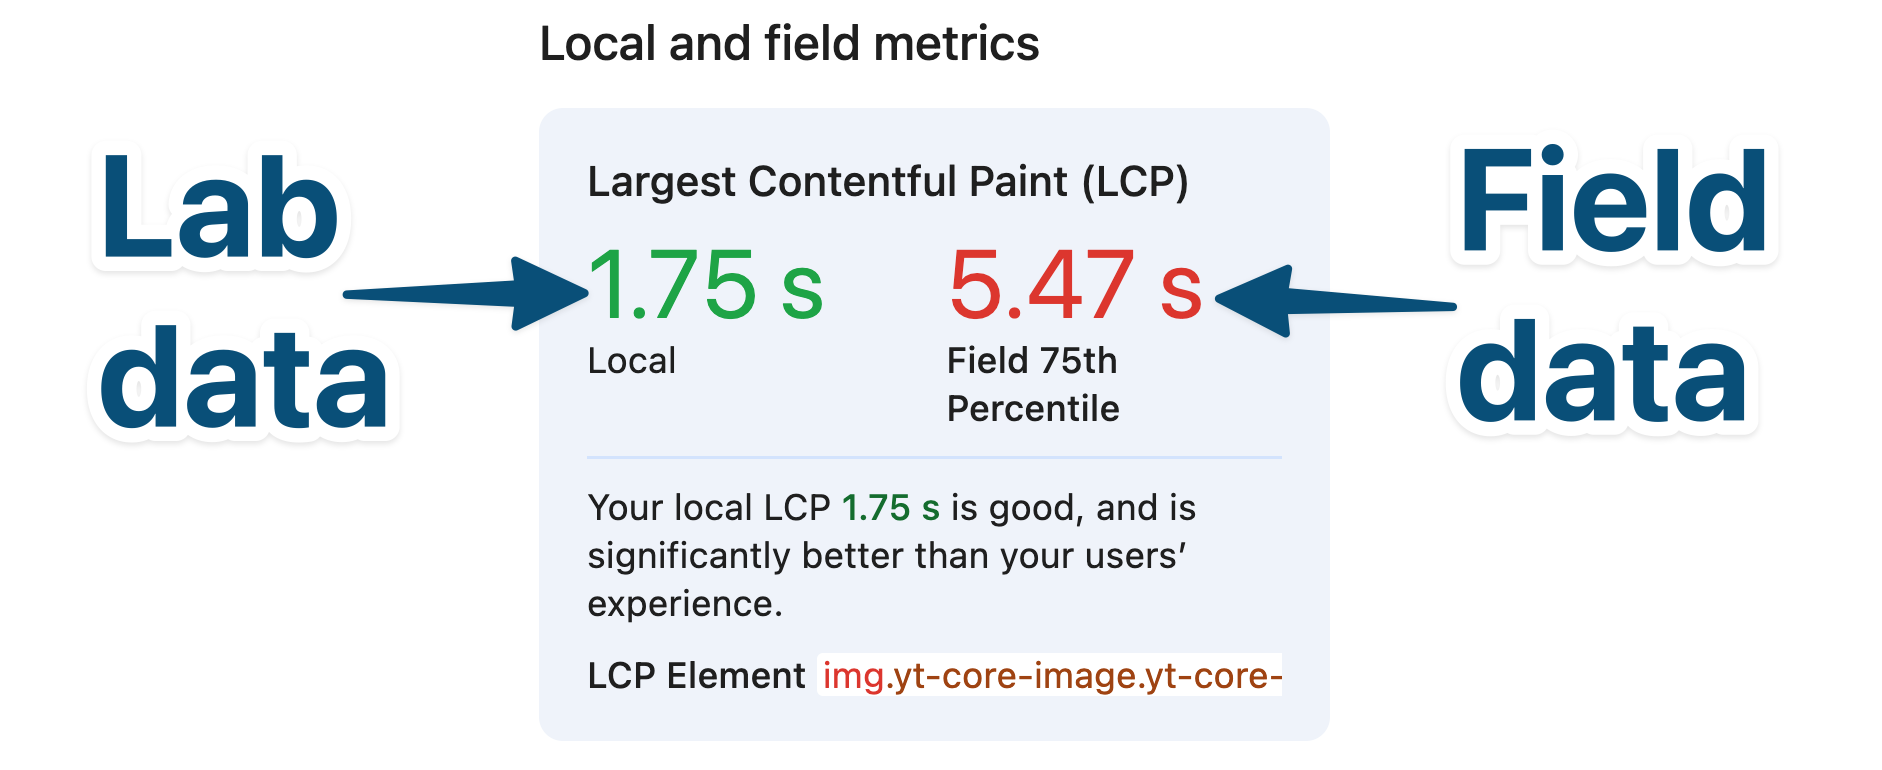
However note on the previous screenshot that the same LCP metric, while on the same page, has a "Poor" field score. The differences in these scores are completely normal, but this highlights the importance of checking both types of data for your Core Web Vitals.
Origin-level vs URL-level Data
A website, or URL, might not even be in the CrUX dataset if it is not popular enough - among other factors.
The Performance Panel allows you to toggle between origin-level and URL-level data for your field metrics.
When to use which:
- Use origin-level data when you want to understand your site's overall performance or when dealing with low-traffic pages.
- Use URL-level data when optimizing specific, high-traffic pages or when investigating page-specific issues.
Real-world Performance Insights
This section applies some concepts covered earlier, to analyze the performance of one popular travel website.
In this case study, 4x CPU is applied along with a "Fast 4G" network condition.
The first thing to note is that lab and field metrics are similar in values, which may suggest that the throttling conditions are representative of real-world conditions - however this could also be a coincidence.
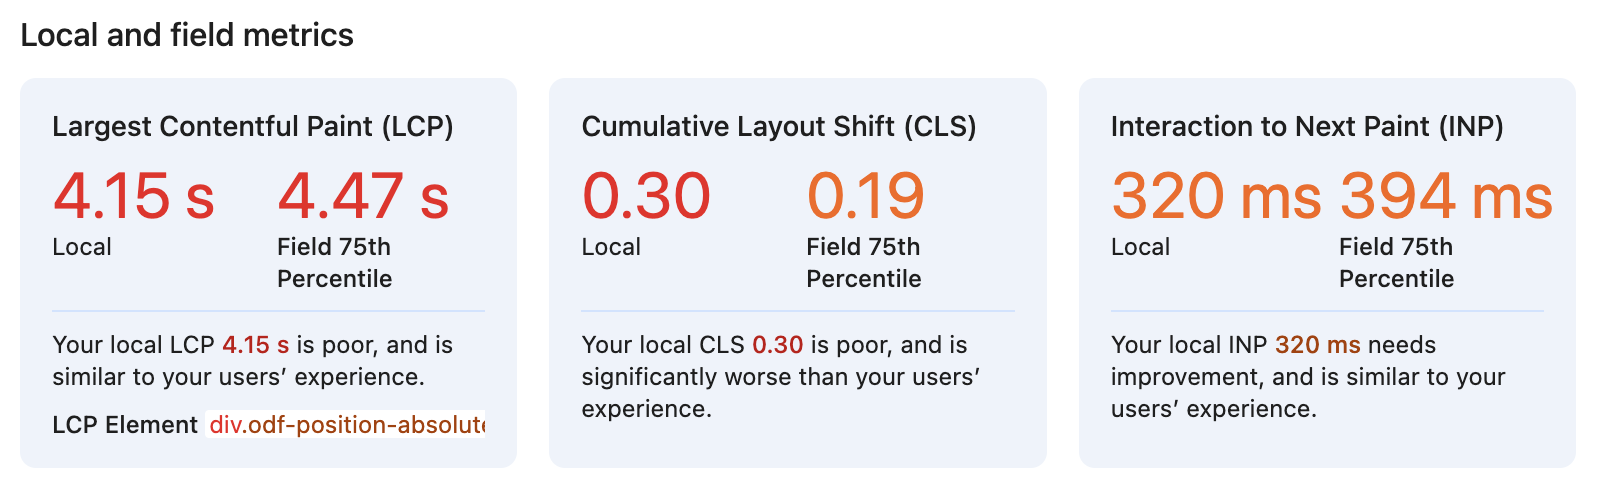
Analyzing LCP (Largest Contentful Paint) of the Opodo website
- Lab Data: 4.15s
- Field Data: 4.47s (75th percentile)
The Opodo website has a "Poor" LCP score in both lab and field data. This indicates that the main content on the page takes too long to render, potentially due to large images or slow server response times.
Analyzing CLS (Cumulative Layout Shift) of the Opodo website
- Lab Data: 0.30
- Field Data: 0.19 (75th percentile)
This website has a "Poor" CLS score in lab data and a "Needs Improvement" score in field data. This indicates that there are lots of unexpected layout shifts happening on the page, which can be frustrating for users.
Analyzing INP (Interaction to Next Paint) of the Opodo website
- Lab Data: 320ms
- Field Data: 394ms (75th percentile)
This website has a "Needs Improvement" INP score in both lab and field data. This suggests that user interactions are not as responsive as they could be, possibly due to heavy JavaScript execution or long main thread tasks.
Understanding LCP from the Performance Panel
The new Performance Panel sidebar offers an Insights pane that provides additional information about the LCP metric. To get access to the sidebar, you first need to capture a page load recording. To do this, click the "Record and reload page" button in the Performance Panel, or use the shortcut Cmd + Shift + E on macOS, or Ctrl + Shift + E on Windows.
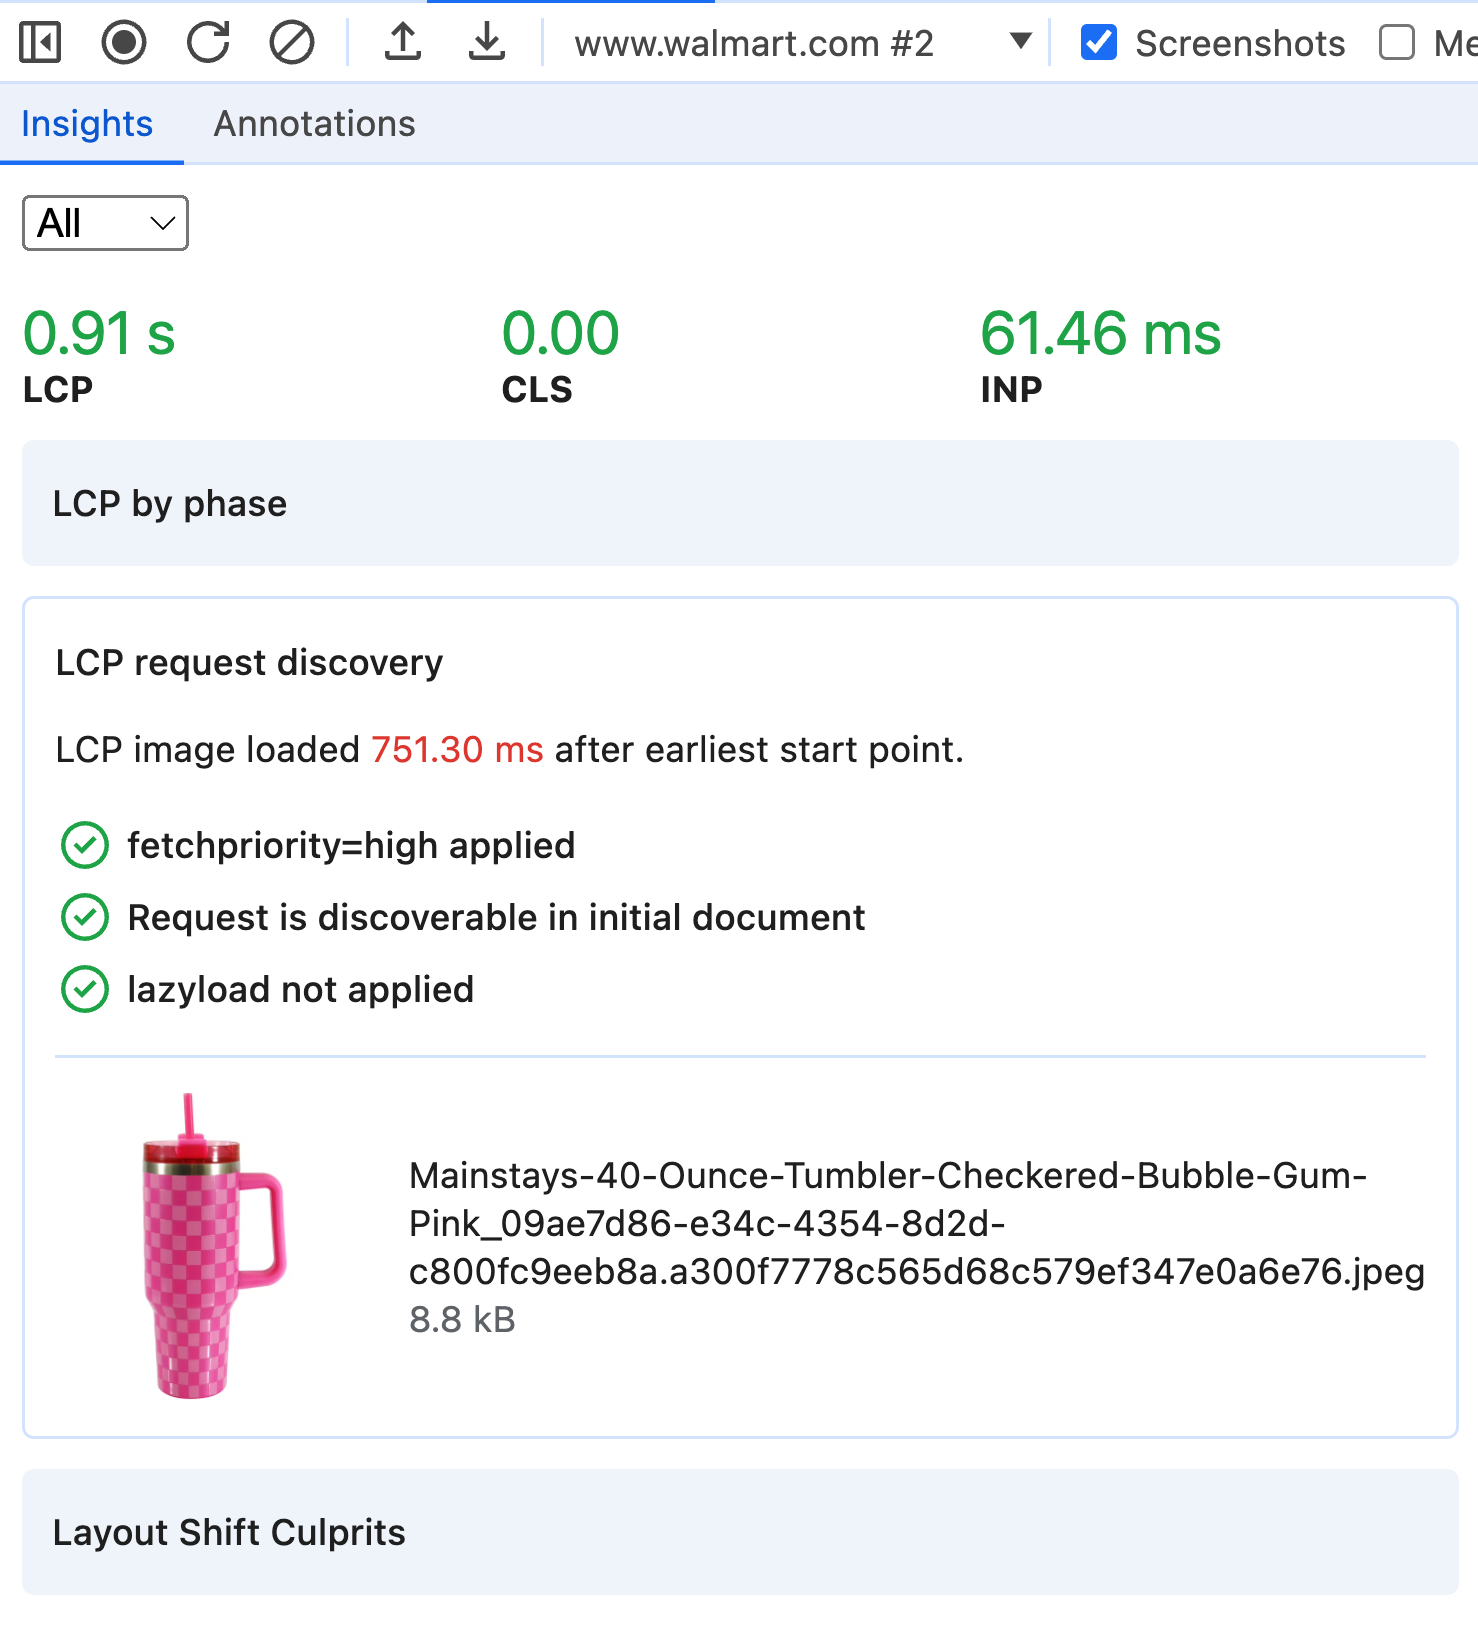
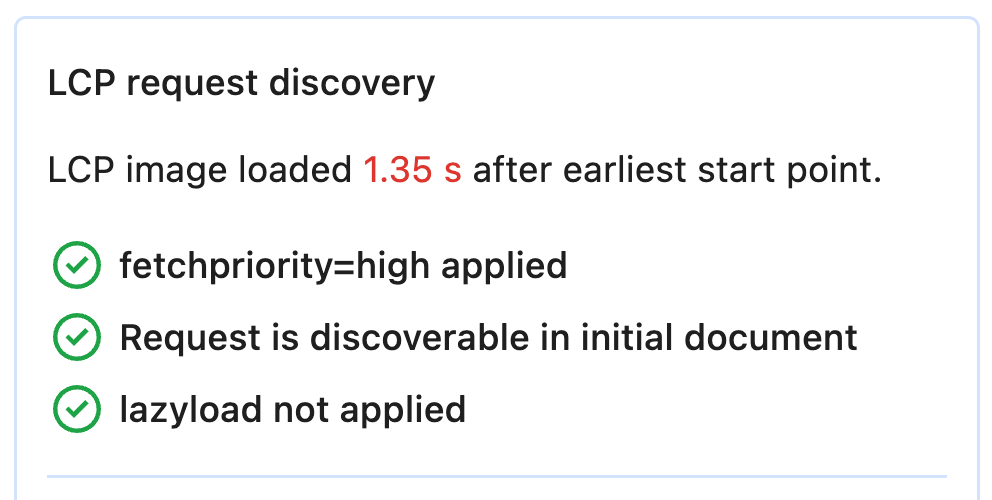
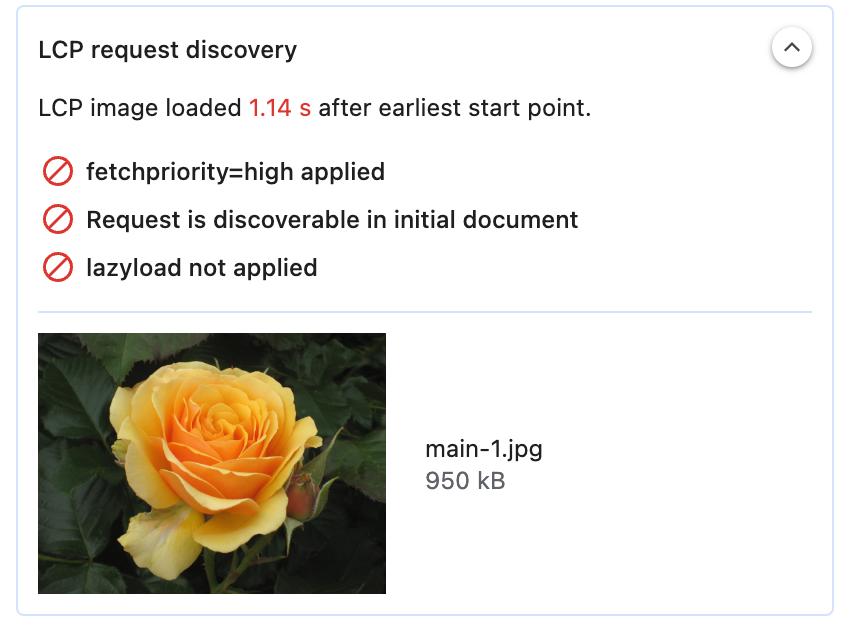
Opening up the Insights pane from the sidebar, you can see the following information from the LCP requests discovery section:
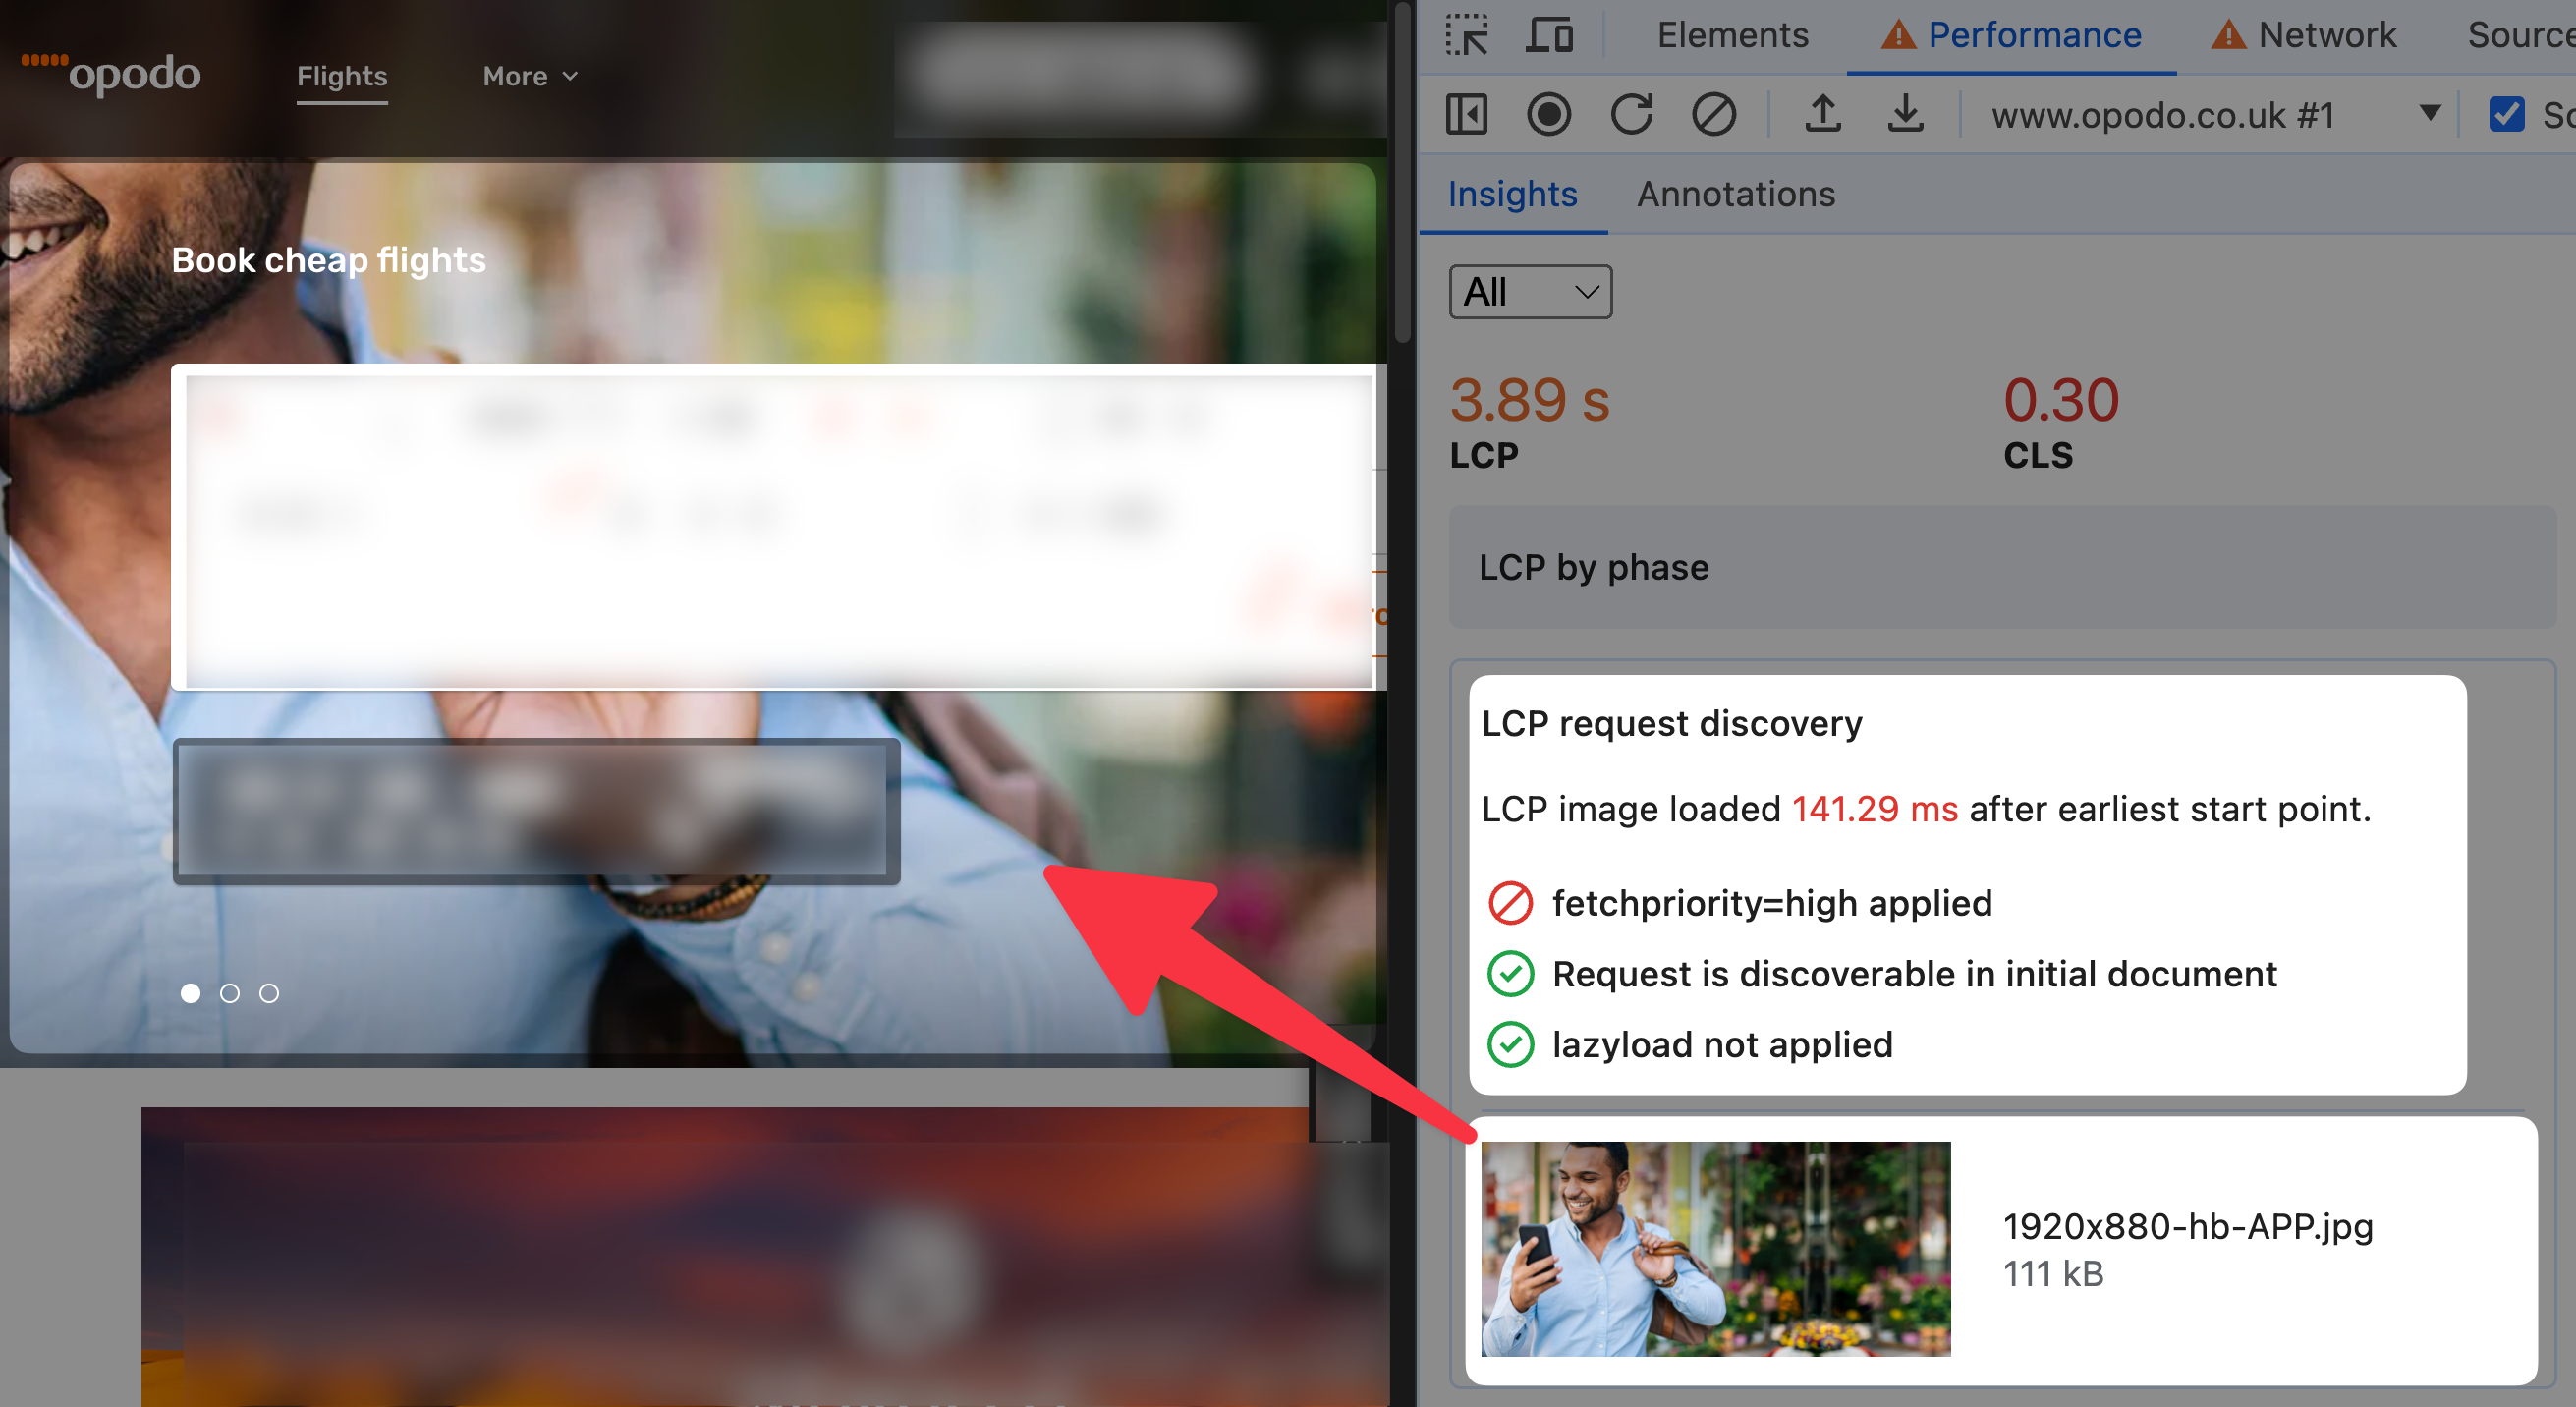
From the previous screenshot, you can infer a few key points:
The LCP resource is an image
An LCP element is typically an image, video, or text block. In this case, the LCP element is an image
The fetchpriority=high attribute is not used
While the image is discoverable from the main HTML document and lazy loading is not used (good), the fetchpriority=high attribute is not set (generally, not good) on the LCP element resource.
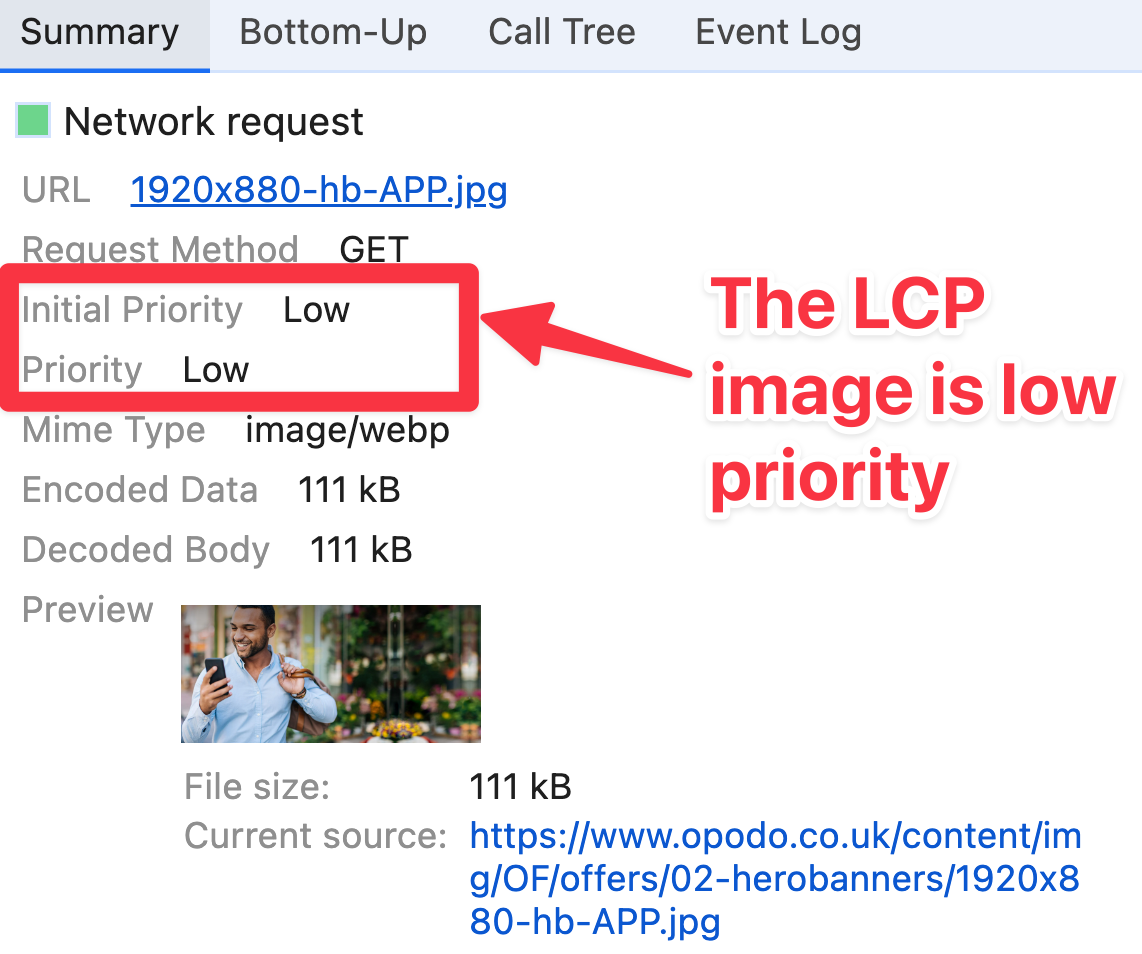
From the Network Summary view in the Performance Panel, it becomes clear that the LCP image is treated as a low priority request.
Element Render Delay takes a long time
The LCP by Phase section specifies that a large amount of time is spent on Element Render Delay. This tells us that even after the image is downloaded, it takes a long time to render the image on the page.
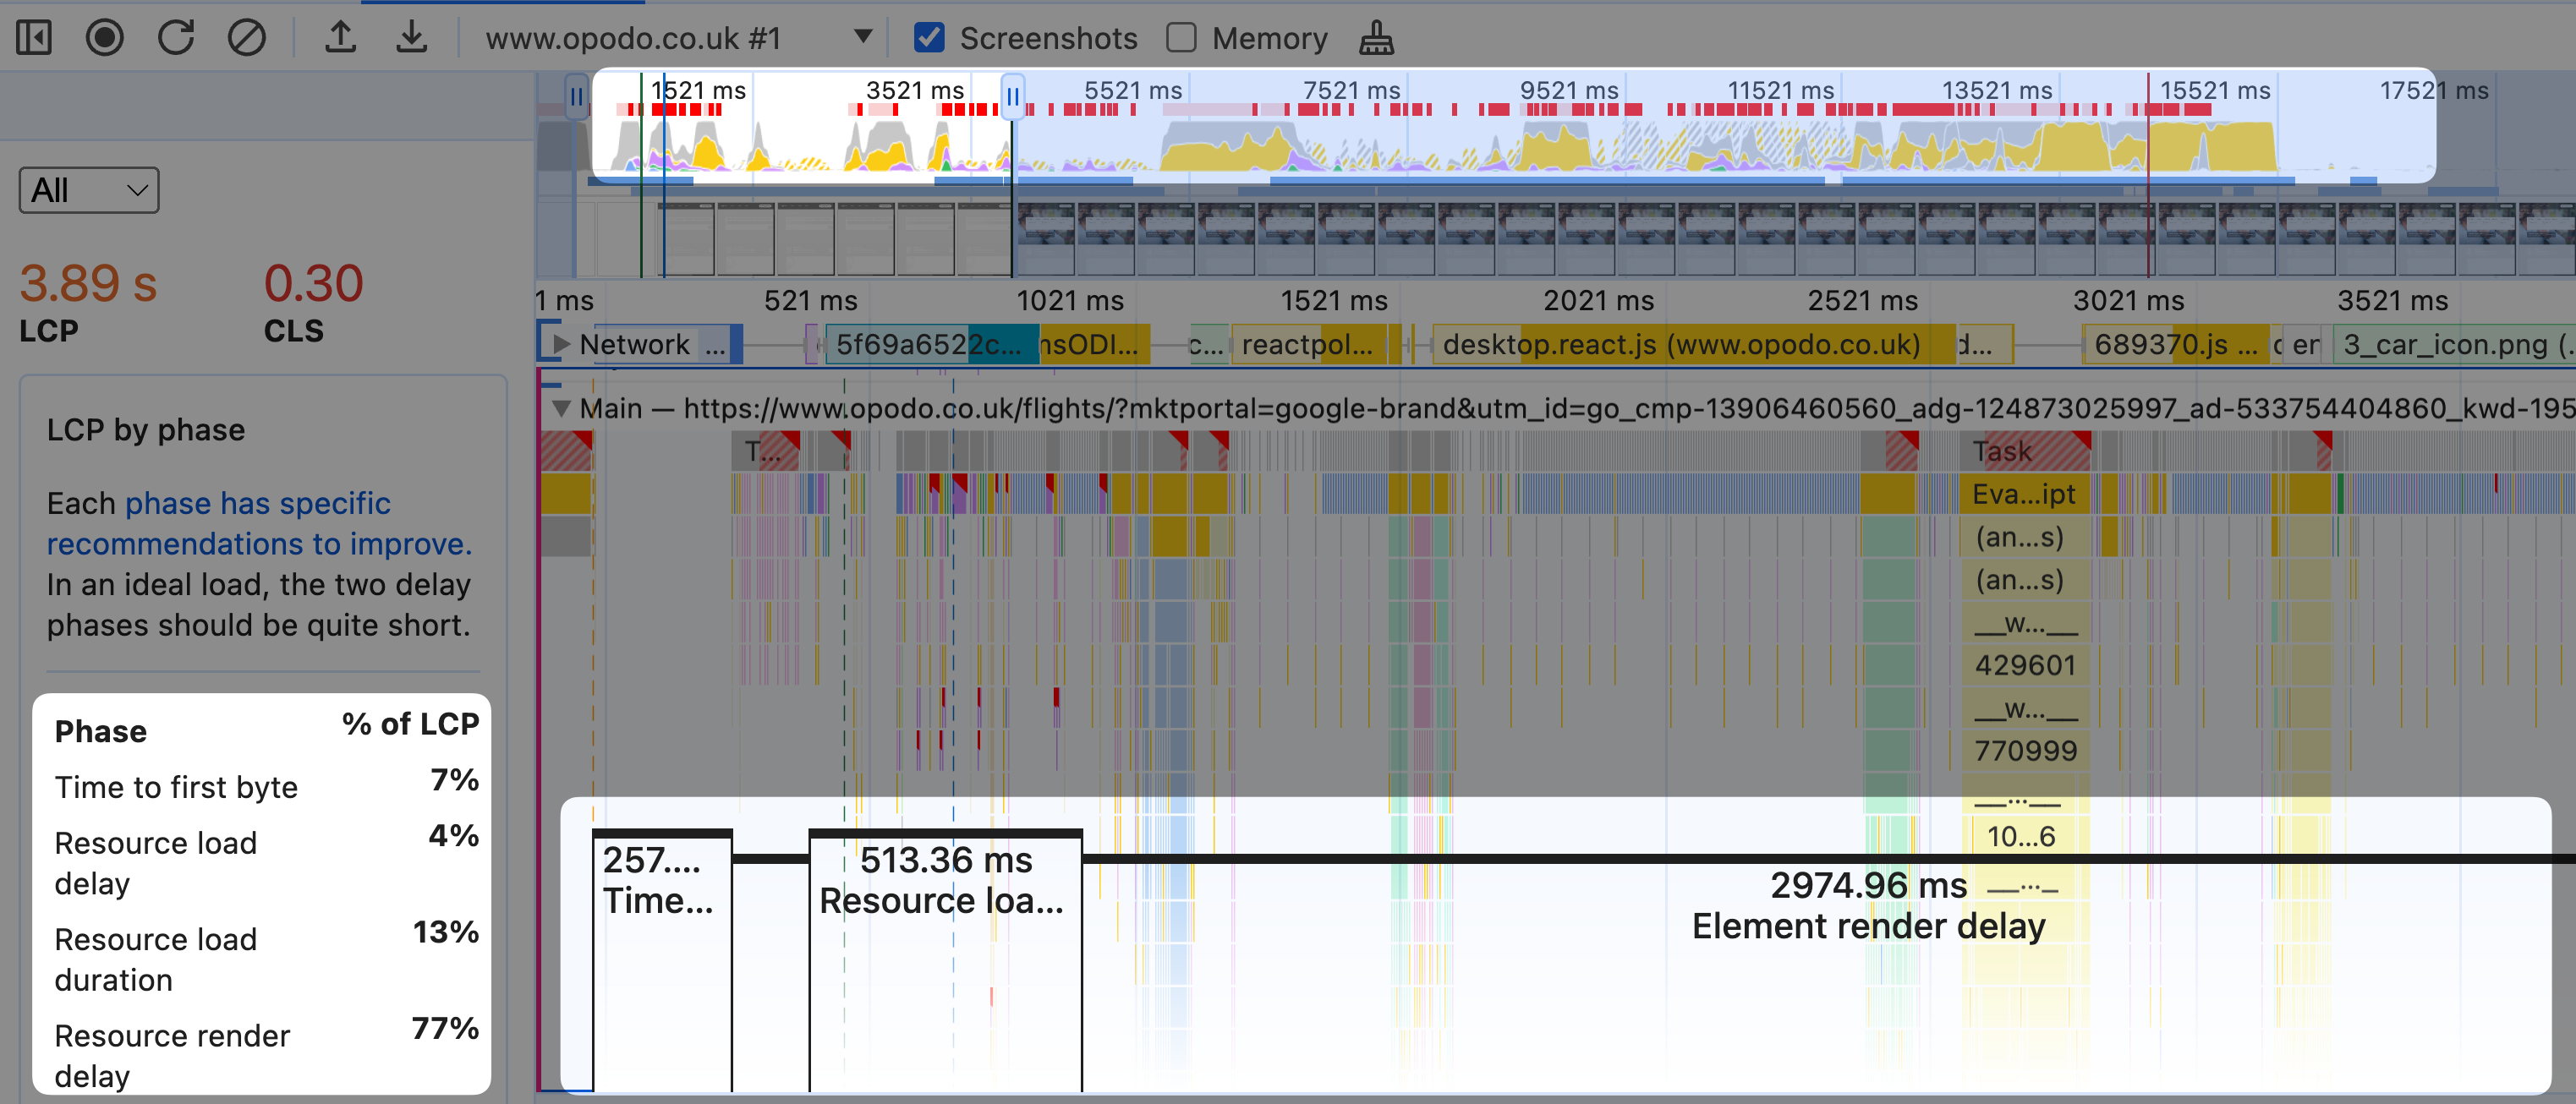
Interestingly, the LCP image appears to be part of an auto-playing carousel on the Opodo home page. This suggests that the JavaScript-powered carousel might be causing the delay in rendering the image. The previous screenshot confirms a lot of activity happening during the various LCP phases.
Considering the carousel auto-plays, it could also be the case that a subsequent image in the carousel becomes an updated LCP element.
Resource Load Duration takes a long time
The LCP by Phase section also shows that the Resource Load Duration is quite high - at half a second.
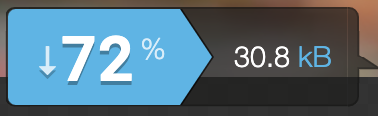
It's great that the WebP image format is used, however Squoosh could be used to convert the image to the AVIF image format for even better performance.
In a quick test, the WebP image went from over 100kb to 30kb when converted to AVIF:
The LCP image used is also very large, at 1920 x 880 pixels - however this doesn't match the size that the image gets displayed at on the page, at least during this test. Using srcset, or image-set for background images can help reduce the image size for smaller screens. This in turn reduces the Resource Load Duration.
It's easy to assume that the main LCP image is partly delayed because of the LCP-related JavaScript execution - for example, the JavaScript carousel code. However you should confirm such assumptions from the DevTools performance profile. It's possible that the main thread is busy with other tasks, causing the delay in rendering the LCP image.
Effective Use of The New Performance Panel
You've seen the new Performance Panel features, but how do you use these features effectively?
Where should I begin with DevTools Performance?
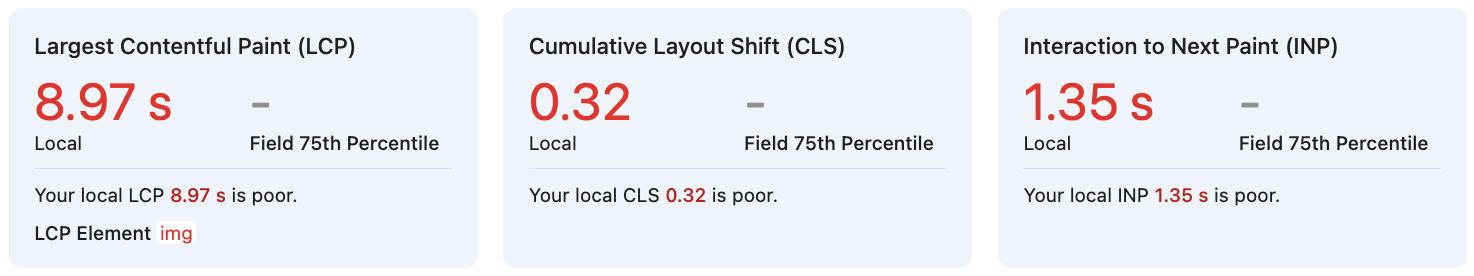
Considering that the Performance Panel is just one facet of DevTools, there's a lot to explore! We recommend you begin looking at poor field metrics for Core Web Vitals - these are highlighted in red.
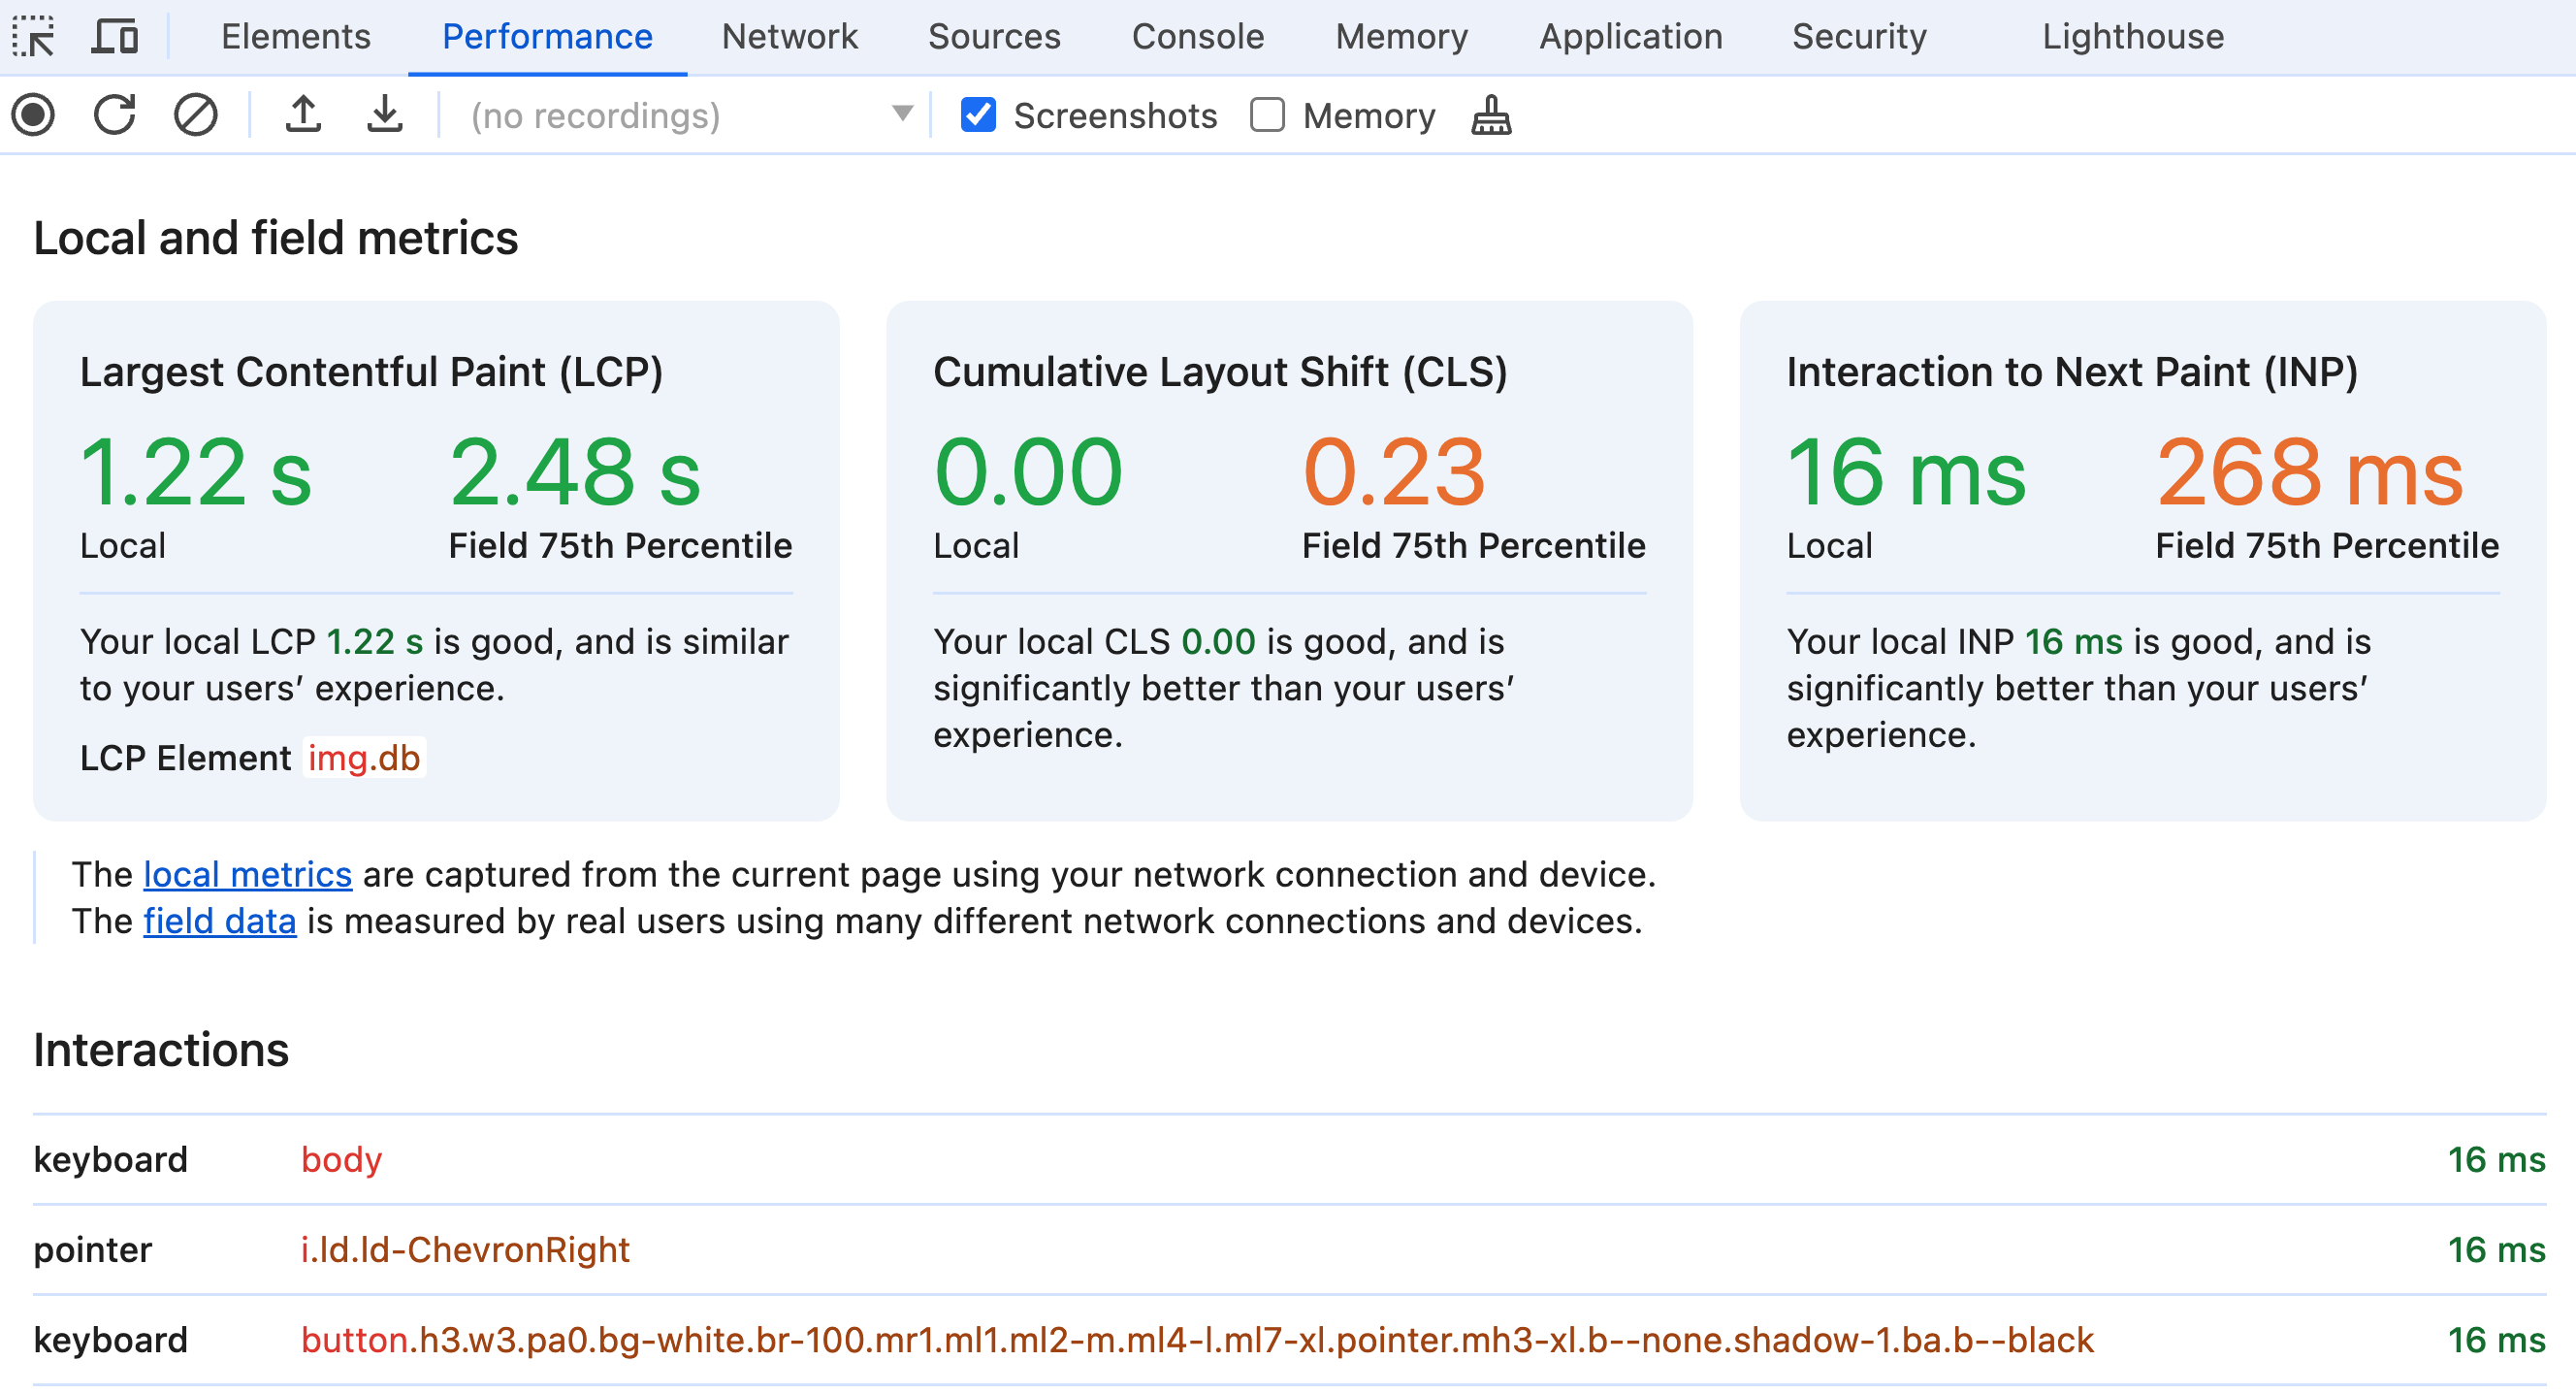
The following screenshot shows the three Core Web Vitals metrics, with the LCP field metric highlighted in red. In this scenario, you should begin by investigating the LCP metric:
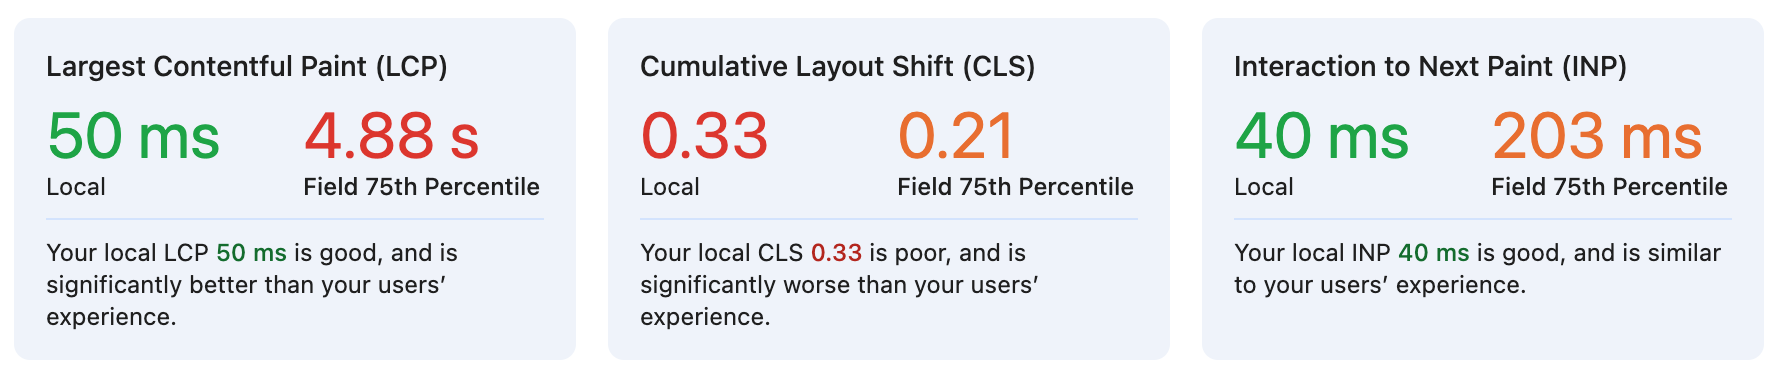
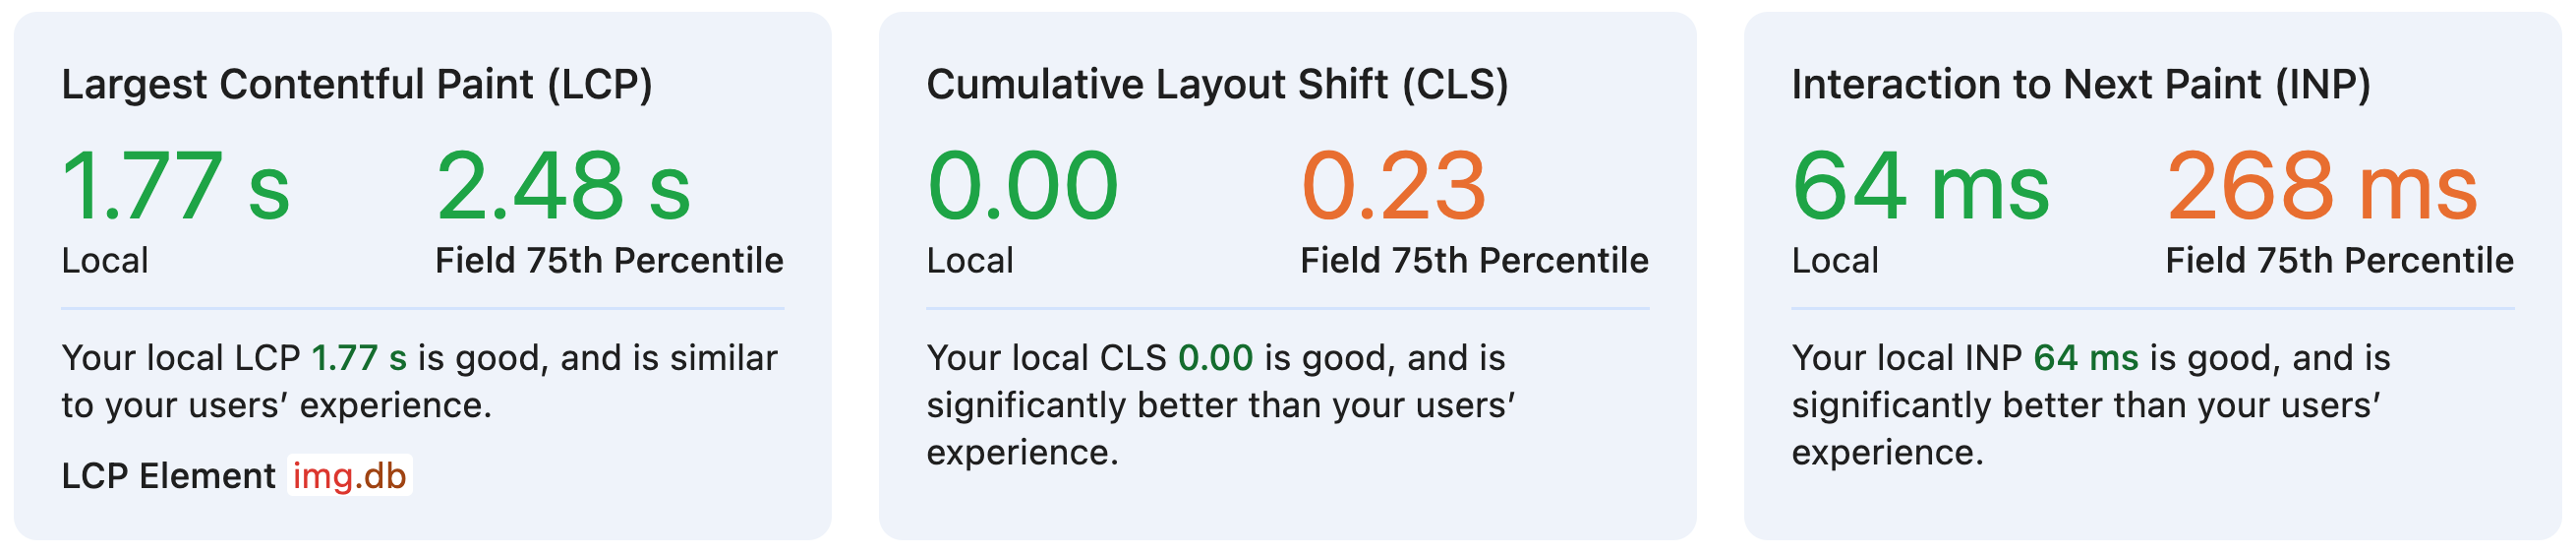
After fixing LCP, you're left with CLS and INP - these field metrics are showing as "Needs Improvement", so which should you focus on next?
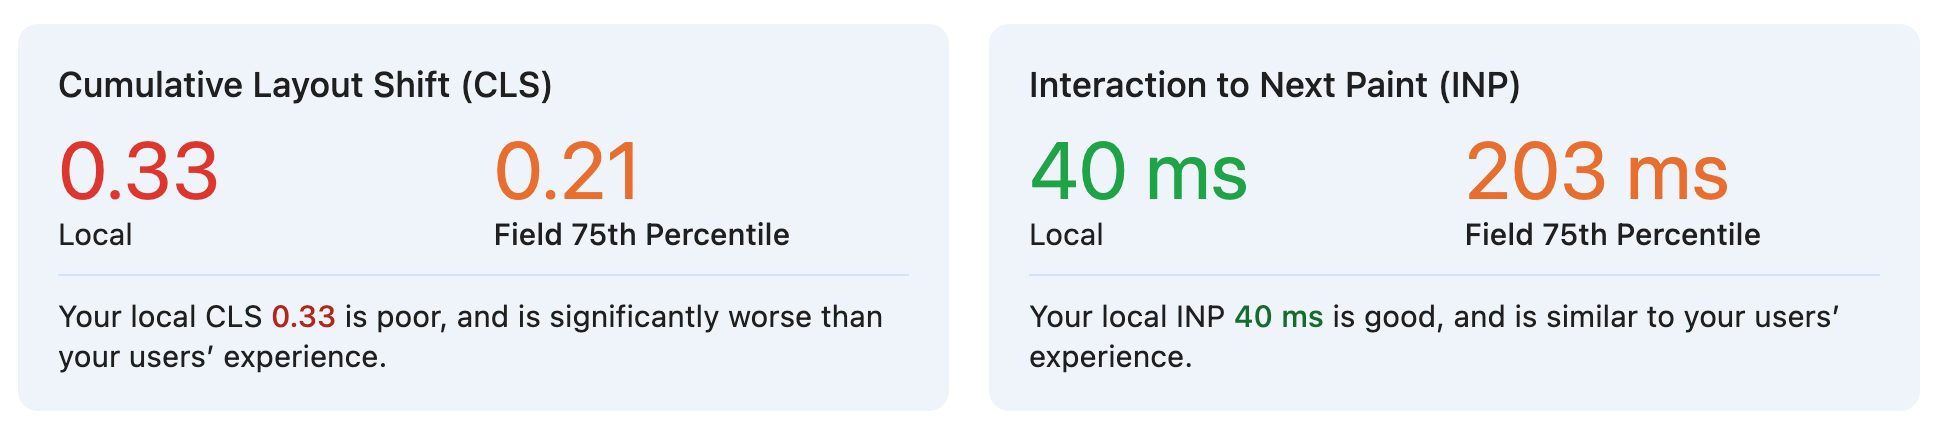
In this case, you may be able to find low-hanging fruit by focusing on CLS:
- The Local CLS metric is 0.33 (poor).
- The Local INP metric is 40ms (good).
Being able to reproduce poor Core Web Vitals metrics locally is not something to be taken for granted! So when you find a poor metric locally, it's a great opportunity to investigate and fix it.
If you hover over an individual metric, you can see the distribution of field data for that metric:
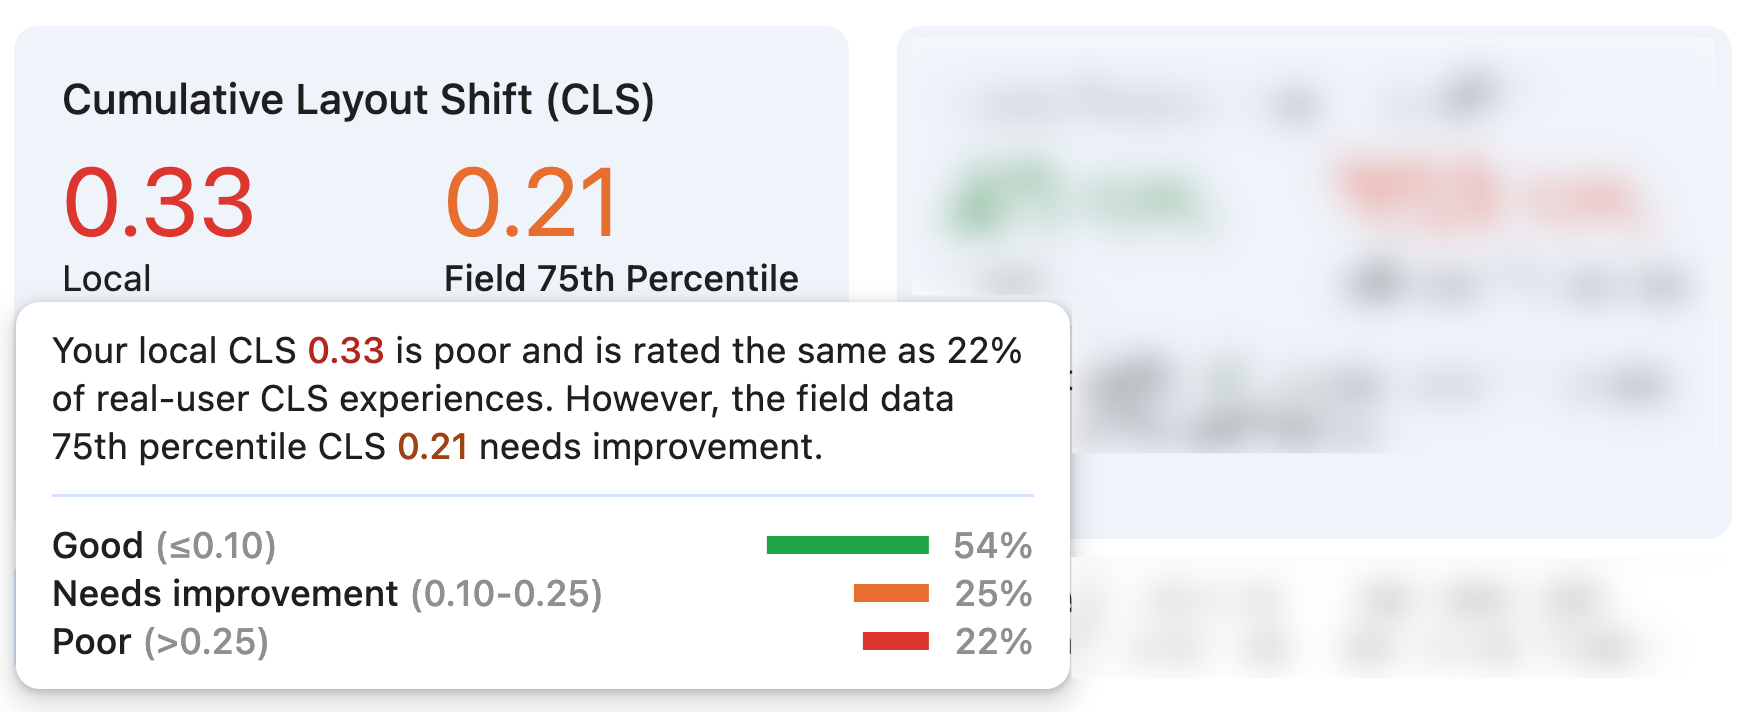
The previous screenshot shows how a significant portion of users do experience a "poor" or "needs improvement" CLS score. This is another signal that CLS is worth focusing on next.
When to Change the Device Dropdown for CrUX
Regularly switching between mobile and desktop views in the CrUX data can provide valuable insights.
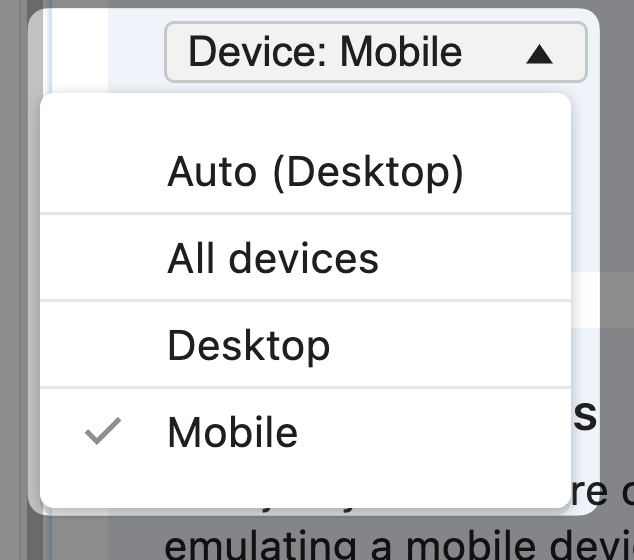
Often, Core Web Vitals metrics are worse on mobile:
- INP: Lower device hardware leading to a busier main thread.
- CLS: Slower network speeds exacerbating layout shifts as content arrives at different times.
- LCP: Slower network speeds resulting in slow image downloads.
Also, significant differences between mobile and desktop metrics can hint at different code-paths or code optimizations that are not working as expected.
Understanding INP in the Performance Panel
LCP and CLS can feel a bit more intuitive at times: You reload the page with DevTools and can see your LCP and CLS metrics. But what about INP?
INP requires a user interaction to be measured. This can be a mouse click, touchscreen tap, or keyboard interaction.
Based on this, you should note the following:
-
Visibility: INP only shows up when you interact with the page. If you don't see INP in your lab data, try clicking around the page.
-
Field vs Lab Data: INP might not show in your lab data but could appear in field data if it's present in the CrUX data.
-
Considered Interactions: INP considers mouse clicks, touchscreen taps, and keyboard interactions. Scrolling is not included.

The Impact of Throttling
The Performance Panel allows you to throttle CPU and network conditions. Here's why this is valuable:
-
CPU Throttling: Helps simulate performance of slower devices, providing a more realistic view of real-world performance.
-
Network Throttling: Allows you to test your site's performance under various network conditions, helping you optimize for users with slower or spotty network connections.
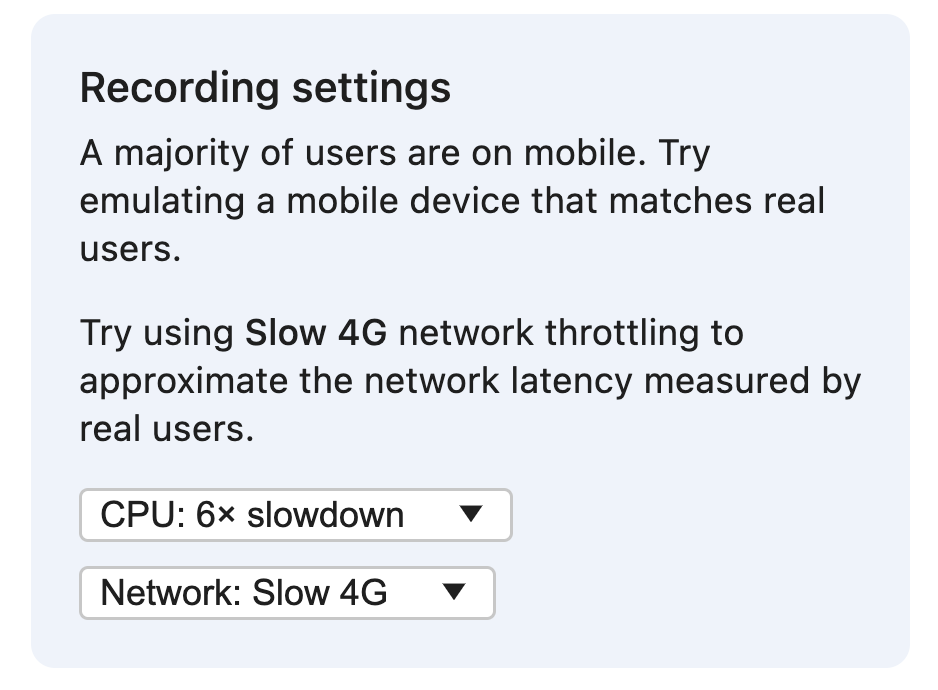
By using these throttling options, you can better understand how your site performs across a range of real-world scenarios.
Fixing Web Vitals Issues with the Performance Panel
An earlier section began to explore avenues for fixing Core Web Vitals issues. While this post is not a comprehensive guide on fixing web performance issues, the following sections provide some tips and strategies for addressing common Core Web Vitals problems - while using the new Performance Panel features within Chrome DevTools.
This section uses cwv-guide.vercel.app as the demo page which has performance issues, and uses cwv-guide.vercel.app/solution as the version with all Core Web Vitals fixes applied.
Before Optimization:
After Optimization:
Fixing LCP with the New Performance Panel
Start out by opening the Performance Panel. Load the demo page and notice the local LCP metric changes during the page load.
This LCP development is a great way to understand how the LCP metric is calculated.
While it's helpful to know that the LCP metric is updating, it can be unclear what specific elements are causing the LCP to change, and why they are causing the LCP to change.
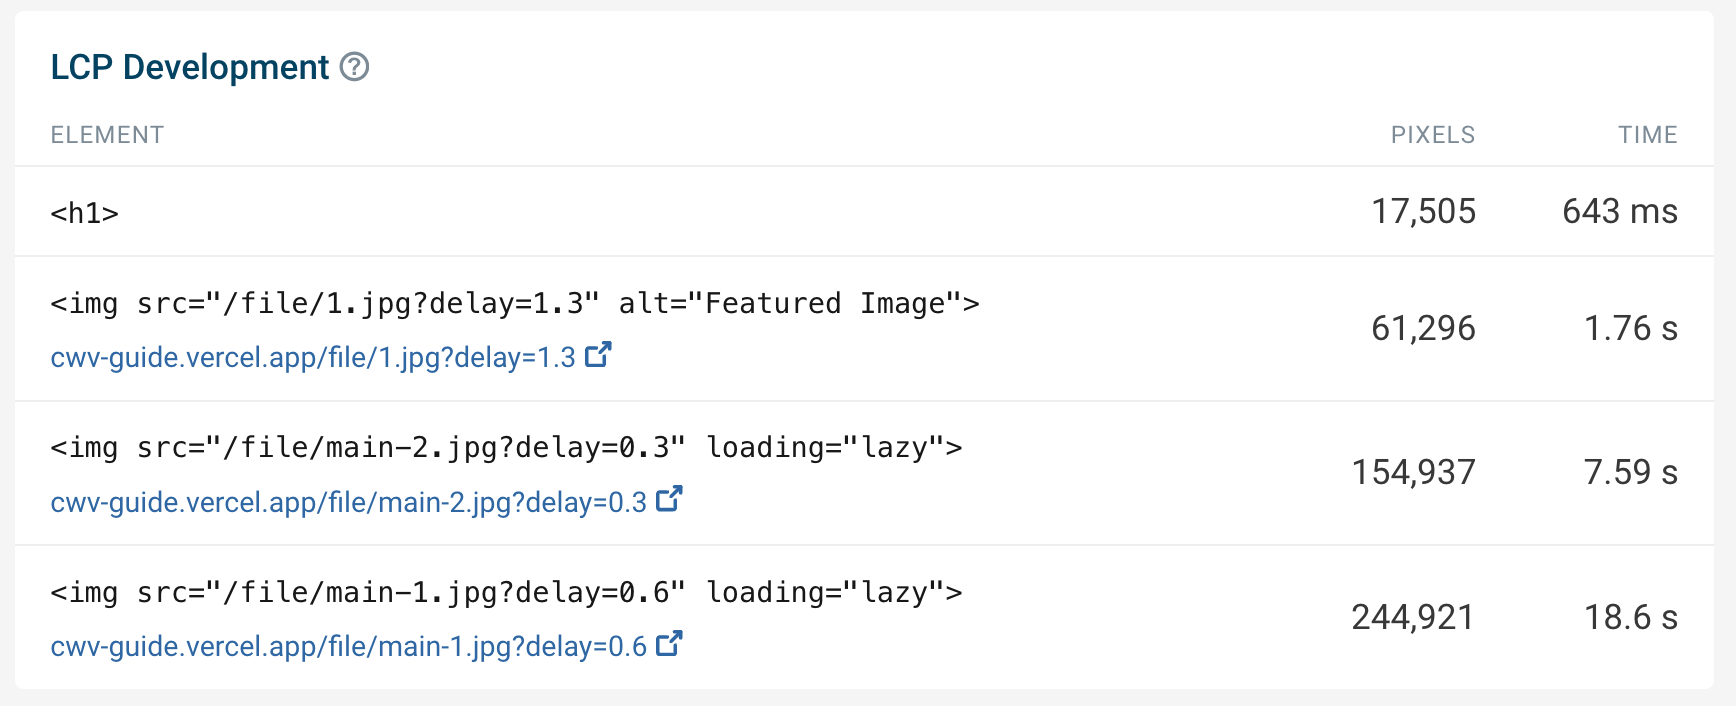
This screenshot is from DebugBear. You can view a free website speed test that includes an LCP Development section here.
The LCP Development table shows how the LCP element changed as the page rendered.
The LCP value updates every time a larger element than the previous LCP element appears on the page.
Looking at the LCP request discovery section, it's clear that the LCP image is missing some optimizations:
The LCP by phase section also shows the Resource load duration as taking over 90% of the LCP time (750ms). This suggests that the LCP image is too large and has not been optimized for performance.
Combining the LCP phases with the Network track on a Performance panel reveals that the LCP image is not being prioritized:
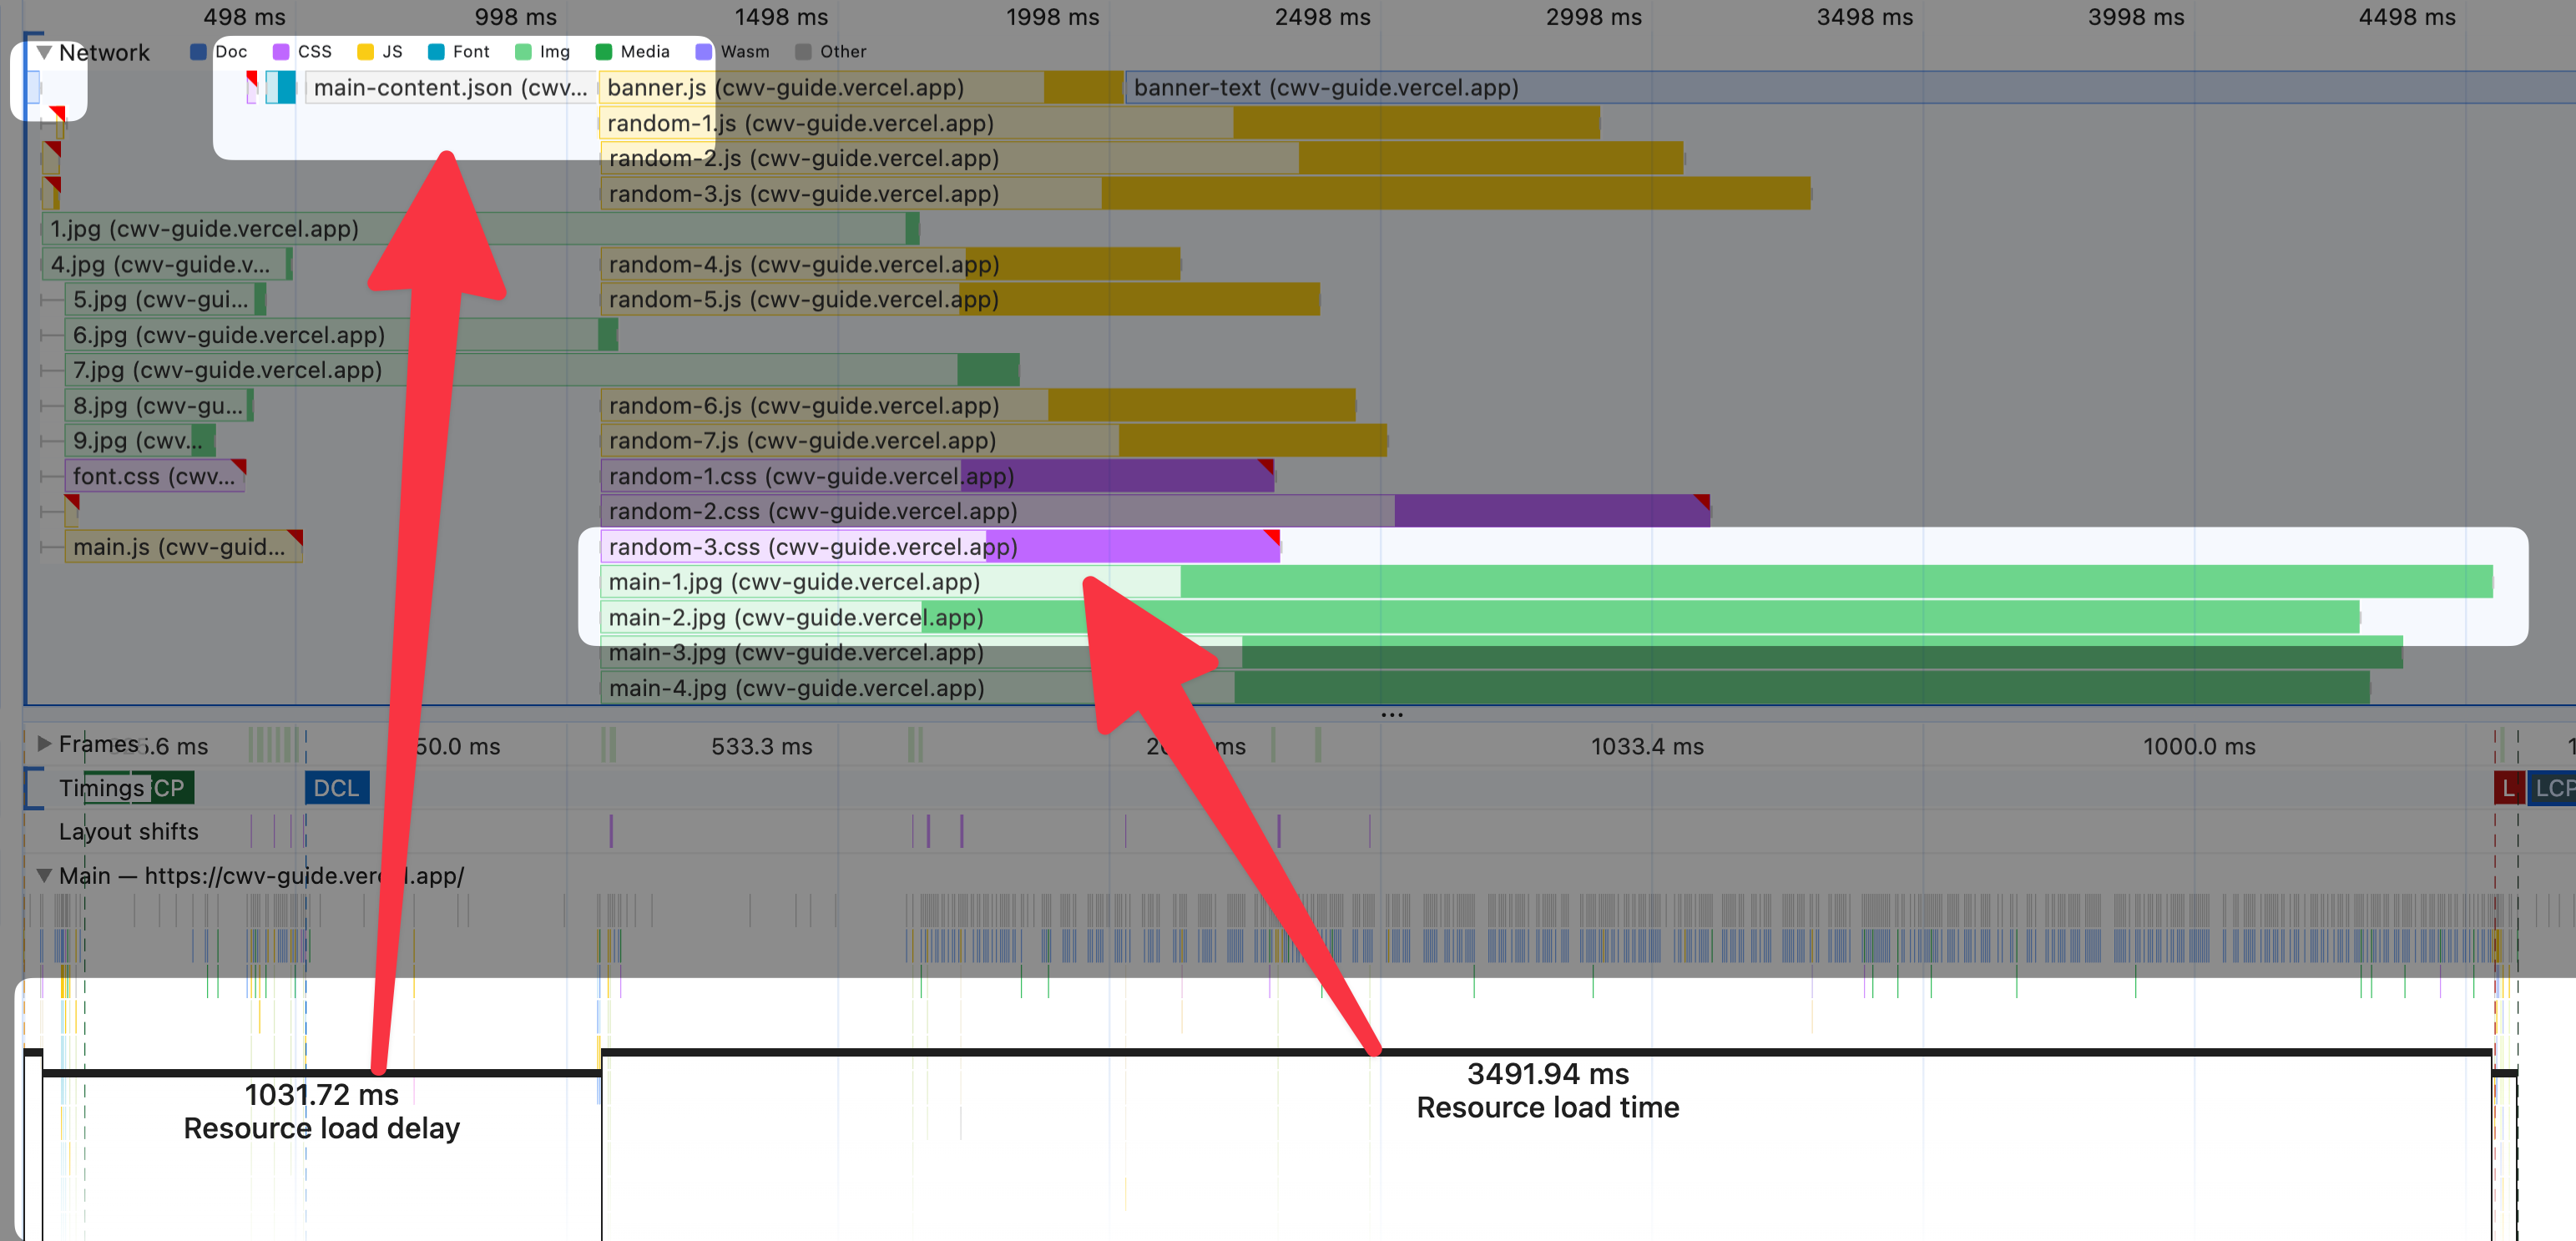
While there's a lot to process in that previous screenshot (full resolution version), there's a few key takeaways:
- The small rectangle in the top left of the screenshot represents the main HTML document. However there's a large gap between the main HTML document and the LCP image request.
- The Resource load delay appears to be attributable to a JSON file which needs to be downloaded before the LCP image can be requested.
- When the LCP image is finally requested, it takes a long time to download.
Here's a summary of the fixes applied to the LCP image:
| Fix Applied | Why |
|---|---|
| Image Format: Converted (and resized) the LCP image to AVIF format using tools like Squoosh. | The Resource Load Duration was too high, indicating that the image was too large. |
Preloading: Added <link rel="preload"> for the LCP image and its request chain. | The LCP request discovery section indicated that the LCP image was not discoverable directly from the main HTML document. |
| Avoid Lazy Loading: Removed lazy loading from the LCP image. | The LCP request discovery section indicated that the LCP image was being lazy loaded. |
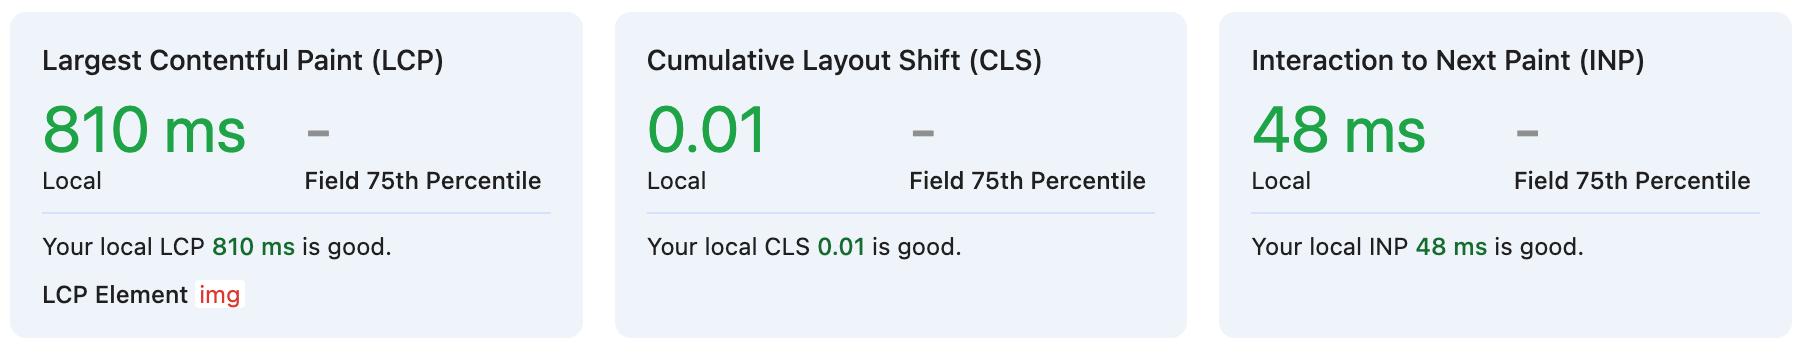
With the fixes applied, the LCP metric improved significantly:
You can try the demo page with just the LCP fixes applied here.
Fixing CLS with the new Performance Panel
As of November 2024, there are new Layout Shift debugging features being worked on, and making their way to stable Chrome DevTools. You can learn more about the new Layout Shift Culprits feature here.
As the new Performance Panel features evolve, we expect to see more detailed CLS insights and recommendations. In the meantime, you can use existing tools to diagnose and fix CLS issues. We cover this in our CLS guide.
Here's a quick summary of the fixes applied to address CLS issues:
- Image Aspect Ratio: Added aspect ratio to images to prevent layout shifts.
- Server-Side Rendering: Rendered critical content on the server to reduce layout shifts during hydration.
- Font Matching: Used a fallback font that closely matches the web font to minimize layout shifts as the fallback font transitions to the web font.
With the CLS fixes applied, the CLS metric improved significantly:
You can try the demo page with just the LCP + CLS fixes applied here.
Fixing INP with the New Performance Panel
As this is a demo page that doesn't have real-world CrUX data, it's unclear whether there is a problem with slow interactions. DebugBear's Real User Monitoring can help track this information, regardless of whether your site has CrUX data.
However, when testing locally, the general approach to take here is: keep the Performance panel open, interact with the page, and see if the INP metric worsens.
A real-world site will likely have many elements that can be interacted with. Start by picking critical components that, for example, represent a call-to-action. On the demo page, there is a call to action:

Clicking this call to action runs a color palette extraction algorithm:

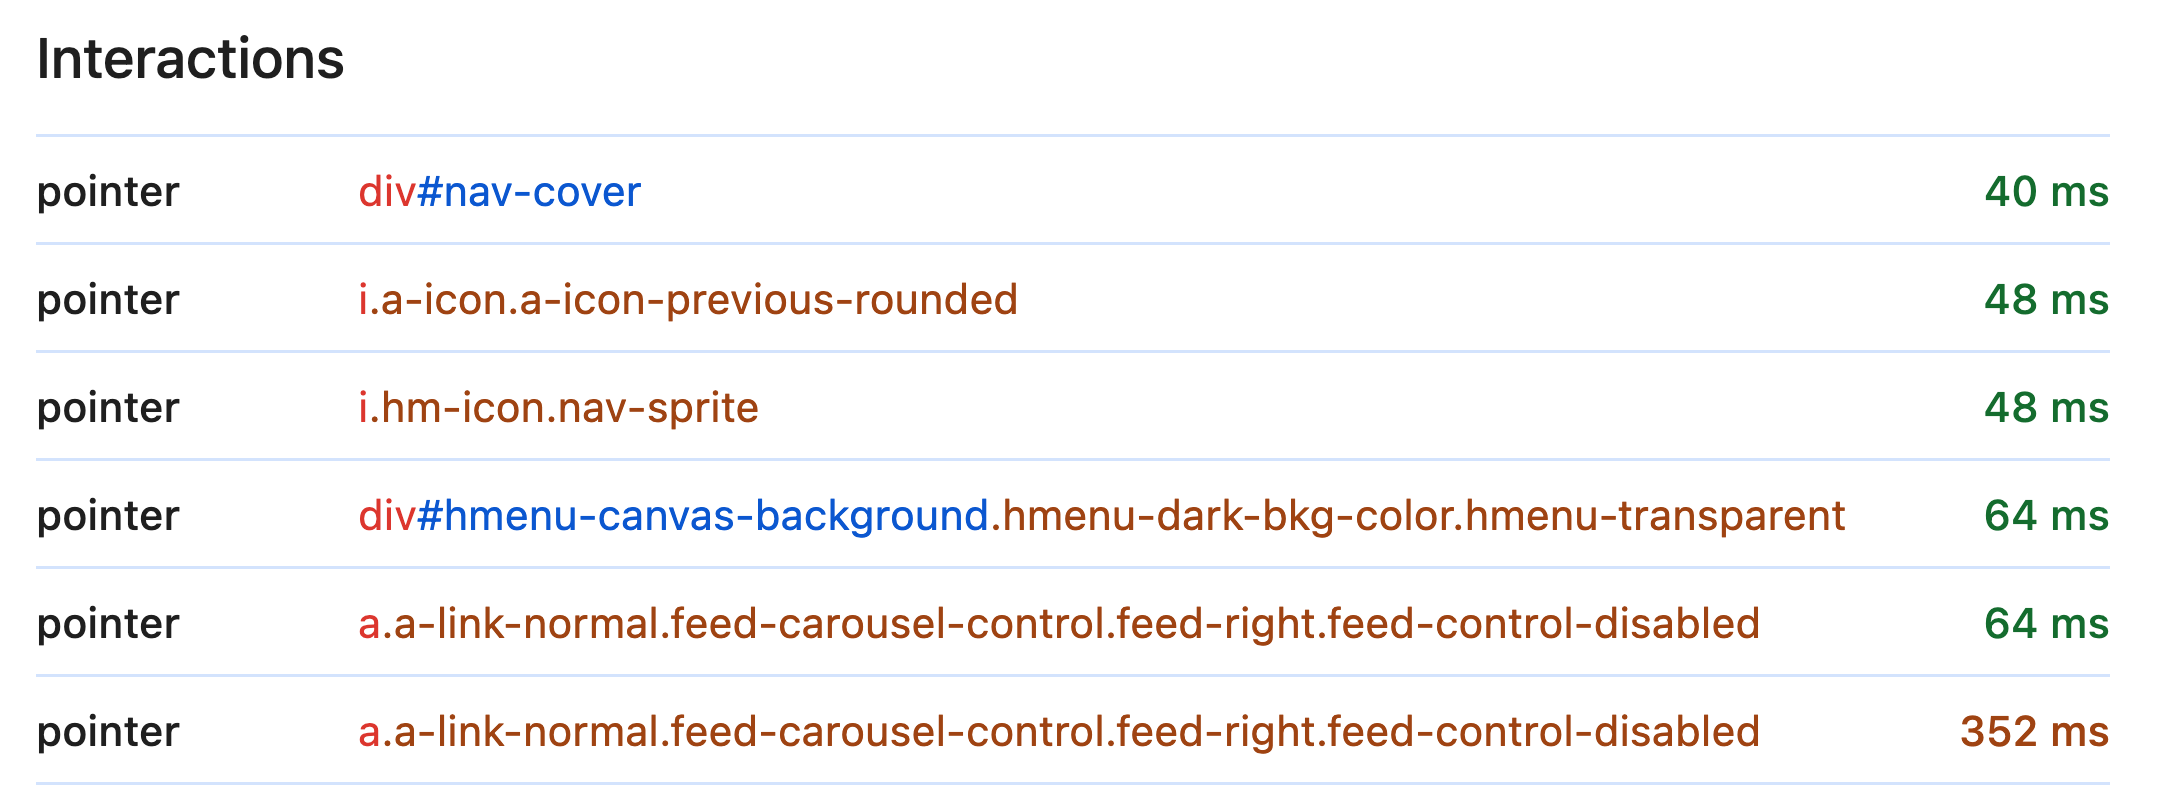
As the Performance panel is open, the INP metric updates and shows a "poor" score, along with the element that was interacted with:
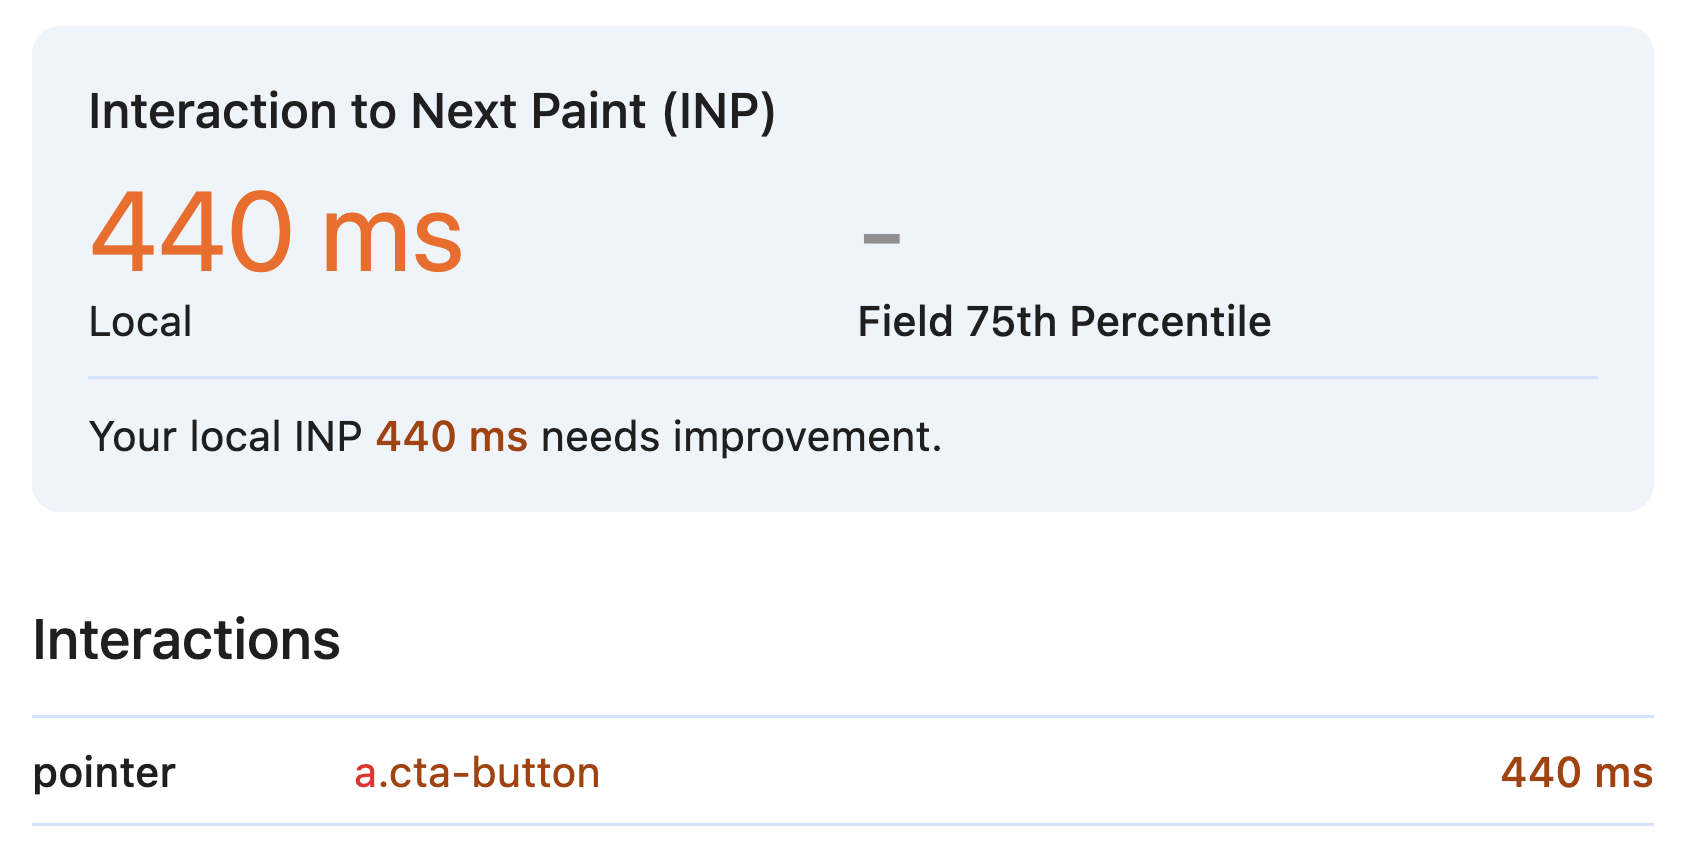
The reference to a.cta-button specifies that the element is an anchor (<a>) tag with the class cta-button.
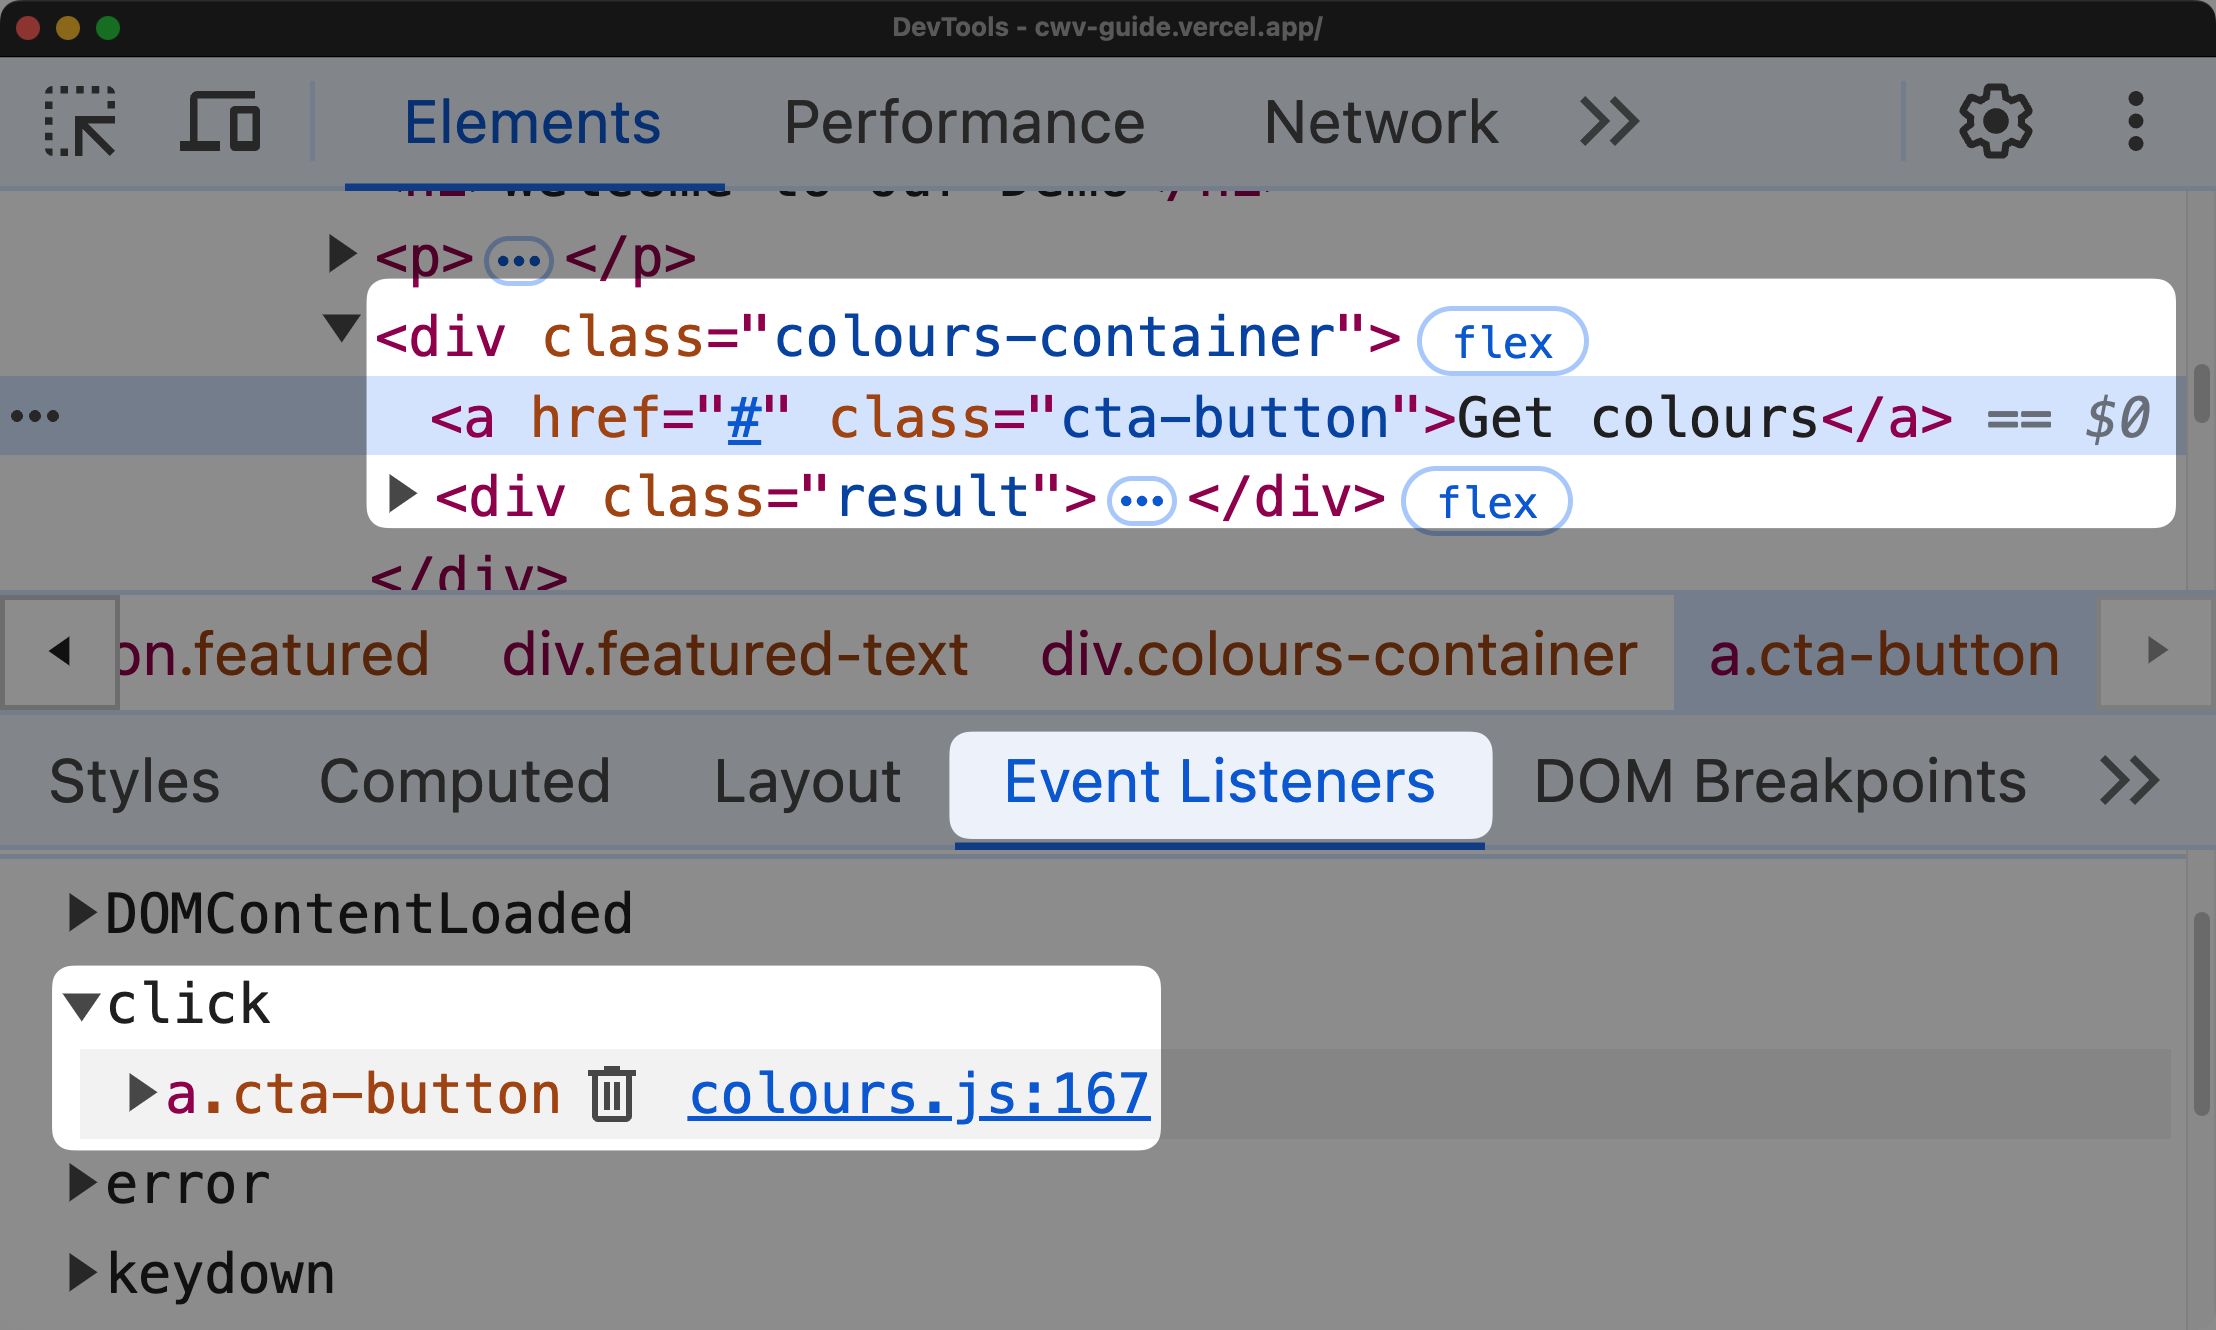
If you know what element was interacted with, how can you discover what code is causing the slow interaction?
Click on the INP element in the Performance panel to see the corresponding node in the Elements panel. From there, navigate the Event Listeners pane to see the exact JavaScript function(s) that run when the element is interacted with.
While fixes can vary, and in some cases might not even be connected to JavaScript, fixing this issue involves moving the color palette extraction algorithm to a Web Worker. This frees up the main thread to respond to user interactions, improving the INP metric.
With the INP fixes applied, the INP metric improved significantly:
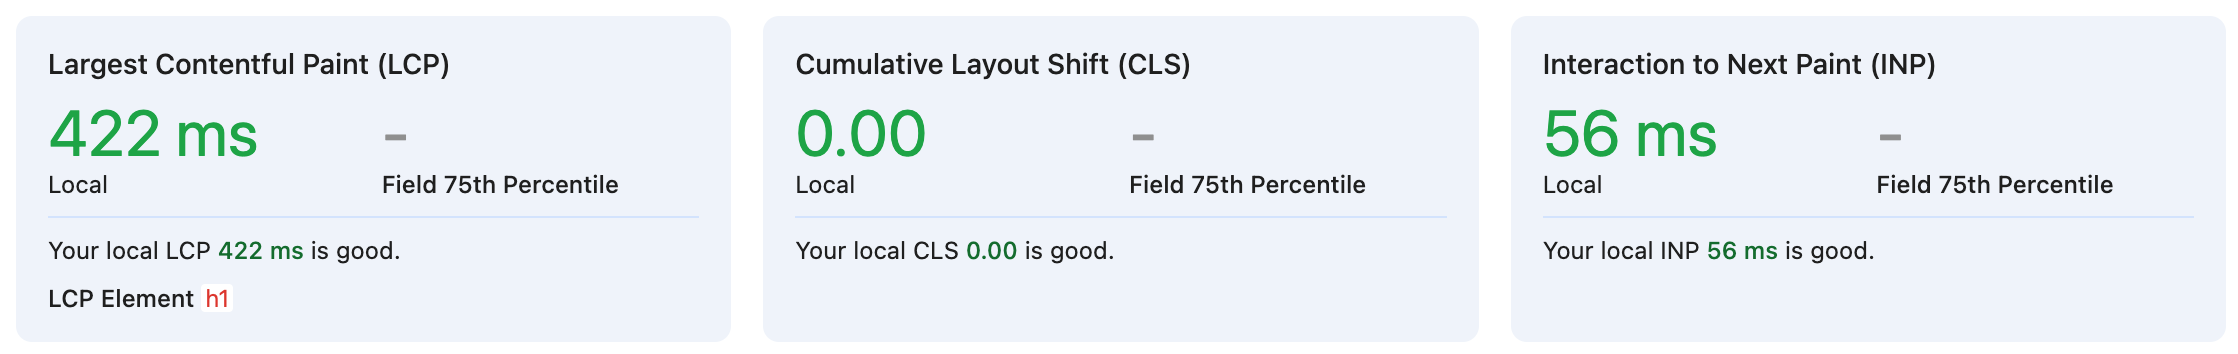
You can try the demo page with all fixes (LCP + CLS + INP) fixes applied here.
Other Features in Chrome DevTools
DevTools has a lot more to offer than just the new Performance Panel features. For example, the View Transitions API lets you create a smooth transition between page navigations in a multi-page, server-rendered application.
You can debug View Transitions with Chrome DevTools from the Animation Inspector, and even add in View Transitions with the Local Overrides feature.
Diving Deeper with DebugBear
While the new Chrome DevTools' Performance features provide valuable information, sometimes you need more detailed analytics, especially for real user data. This is where DebugBear comes in handy.
DebugBear offers multiple views of LCP load phases, also known as LCP sub-parts.
You can view this for a single page view of a real-world user:
And you can even:
- Track LCP Phases Over Time: See how changes to your site affect each phase of LCP loading.
- Compare Across Pages: Easily compare LCP phases across different pages of your site.
- Segment by User Conditions: Analyze LCP phases for different device types, connection speeds, and geographic locations.
DebugBear also offers a similar view for INP elements - including an INP Component Breakdown, and has a number of CLS debugging tools.
Running page speed tests on a schedule is useful, but DebugBear also offers Real User Monitoring to track Core Web Vitals metrics from your real users.
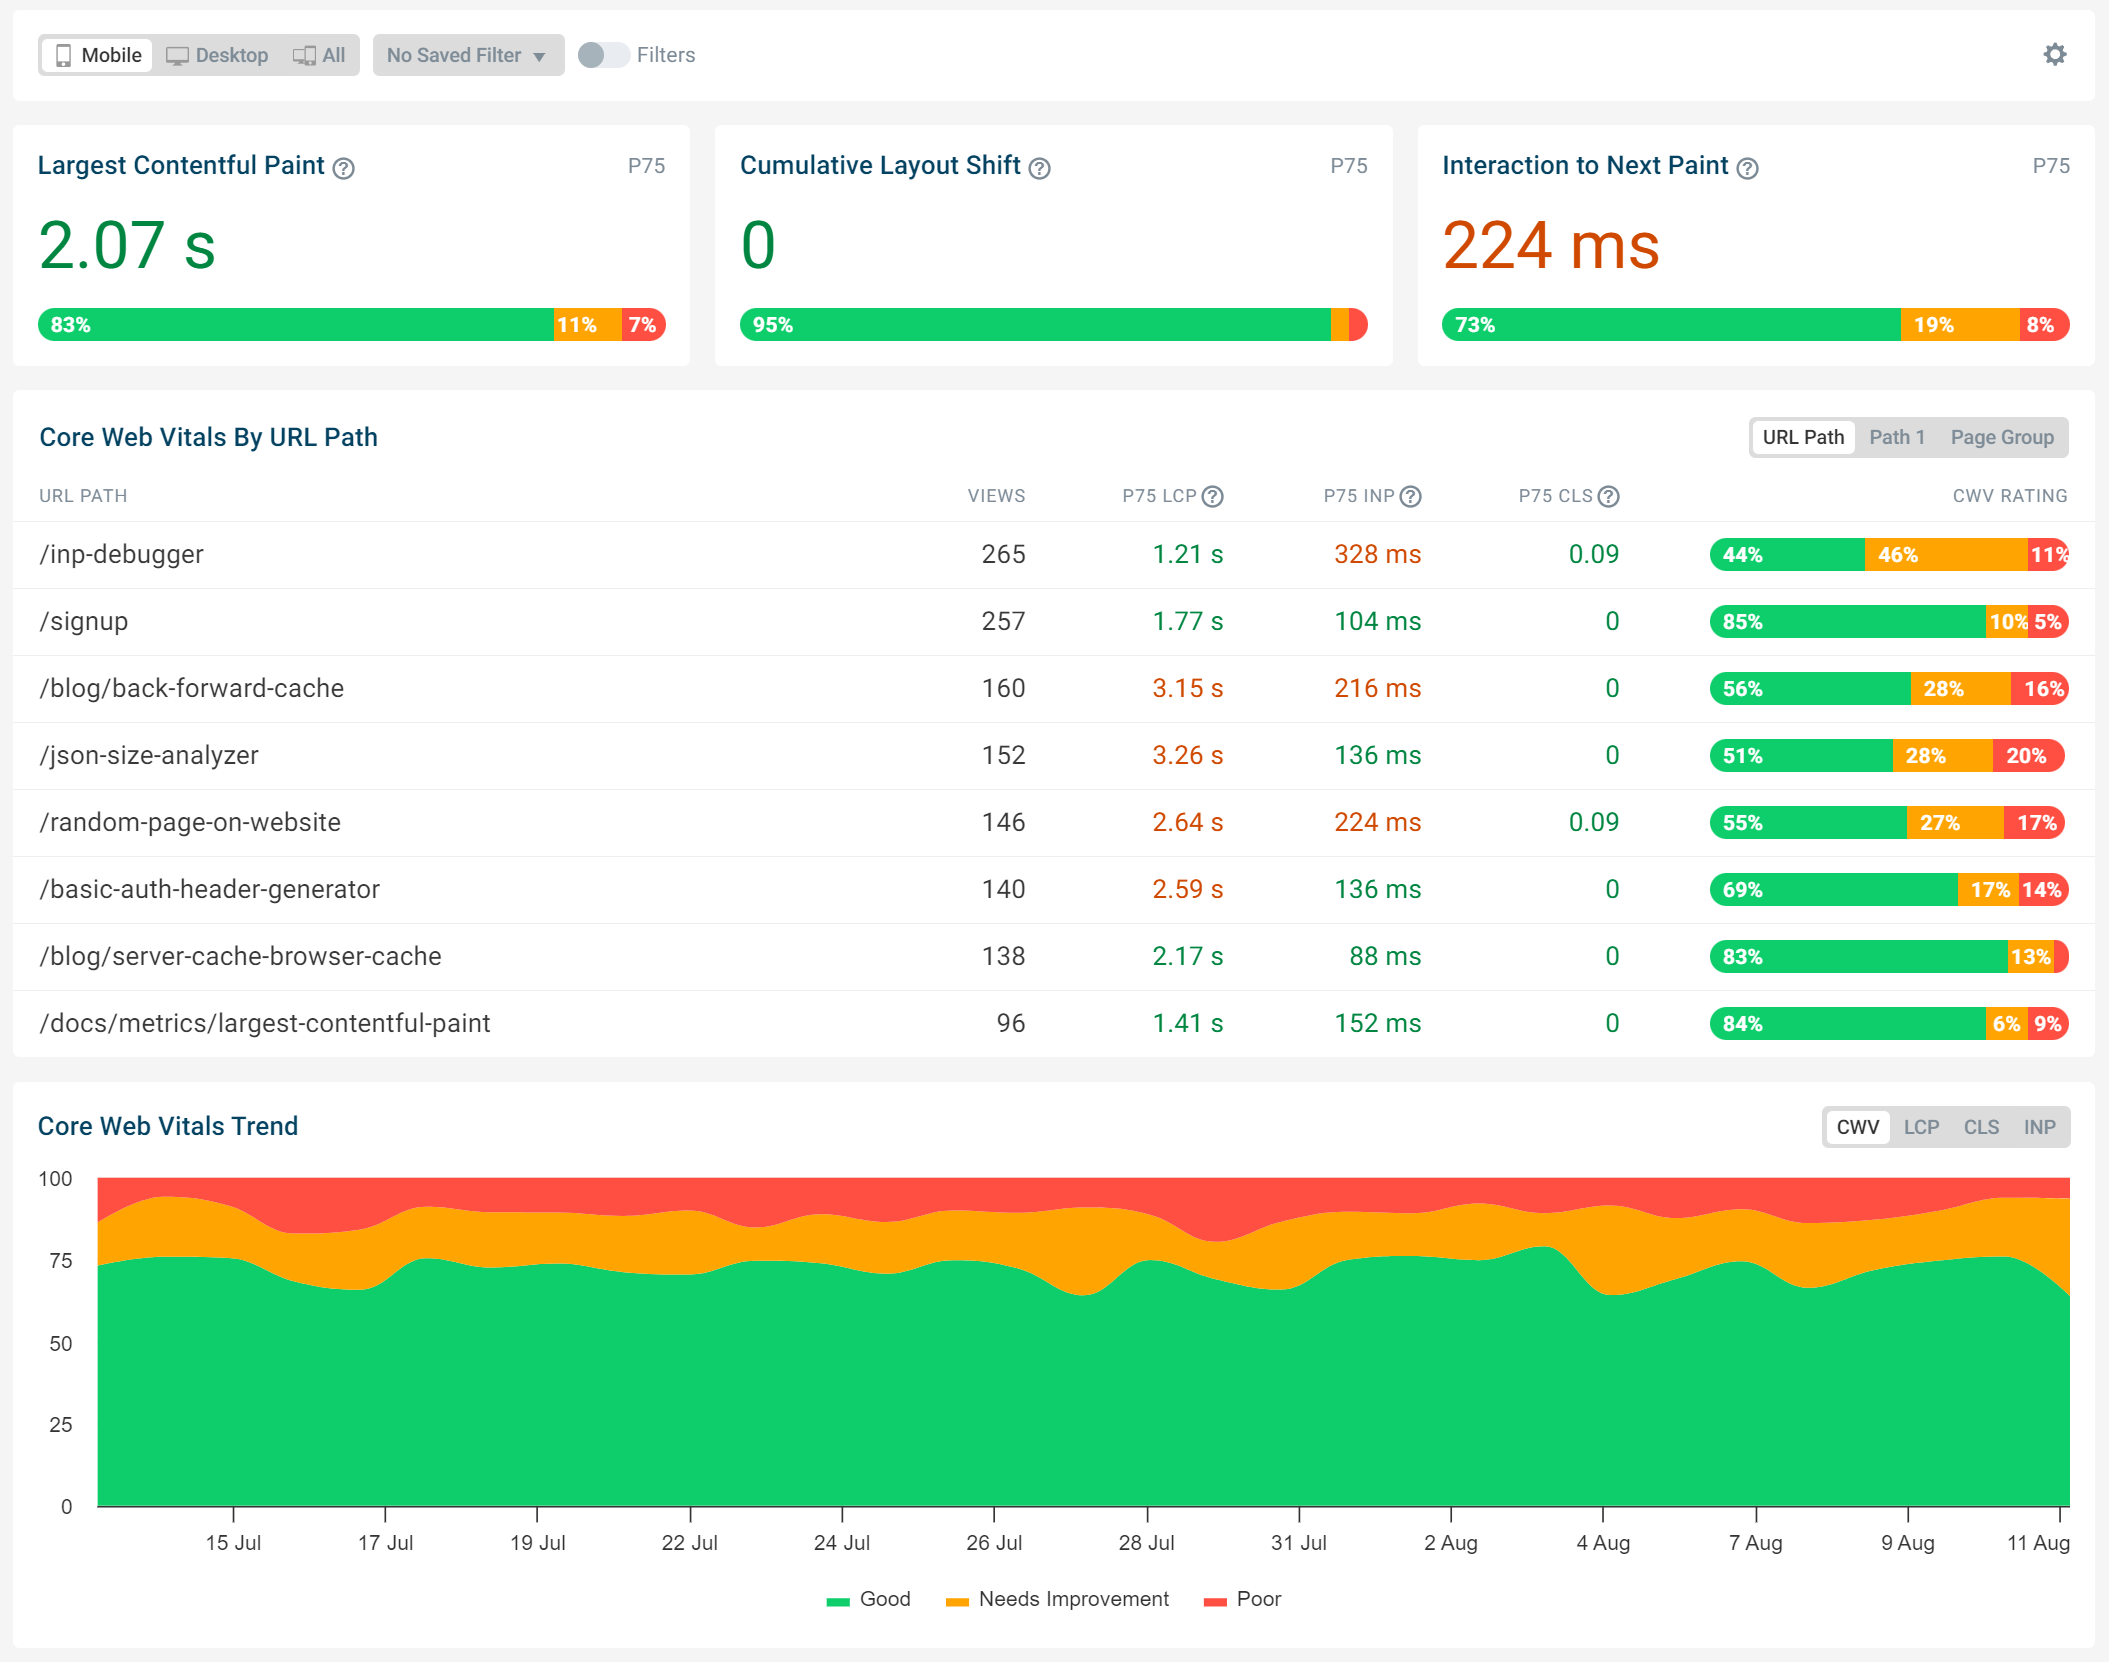
This is particularly useful for understanding how your site performs in the real world, and for tracking the impact of performance optimizations over time.
Run A Free Page Speed Test
Test Your Website:
- Automated Recommendations
- Detailed Request Waterfall
- Web Vitals Assessment