

Free Website Speed Test
Enter a website URL to test page speed and see how to make it faster.

Test And Optimize Page Speed
How fast is your website?
A slow website will reduce your organic SEO traffic from Google and lower conversion rates for people who find your site.
Free website performance analysis
Analyze page speed to see what resources your website loads, watch it load step by step, and check if third-party code is slowing you down.
Recommendations to speed up your website
Our page speed checker shows you opportunities to improve your page load time.
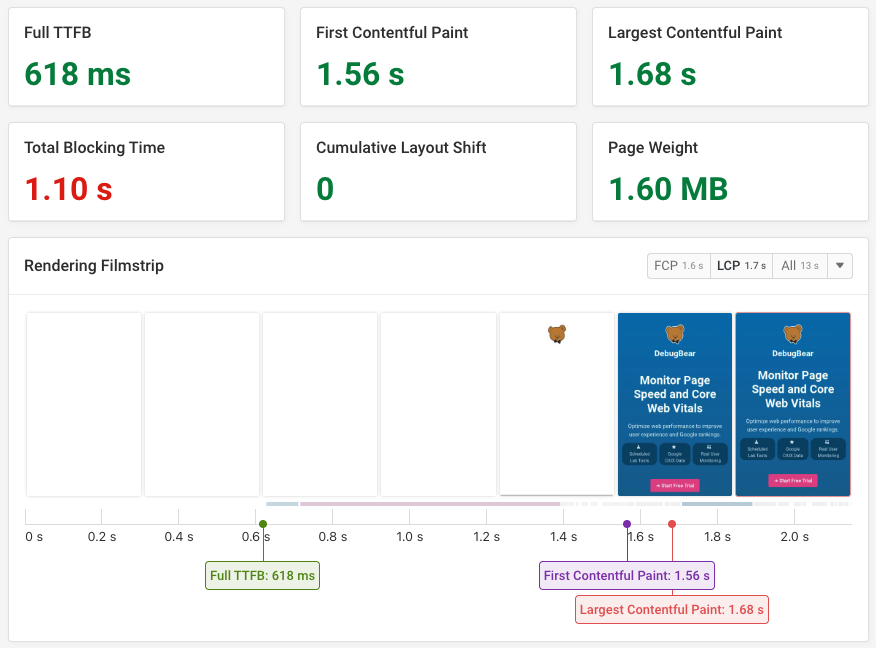
What Are Core Web Vitals?
Google uses site speed as an SEO ranking signal
To get the biggest ranking boost you need to do well on all three Core Web Vitals: Largest Contentful Paint, Interaction to Next Paint, and Cumulative Layout Shift.
Check your website performance
Our web performance test includes Google data to show you how fast your website is for real users and whether this could impact rankings.
Optimize landing page experience
Run a website performance test to see how you can improve user experience on important landing pages.
➔ Learn More About Web Vitals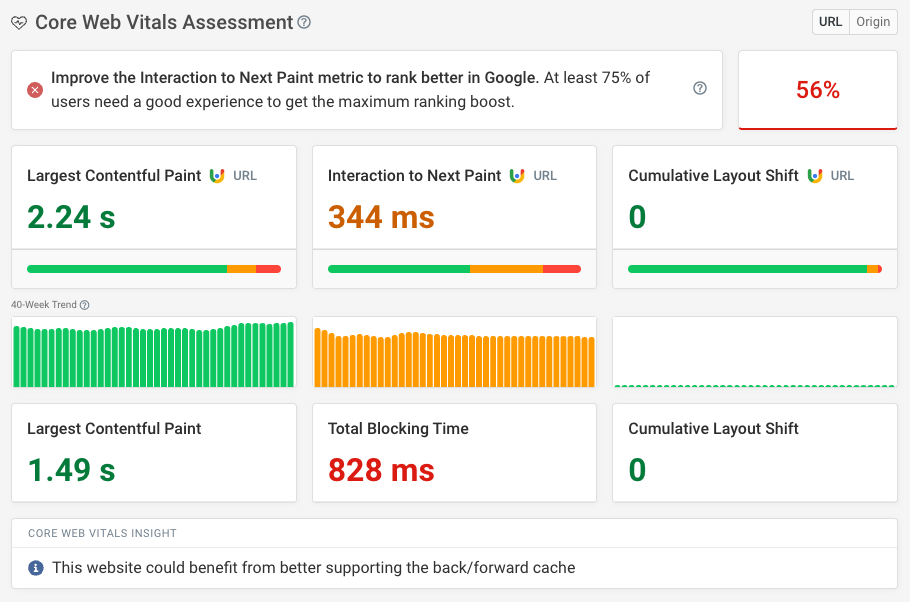
Monitor Site Speed Over Time
Website performance monitoring with DebugBear
See how your metrics change over time and compare historical test results to each other to see what changed.
Advanced lab-based tests
Test site speed from 30 global test locations using mobile and desktop devices. Set up performance budgets and test pages that require authentication.
Keep track of real user data
DebugBear real-user monitoring shows you how your visitors experience your website and points out what to improve for the biggest impact.
➔ Monitor My Website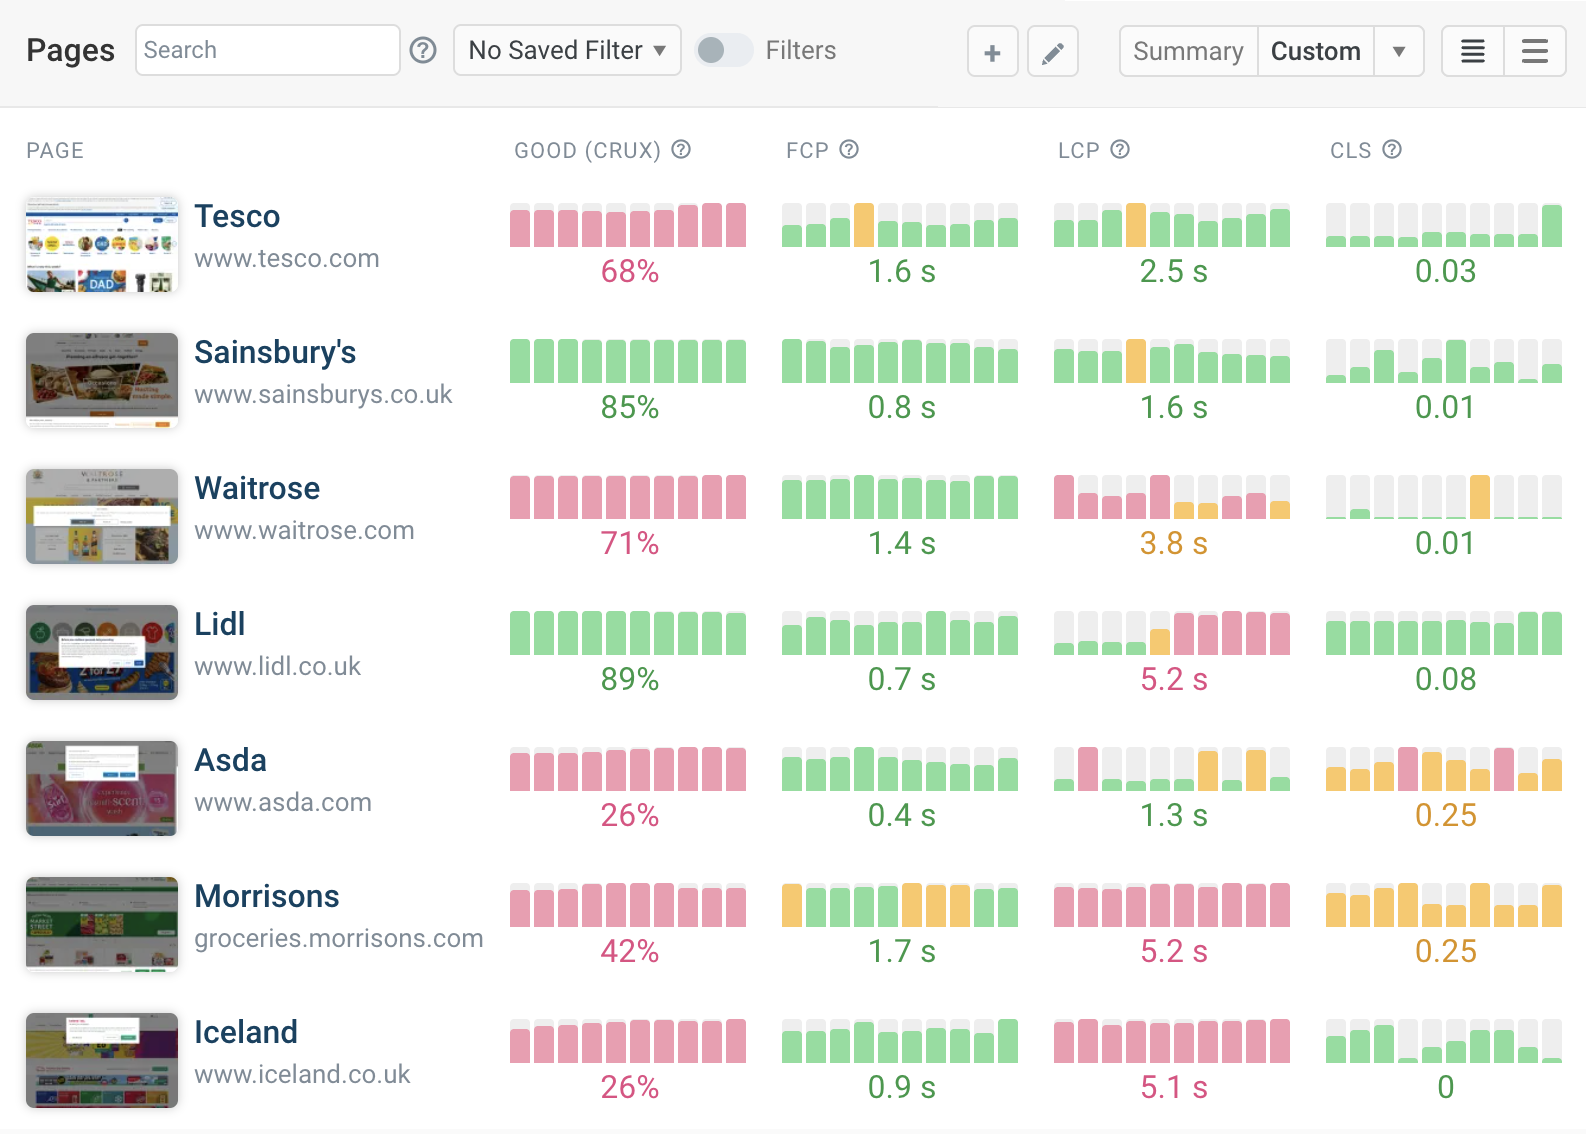
Learn About Web Performance
Learn how to read a request waterfall
Find out how to use waterfall charts to understand and optimize the speed of your website.
Learn how to optimize Largest Contentful Paint
The Largest Contentful Paint measures how long it takes for the main page content to appear. It is arguably the most important Core Web Vitals metric.
➔ Read The DebugBear Blog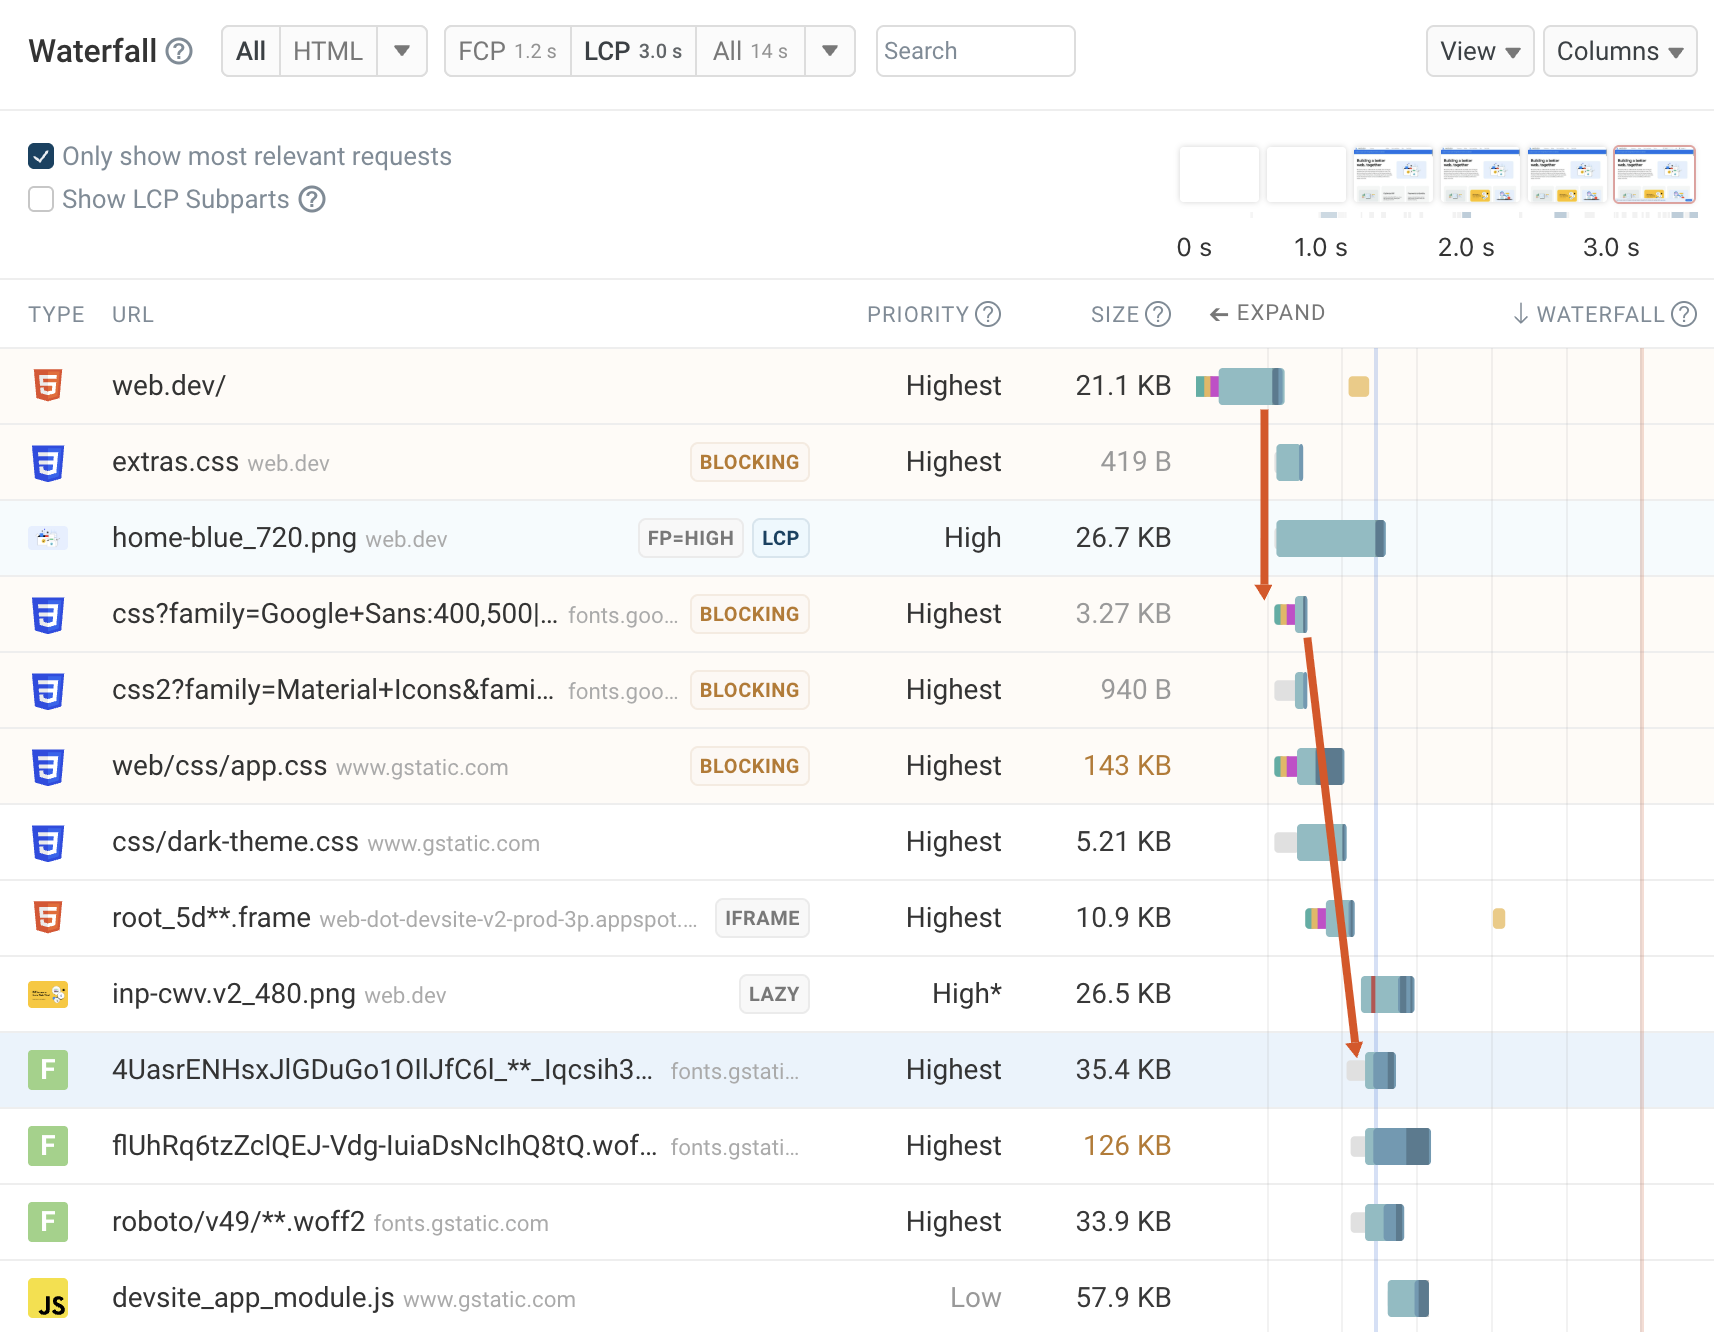
How Is The DebugBear Page Speed Test Different?
More accurate data than Page Speed Insights
PageSpeed Insights, the Google site speed test, collects lab data by simulating a slower network. However, this can lead to inaccurate metrics being reported, so DebugBear collects data on a real throttled connection.
More in-depth reporting than Pingdom
Unlike Pingdom, DebugBear provides detailed debug data you can use to optimize your site.
Real-user metrics you won't find in GTmetrix
GTmetrix is a great lab testing tool, but doesn't surface the Google metrics that actually determine how well your website ranks.
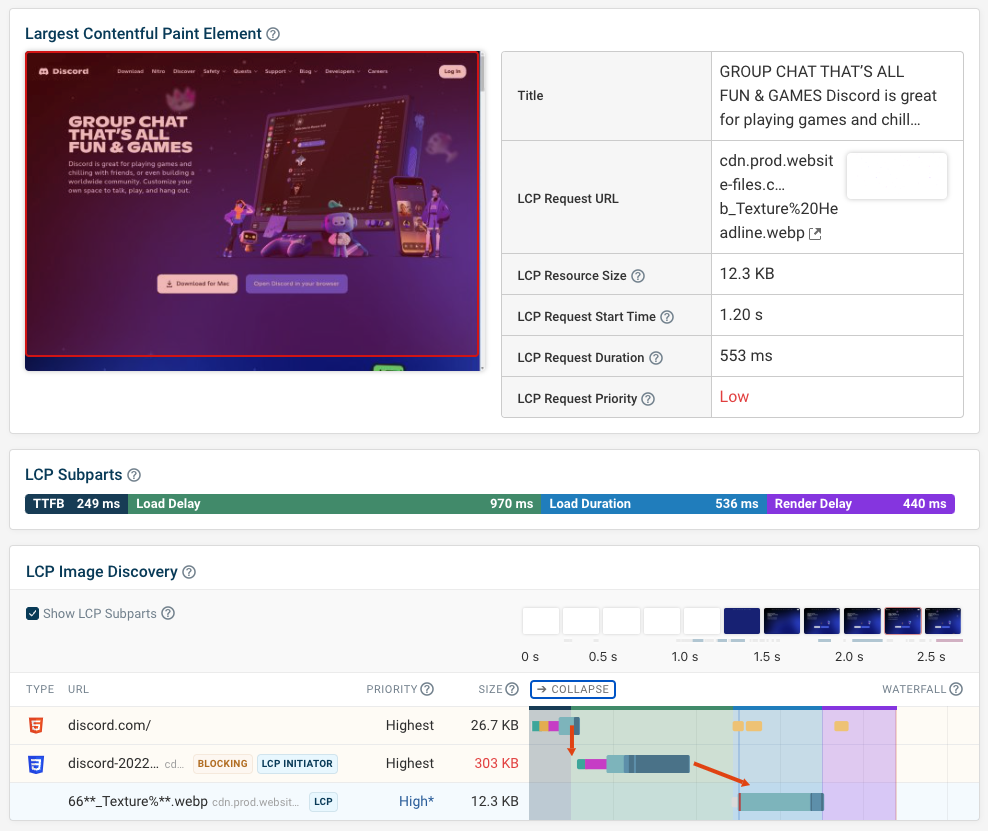
Unique Performance Reporting For Your Web Page
Break down the Largest Contentful Paint metric
Check the different LCP subparts that make up your overall Largest Contentful Paint score.
Page Load Time Analysis
Analyze your page load time to see what requests block rendering or delay an LCP image.
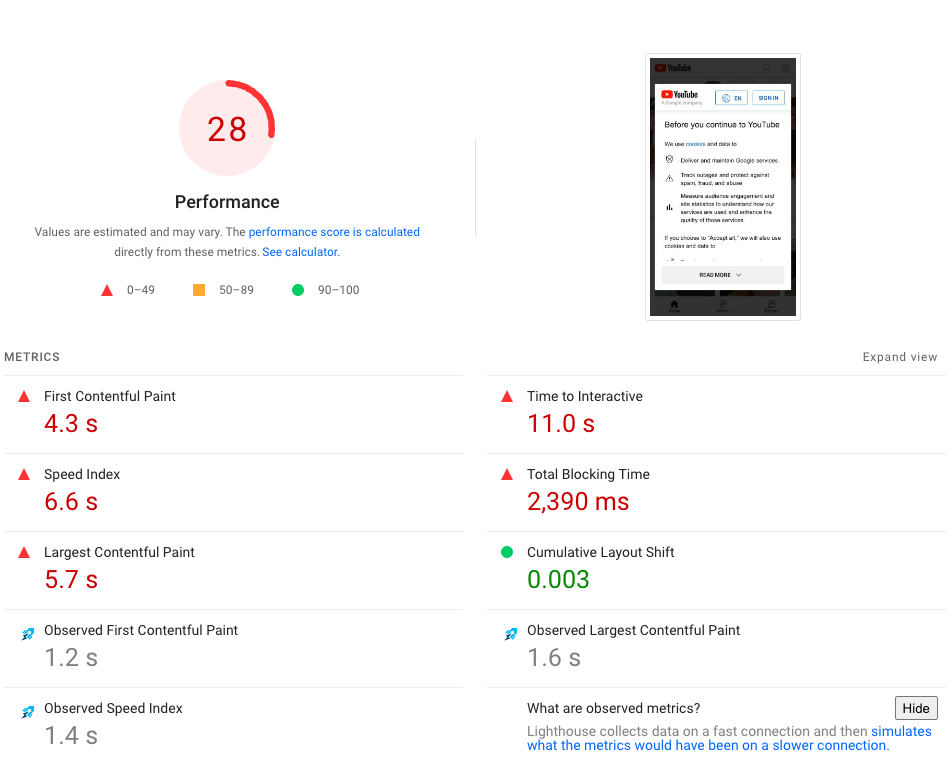
Lighthouse audits included
Every result includes a full Google Lighthouse report, with the Performance score and all audits. Our website speed test runs Lighthouse on a real throttled connection rather than simulated throttling, so the scores reflect what visitors actually get.
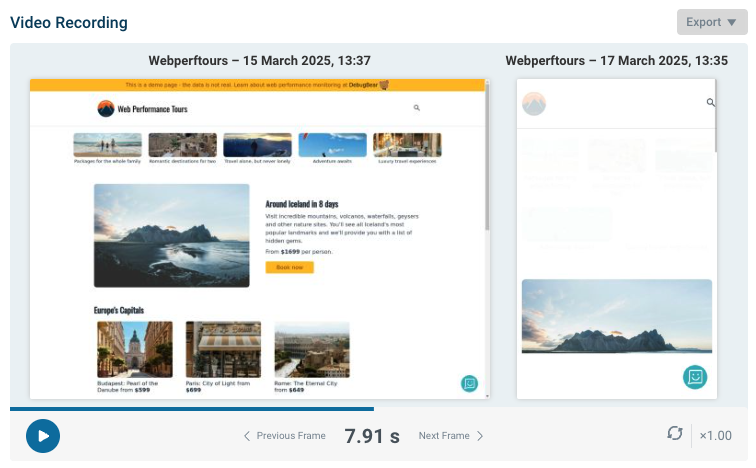
Desktop And Mobile Website Speed Test
Page load time depends on network speed
The same website will load quickly on a low-latency and high-bandwidth connection and be slow on an unreliable mobile network.
Viewport size impacts web vitals metrics
Visitors can see different parts of the page depending on their screen size. Cumulative Layout Shift is often worse on desktop than on mobile.
CPU power determines web performance
A less powerful processor will result in worse Total Blocking Time and poorer interaction responsiveness.
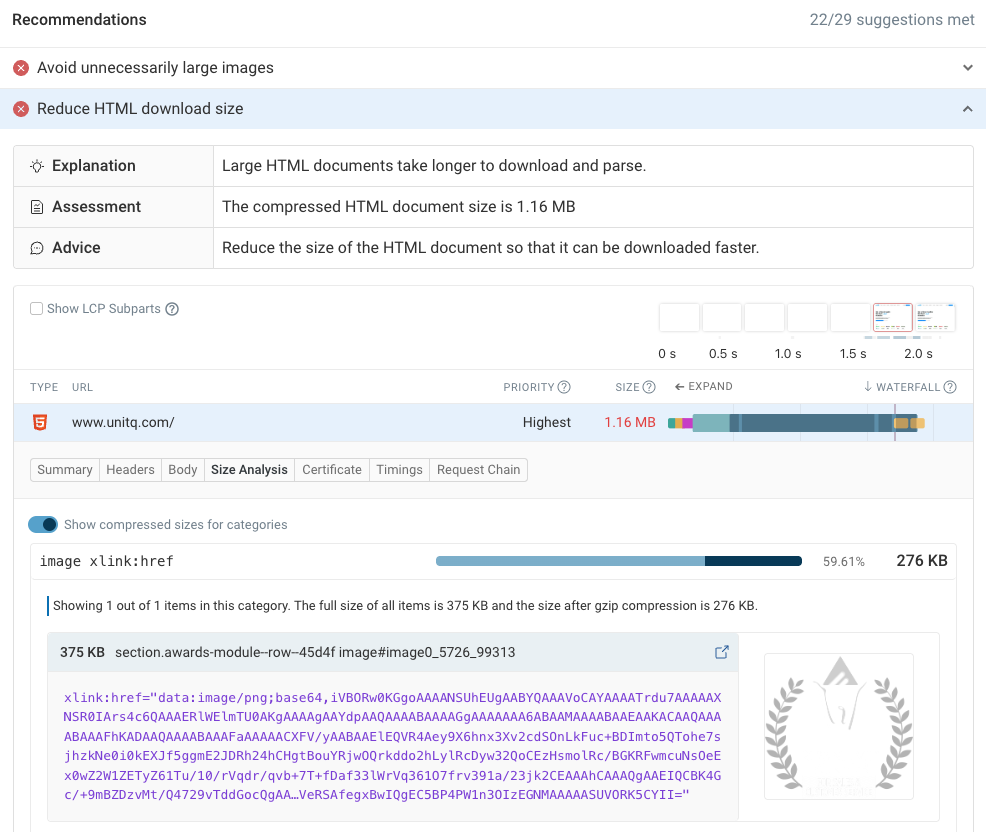
Performance Recommendations For A Faster Website
Get tips to make your website faster
Our tool detects over 25 common performance issues and provides the data you need to fix them.
Diagnose large HTML and CSS files
Large HTML and CSS downloads can lead to poor website performance. Test your website speed to see what's increasing the size of your HTML and CSS files, for example embedded images and fonts.
Load images faster
Find out what images can be optimized or how requests for different page resources can be prioritized better.
Benchmark Your Website Performance
Test Your Site And Competitor Sites
Use our free page speed test to check your website and those of your competitors.
Monitor Performance In Your Industry
Use DebugBear to continuously benchmark website performance of brands in your category.
➔ Learn More About Benchmarking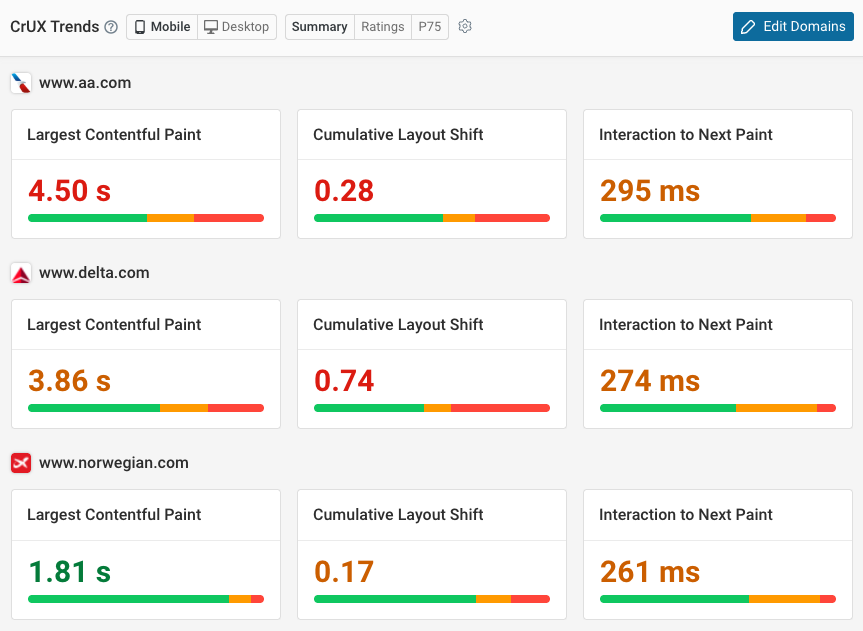
More Website Testing Tools
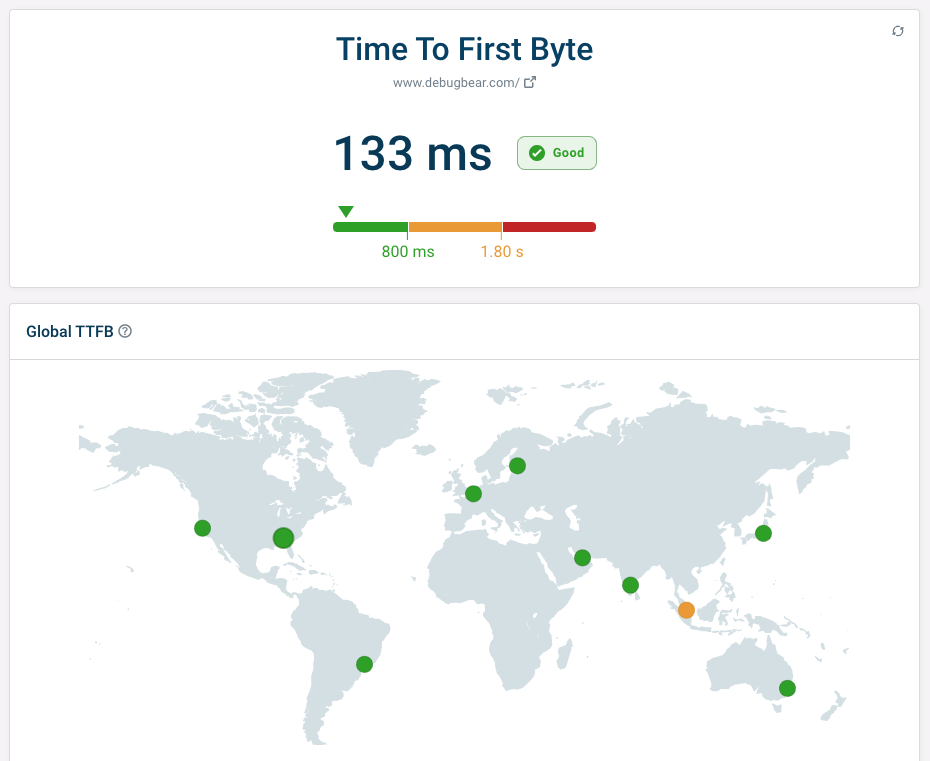
Audit Time to First Byte
Measure the Time to First Byte metric on your website from 10 different locations with our TTFB test.
Interaction to Next Paint Check
The INP Debugger interacts with page elements on your website and reports INP scores.
Test your site without JavaScript
View how your website loads with and without JS using the NoScript Test
Check website SEO
Our website SEO tester analyzes your page for common SEO issues and provides tips to improve your search engine rankings.




You are using an old browser that is not supported anymore. You can continue using the site, but some things might not work as expected.