How To Benchmark Website Performance Against Competitors
A fast website provides a good user experience and can help your business win against your competitors. Benchmarking performance lets you see where you stand and whether you're improving.
In this article, we'll look at why website benchmarking is important and how to do it.
Why benchmark website performance?
Web performance matters for your business because Google uses it as a ranking factor and faster websites result in better conversion rates.
Google uses the Core Web Vitals to assess your page speed:
- Largest Contentful Paint measures how fast your website loads
- Cumulative Layout Shift measures whether page content shifts around unexpectedly
- Interaction to Next Paint measures how quickly your website responds to user interactions
Doing well on the Core Web Vitals metrics can help you outrank your competitors.
Benchmark Core Web Vitals against your competitors
The data Google uses for rankings comes from the Chrome User Experience Report (CrUX). Google collects real user website performance data and makes it publicly available for any website with enough traffic.
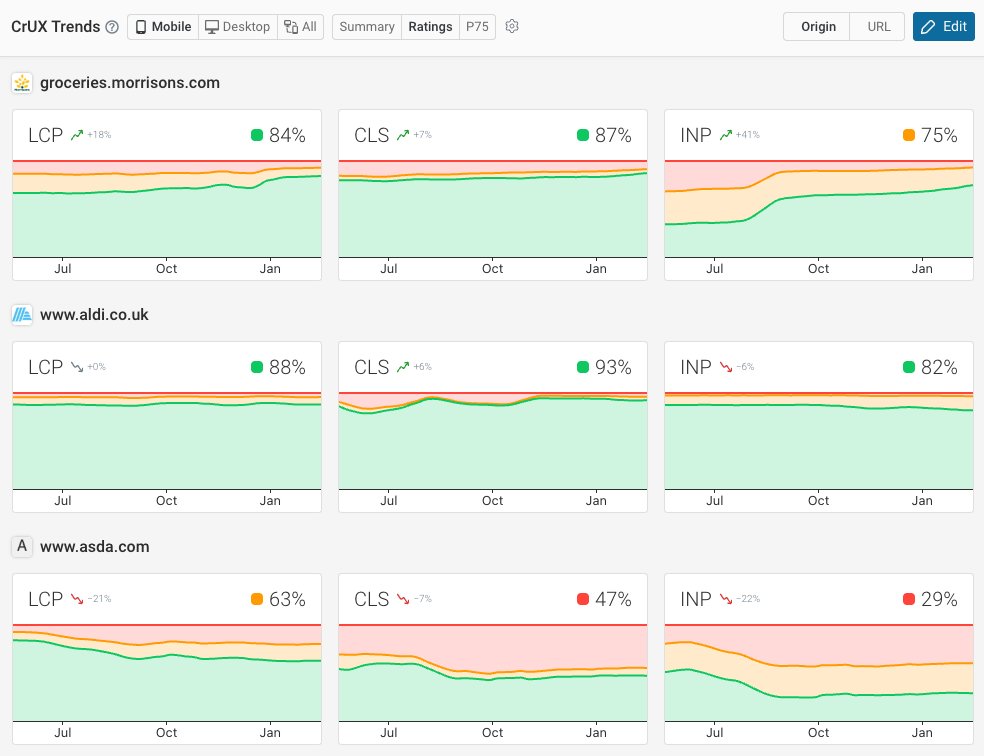
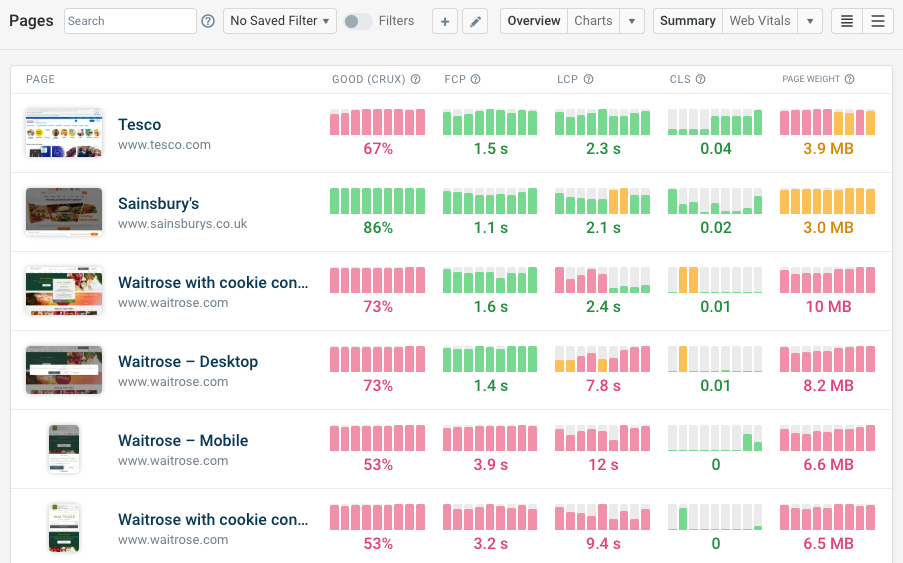
You can view this data on DebugBear using the CrUX Trends Dashboard. Add your competitors to track how you perform in comparison and see whether your site is getting faster or slower over time.
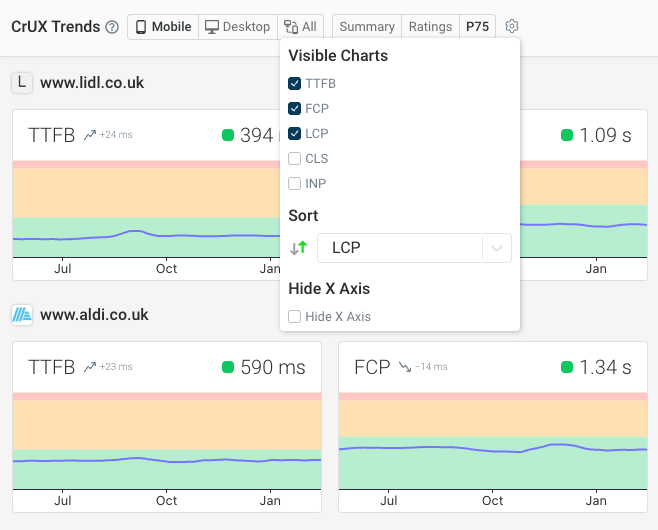
Click on the gear icon to select what metrics are displayed. For example, you can add Time to First Byte and First Contentful Paint to better understand the page load process.
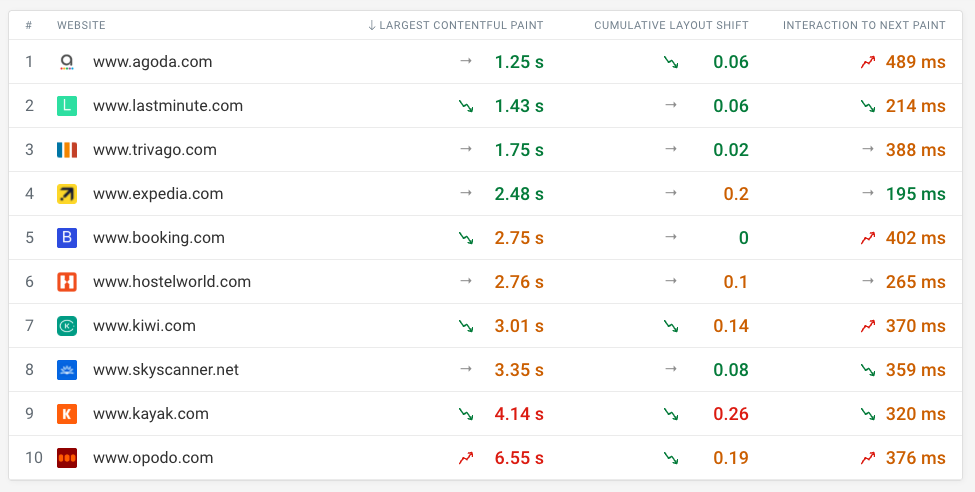
You can also sort the data to find the fastest brands in your industry.
Different visitors have different experiences when visiting the same website. By default the dashboard shows the 75th percentile value. If the p75 is 1.46 seconds then 25% of visitors wait longer than that and 75% wait less.
Alternatively, you can look at the rating breakdown of visitor experiences. Google assigns each page view a rating that's either "Good", "Needs Improvement", or "Poor". The number on the dashboard shows you the percentage of good experiences for that domain.
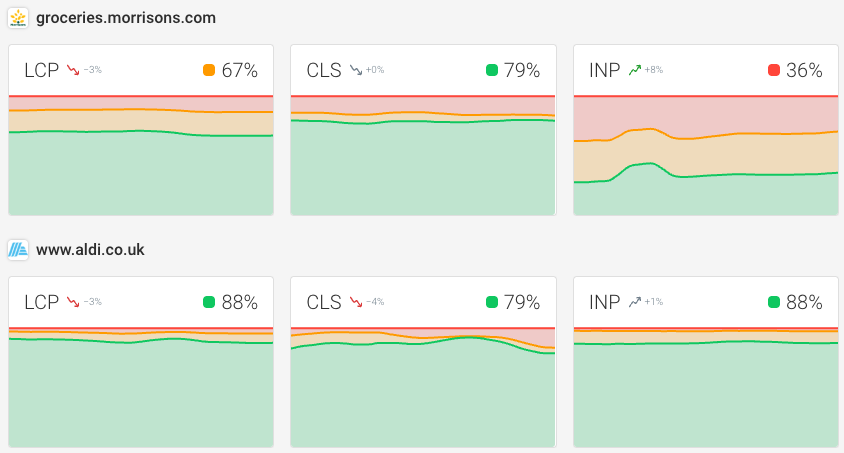
Make sure to check the website benchmark for both mobile and desktop devices!
Monitor competitor websites
You can also monitor your competitor websites by running scheduled synthetic tests. Synthetic tests are run by automatically opening a website in a browser. You don't need to install anything on the website, so any publicly available website can be monitored this way.
You can use this to benchmark your homepage as well as specific pages. For example, for an e-commerce site you might want to look at category pages, product pages, and product listing pages.
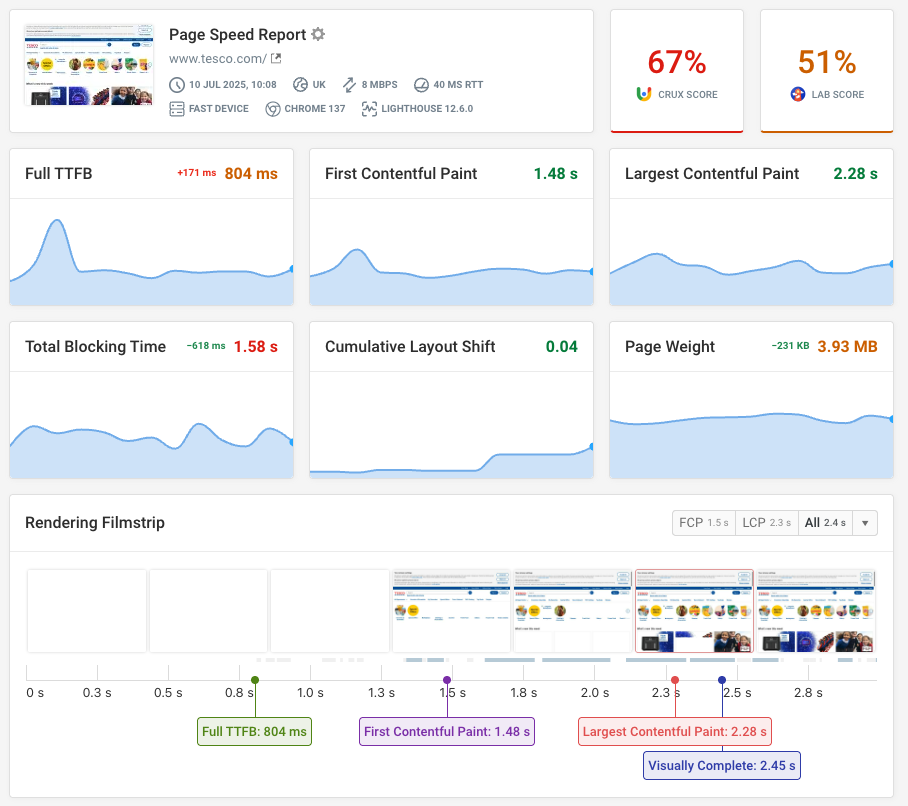
Click on each monitored page to see a detailed report, including recommendations to optimize website performance.
The CrUX score is what matters for SEO, but the Lab Score can give you a quick indication of how your website is doing.
CrUX data is normally aggregated over a 28-day period, while synthetic tests give an instant result.
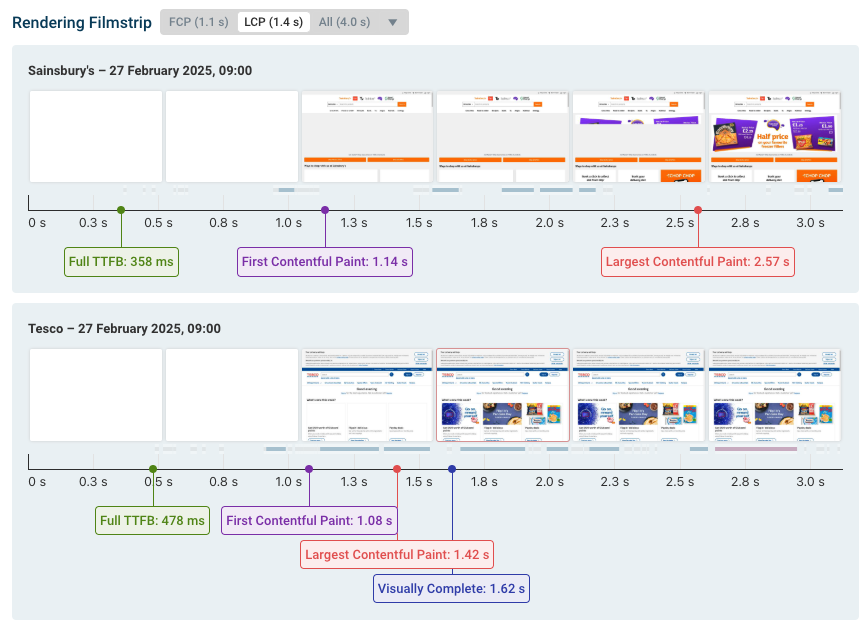
You can also compare two test results to see your website and your competitor's side by side, either as a filmstrip or exported as an MP4 video.
Benchmark Lighthouse scores for Accessibility and SEO
Google's Lighthouse tool is integrated into many website performance tools, including PageSpeed Insights.
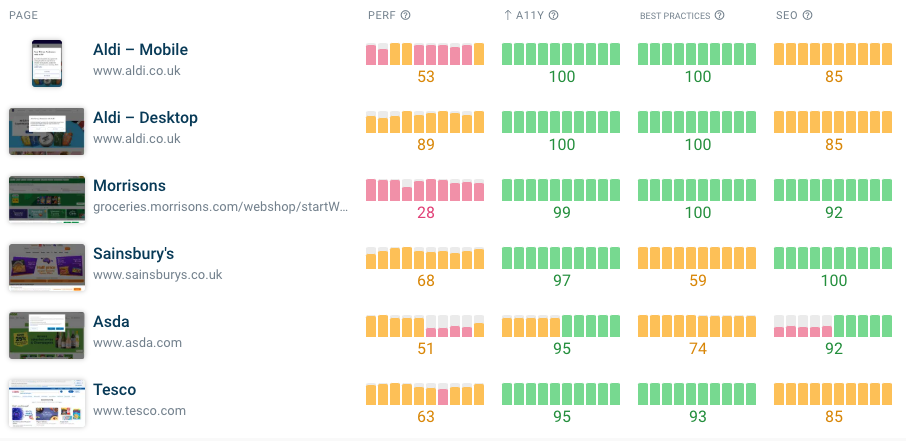
In addition to assessing performance, you also get scores for Accessibility, Best Practices, and SEO.
With DebugBear you can view these scores for your own website as well as competitor pages. Click the metric title at the top of the dashboard to sort by that metric and see what brand in your industry does best or worst.
Check global performance
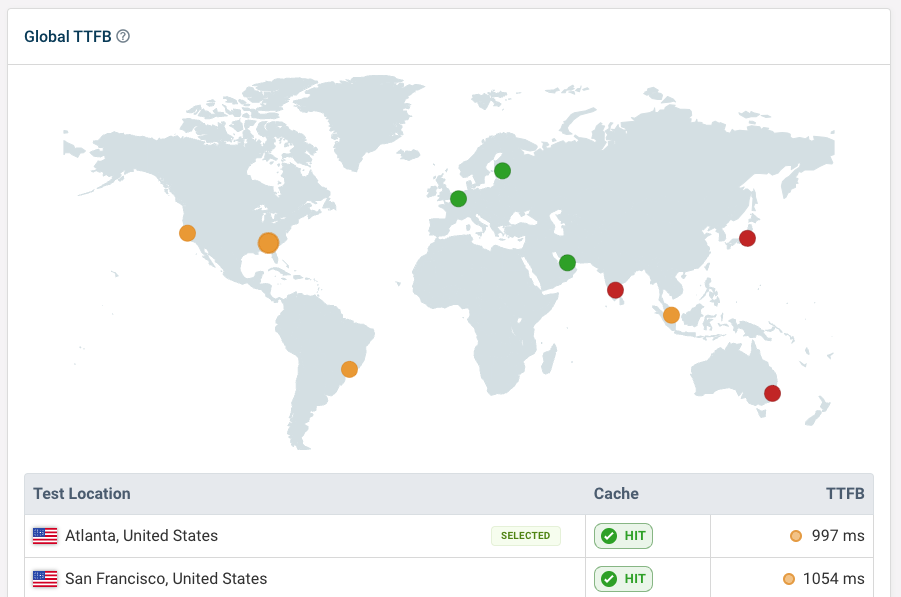
DebugBear synthetic monitoring lets you pick from over 30 test locations. We also offer a free tool to quickly test your Time to First Byte metric from 10 global test locations.
Simply enter your website URL or that of your competitor to measure how quickly the server responds with the HTML document.
Get the data you need to be faster than your competition
Website benchmarking can tell you how your site is doing and whether you need to optimize it to be the best in your industry. A comprehensive monitoring tool like DebugBear can provide insight into what changes you need to make on your website to achieve that.
In addition to CrUX and lab data, DebugBear also supports real user monitoring. This tells you how fast your website is in real time, without the usual 28-day data delay that comes with Google's CrUX data. You also get in-depth data on how to optimize the Interaction to Next Paint metric.
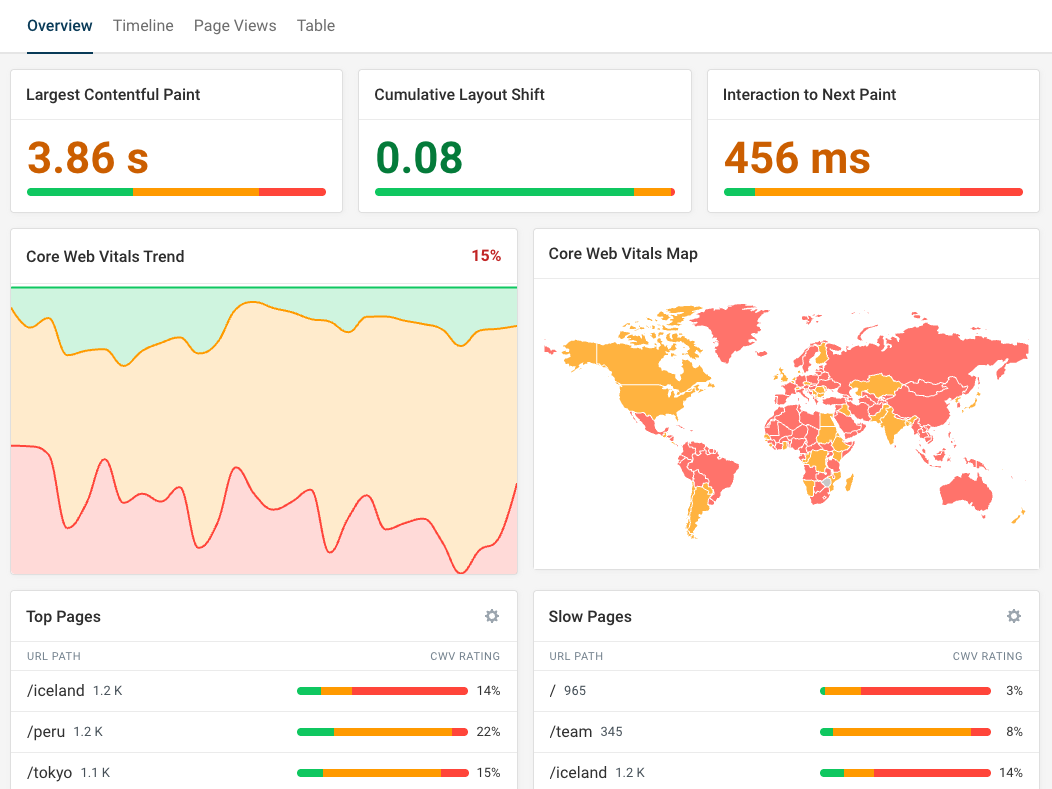
Real user monitoring allows you to better understand how performance varies between visitors, for example due to differences in device size, network speed, or device CPU speed.
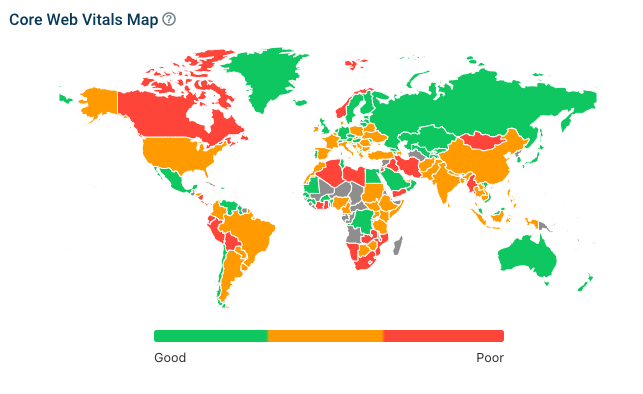
Visitors from different locations will also experience your website differently, and you may pass the Core Web Vitals in some countries but not others.
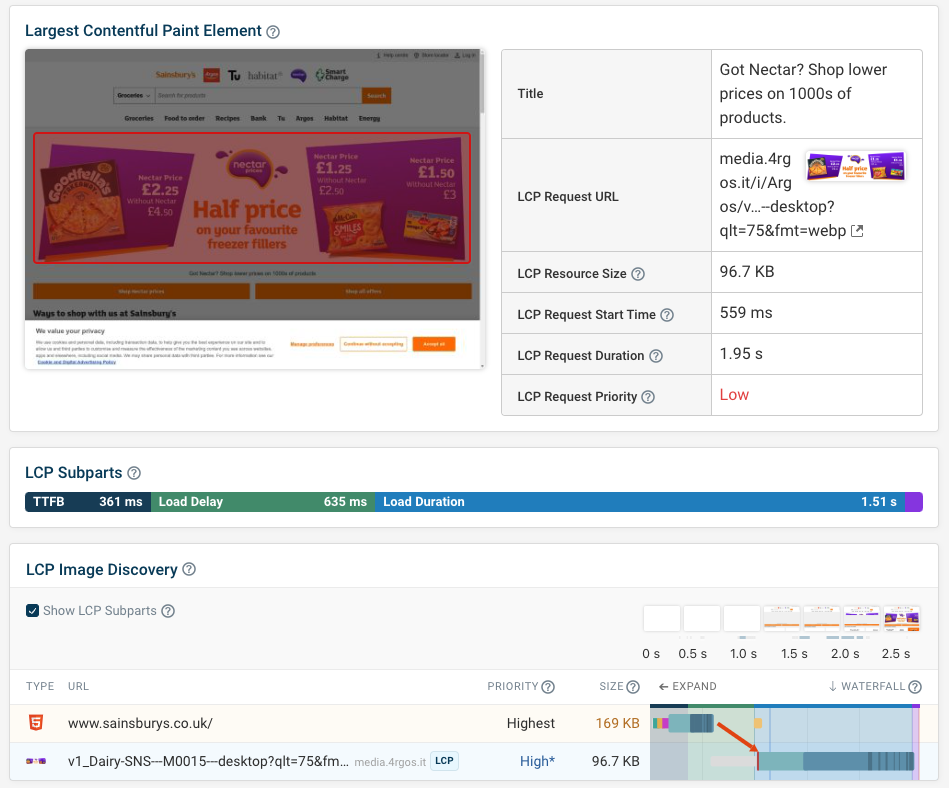
Each synthetic test result includes detailed data about your metrics, for example how the Largest Contentful Paint image was loaded.
Request waterfalls can tell you when different resources load on your website, how that correlates with what's visible to the user, and how different network requests are related to each other.
You also get custom recommendations for your website and can use experiments to try them out without deploying code to your website.


Monitor Page Speed & Core Web Vitals
DebugBear monitoring includes:
- In-depth Page Speed Reports
- Automated Recommendations
- Real User Analytics Data