The way we measure and optimize website speed is always changing. New web standards are introduced (and eventually widely supported), new tools are developed, and new metrics suggested.
This article takes a look at some of the ways that the web performance landscape changed in 2022.
Priority Hints
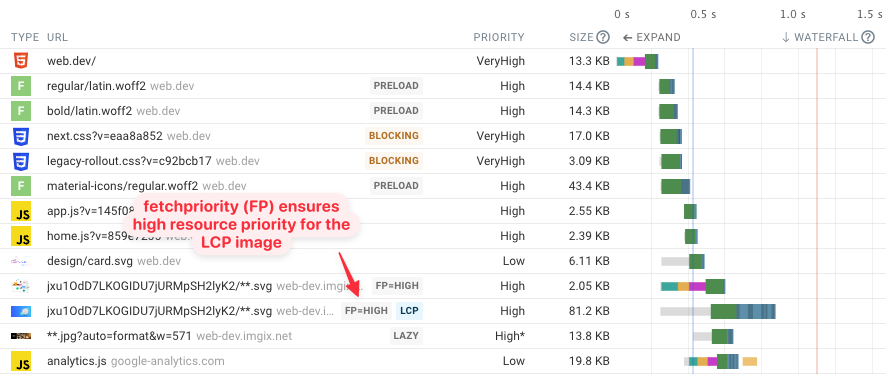
Priority Hints are the highest-impact browser feature I’ve seen this year, providing quick wins when optimizing the Largest Contentful Paint. Simply add the fetchpriority="high" attribute to your most important image:
<img src="/hero.png" fetchpriority="high" />
This will tell the browser to make this request before loading lower-priority resources.
By default image requests are low priority, and after rendering the page the priority of above-the-fold images is increased. Adding fetchpriority=high means that the browser can start the image request right away.
No more OSCP requests in Chrome
The Online Certificate Status Protocol (OCSP) lets browsers check whether a given SSL certificate has been revoked. If a site was using an Extended Validation certificate, Chrome was making these checks when establishing a connection.
The request waterfall below shows an example of an OCSP request (gray) made as part of the SSL connection (purple). Basically a second request is made as part of the HTML document request.

Chrome stopped making OSCP requests in Chrome 106. For sites that use an Extended Validation certificate this delivered a significant performance improvement.

Interaction to Next Paint Metric
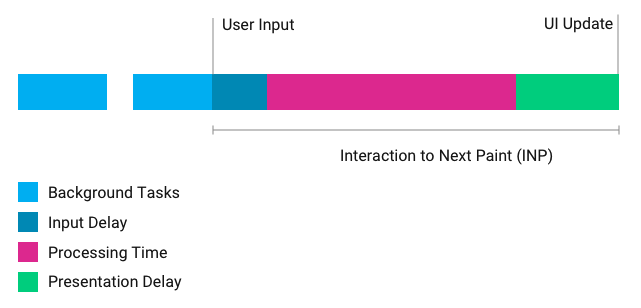
Interaction to Next Paint (INP) is a new metric by Google that measures how quickly a page responds to user input. It measures how much time elapsed between a user interaction, like a click or key press, and the next update of the screen.
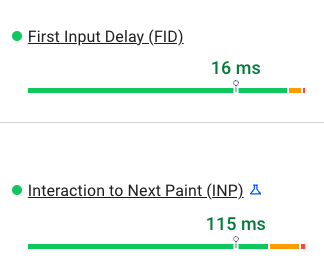
INP may eventually replace First Input Delay (FID) as one of the Core Web Vitals.
2024 Update: Interaction to Next Paint (INP) has now replaced First Input Delay (FID) as a Core Web Vital.
Since INP also includes processing time and presentation delay it has a higher value than First Input Delay. It also looks at one of the slowest page interactions, unlike FID which only looks at the first one.
Desktop Core Web Vitals As A Ranking Factor
Google’s three Core Web Vitals metrics assess user experience and are used as a ranking factor by Google.
The original mobile rollout happened in June 2021, but in February 2022 the page experience ranking updates also started impacting desktop searches.
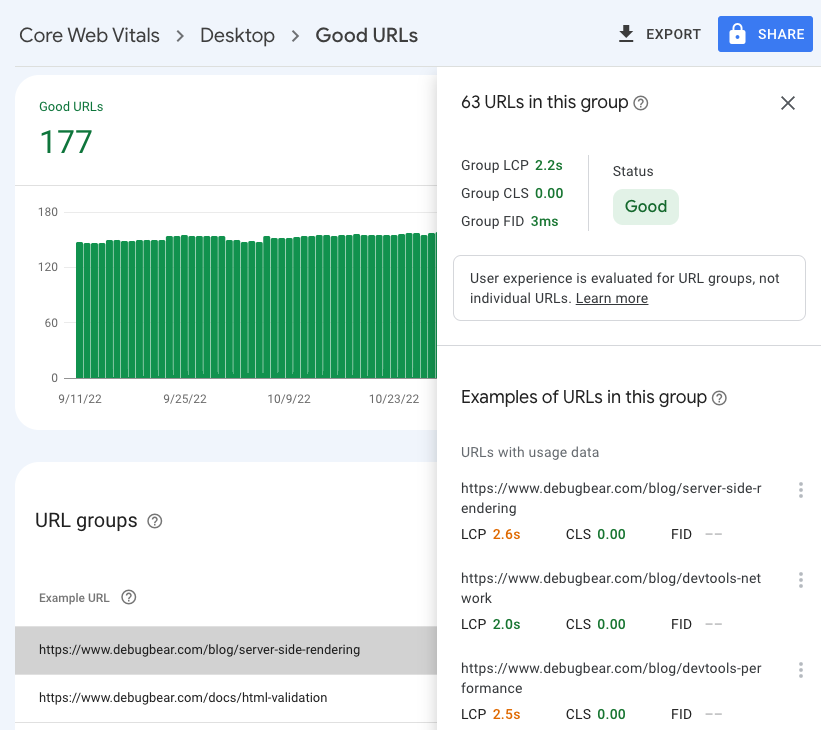
You can see how well your website is doing in Google Search Console. This year Google also started showing URL-level data where it’s available, so you can quickly see what pages you need to optimize.
Back/Forward Cache in Chrome
A lot of page navigations are just back/forward movements in the browser history. Mobile browsers have long tried to speed up these navigation by saving the page state and restoring it.
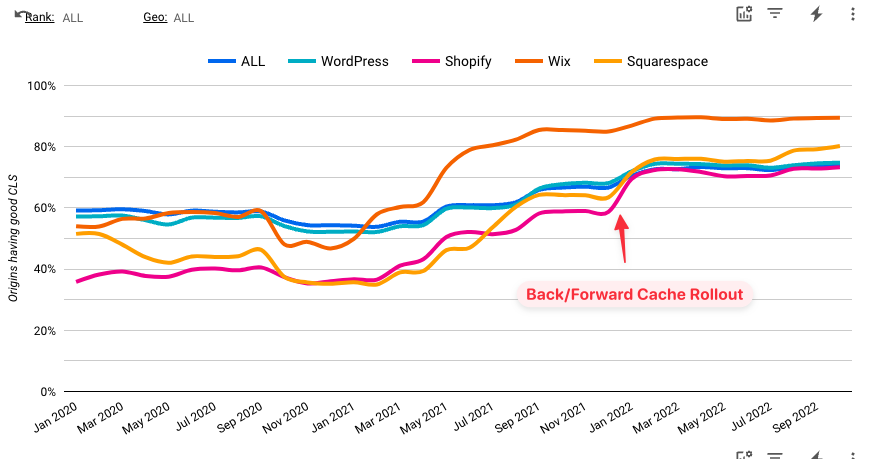
Chrome’s Back/Forward cache is now fully rolled out on mobile and desktop. Technically this change happened in November 2021, but it felt worth highlighting as the positive impact only became fully visible this year.
For example, the cache rollout caused a big improvement in Cumulative Layout Shift scores.
View Observed Metrics In PageSpeed Insights
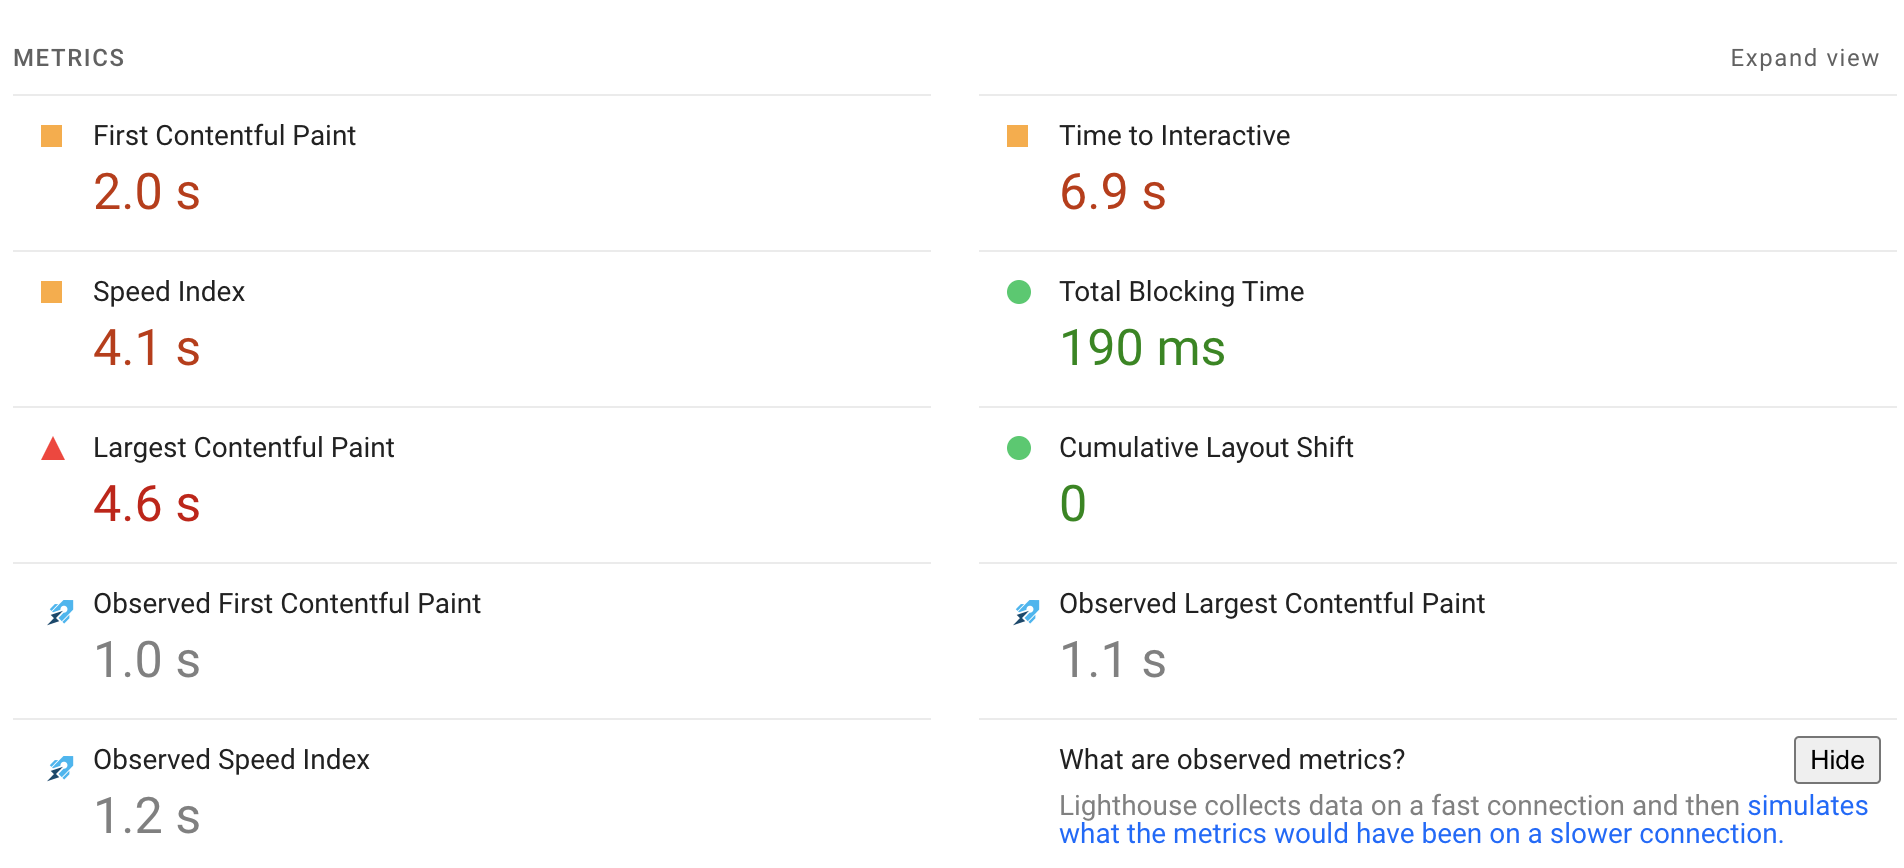
The simulated throttling that many Lighthouse-based tools use has often caused confusion when interpreting the metrics reported by PageSpeed Insights.
We’ve now released a Chrome Extension that surfaces the original data Lighthouse collected from Chrome.
For example, if the throttled values are faster than the original metric that suggests a problem with the simulation. If the First Contentful Paint and Largest Contentful Paint are very close in the observed data and very different in the simulated data then that can also indicate limitations of the Lighthouse simulation.
HTTP/3 Standardized
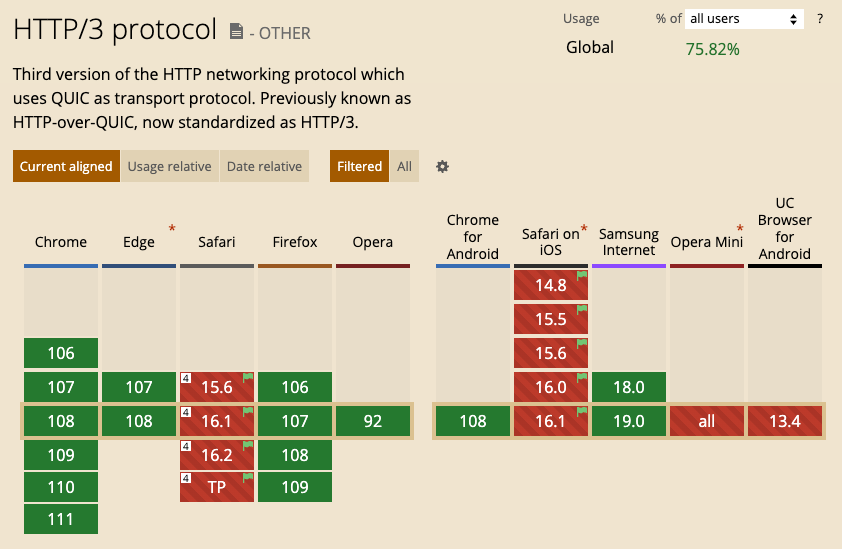
Browsers have long been experimenting with the HTTP/3 protocol, but it was finally standardized in June 2022.
HTTP/3 achieves several performance goals, for example reducing the number of network round trips to establish a connection and making it easier for mobile users to migrate connections when moving between different networks.
Better data on what requests are render-blocking
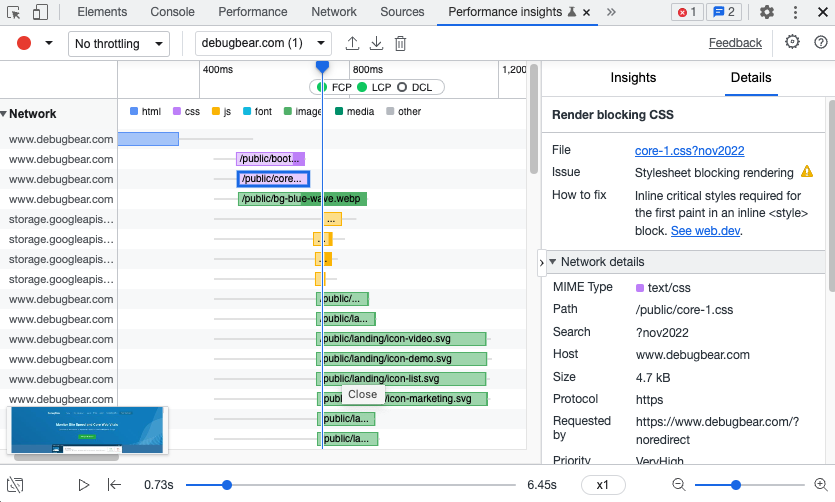
Render-blocking requests are important for performance as they prevent the whole page from rendering. But they can sometimes be hard to identify. Luckily Chrome has started reporting more details on whether a request is render blocking, as you can see in this waterfall view.

The Resource Timing API now also reports a renderBlockingStatus property.

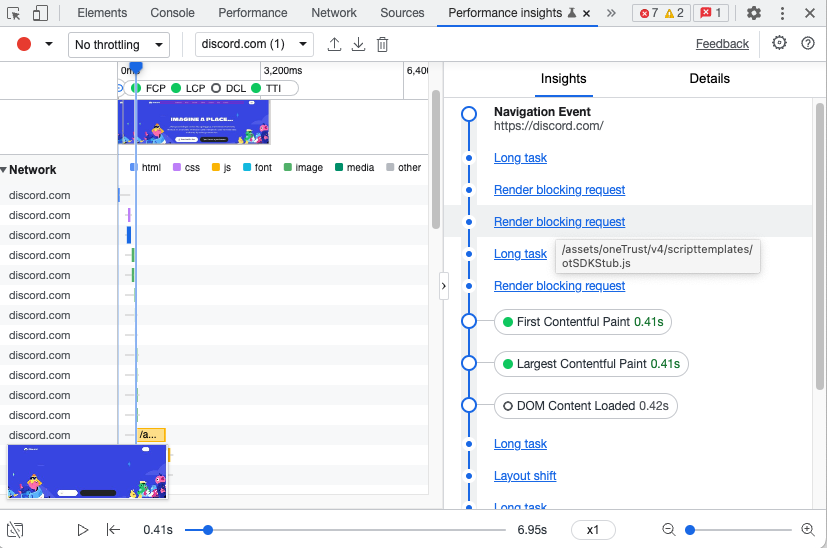
Finally, the new Performance Insights tab in DevTools also shows this data.
Chrome DevTools Performance Insights Panel
The DevTools Performance tab shows a really comprehensive view of a website, but it doesn’t do much to prioritize information and generate insights. The new Performance Insights tab in Chrome DevTools aims to identify issues impacting Core Web Vitals more easily.
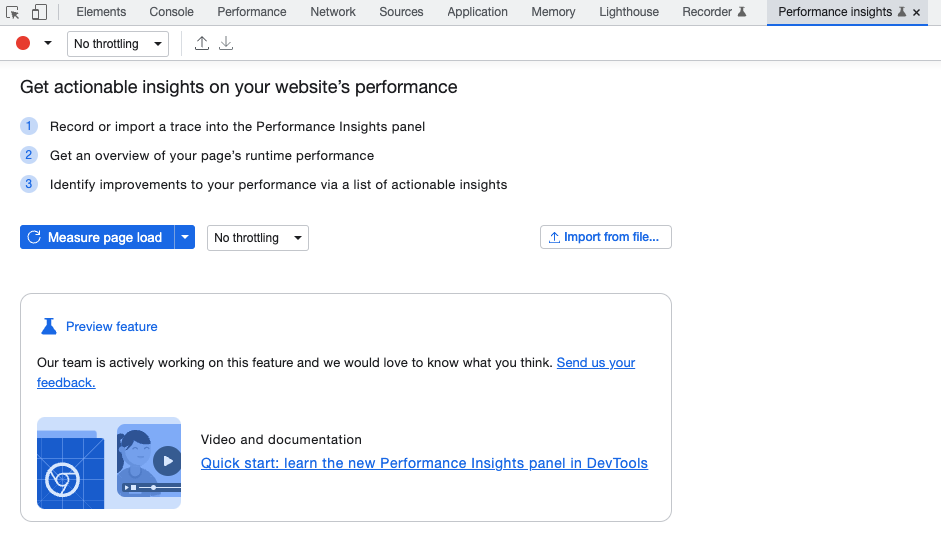
It shows a series of Insights relevant to performance and then suggests possible fixes.
103 Early Hints
Browser resource hints tell the browser to load resources or create server connections before they are needed. The 103 HTTP status code allows web servers to tell the browser about resources that will be needed in the future before the full HTML response is ready.
That way the browser can start loading these resources while the server is still processing the request. For example, render-blocking stylesheets or web fonts can start loading early, or the browser could preconnect to an API subdomain.
This is especially useful when using a CDN. The CDN provides servers that are related in close proximity to the user’s location. It can return an early 103 response within milliseconds, before sending the document request off to the main website server for processing.
Full page prerendering in Chrome
Sometimes it’s very likely that the user will soon navigate to a new page, and since the release of version 108 in November Chrome will start loading the page prior to the actual navigation.
When the navigation happens the page that was loaded in the background is “foregrounded”, possibly rendering instantly.
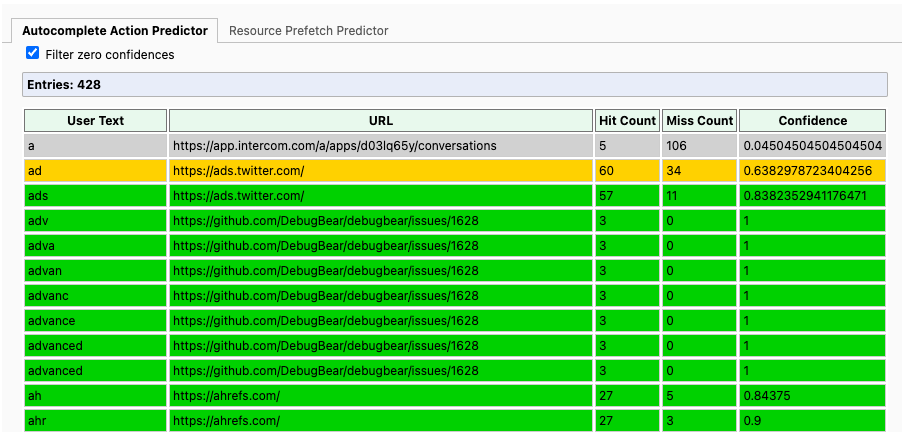
For example, when I type “ads” into the omnibox Chrome is 83% certain that I’ll go to ads.twitter.com, so it will preload that page when I start typing. (Check out chrome://predictors/ to view information about your own browsing behavior.)
Websites can also use the Speculation Rules API to tell the browser about likely upcoming navigations.
New free website speed test
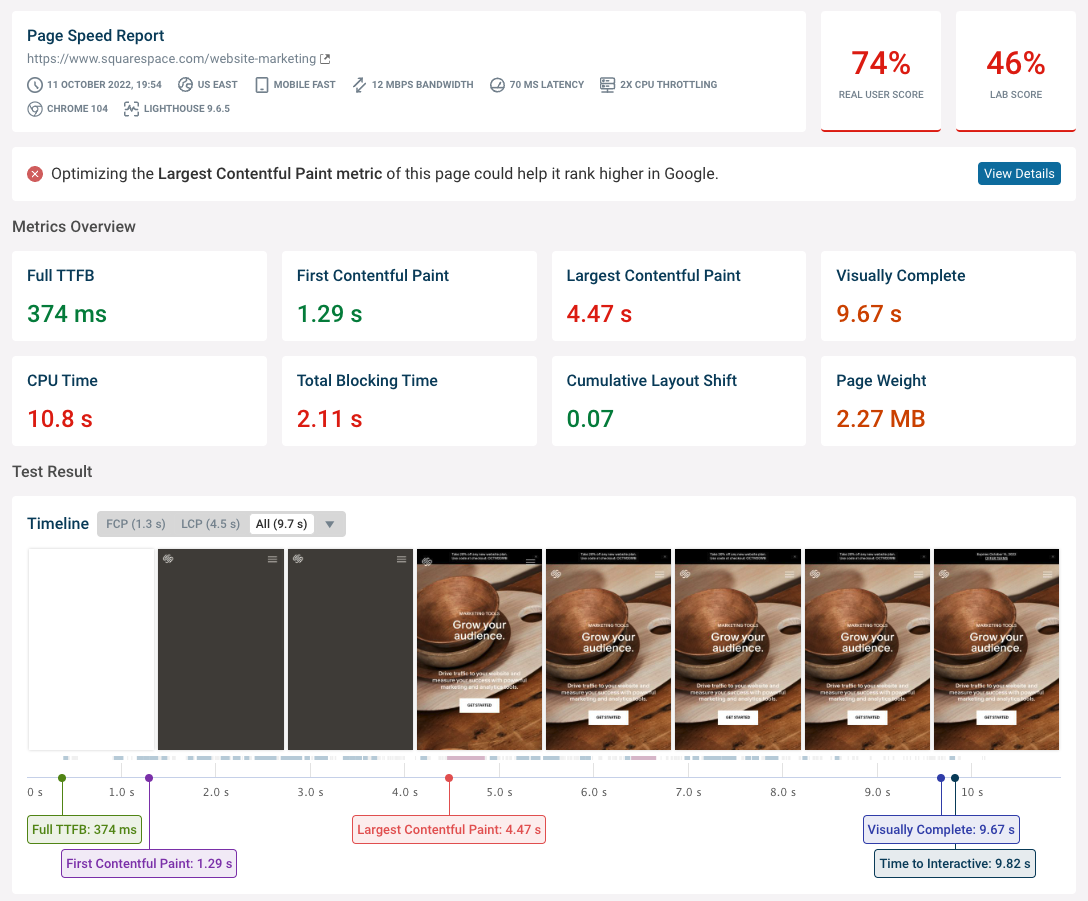
This October we launched our new free website speed test at debugbear.com/test. See how fast your website is in the lab and in the field data collected by Google. You can click on each rendering metric to get a detailed request waterfall that tells you how to optimize it.
AVIF support in Safari
Modern image formats like WebP and AVIF can significantly speed up websites by encoding the same information in smaller files.
While WebP has been widely supported for over two years, AVIF support only arrived in Safari this September with the release of iOS 16 and macOS Ventura.
AVIF especially shines when compressing low-fidelity images, meaning it’s a great choice when you want to show photos on your website and save bandwidth.
Keep in mind that not every Safari user has upgraded yet and that Edge still doesn’t support AVIF.
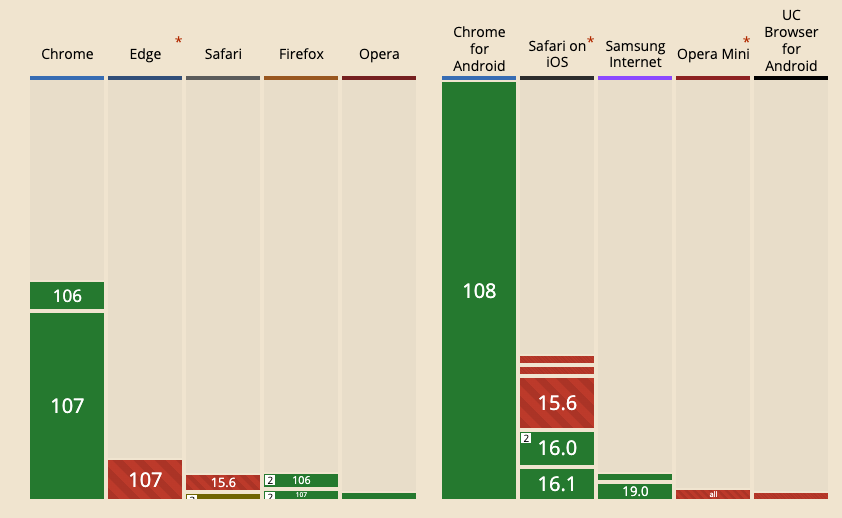
Native image lazy loading in Safari
Native image lazy loading ensures that images only load when they are about to enter the viewport, saving bandwidth and prioritizing the more important page content.
Since the release of iOS 15.4 this March Safari now also supports the loading="lazy" attribute. It's now supported in all major browsers with overall global support of 92% of users.
A look ahead to 2023
In 2023 it'll be interesting to see how tooling improves for page interactions after the initial page load. Lighthouse already supports running user flows and can report the Interaction to Next Paint metric. DevTools has also added a recorder feature for recording user flows.
There are also proposals around improving performance reporting for soft navigations. A single page app will show content for multiple URLs throughout its lifetime, but currently performance metrics are often only attributed to the initial landing page. Being able to track rendering milestones for history.push navigations would also help collect better data on user experience.
Lighthouse hasn't had a major release since November 2021, but we can expect version 10.0 next year with updates to how the Performance score is calculated.
Conclusion
A lot of new browser features have become available to improve website performance in the last year. We also have new tools to measure and improve site speed.
2022 also saw the return of the performance.now() conference in Amsterdam. I really enjoyed getting to meet so many people working on web performance and learning from the talks as well.
Subscribe to our newsletter for monthly updates on the latest in web performance.