This has been a good year for web performance. We've seen some exciting new features and updates that have the potential to make a big impact on how we build and optimize websites.
Here are our favorite web performance features and updates from 2024:
1. Interaction to Next Paint became a Core Web Vital
In March 2024, Interaction to Next Paint (INP) became a Core Web Vital.
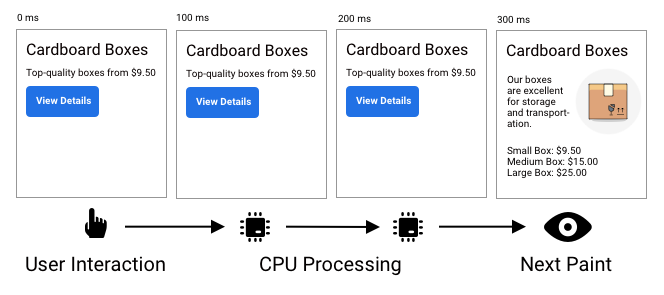
INP measures the delay between user interactions and visual updates on a webpage, and it became a Google ranking factor as of March 2024 - through Core Web Vitals. The metric tracks responsiveness through three components: initial input delay, processing time of event handlers, and presentation delay for visual updates. A score under 200 milliseconds is considered good, while over 500 milliseconds is poor.
Unlike its predecessor First Input Delay, all interactions may be considered for INP. Applicable interactions are mouse clicks, touch screen taps, and keyboard inputs.
Optimization strategies include minimizing CPU processing, running code asynchronously, and managing both first-party and third-party scripts effectively. Developers can measure INP using tools like PageSpeed Insights, Chrome DevTools, and the Web Vitals library, which help identify and fix responsiveness issues affecting user experience and search rankings.
DebugBear's Real User Monitoring tool also offers a dedicated INP dashboard.
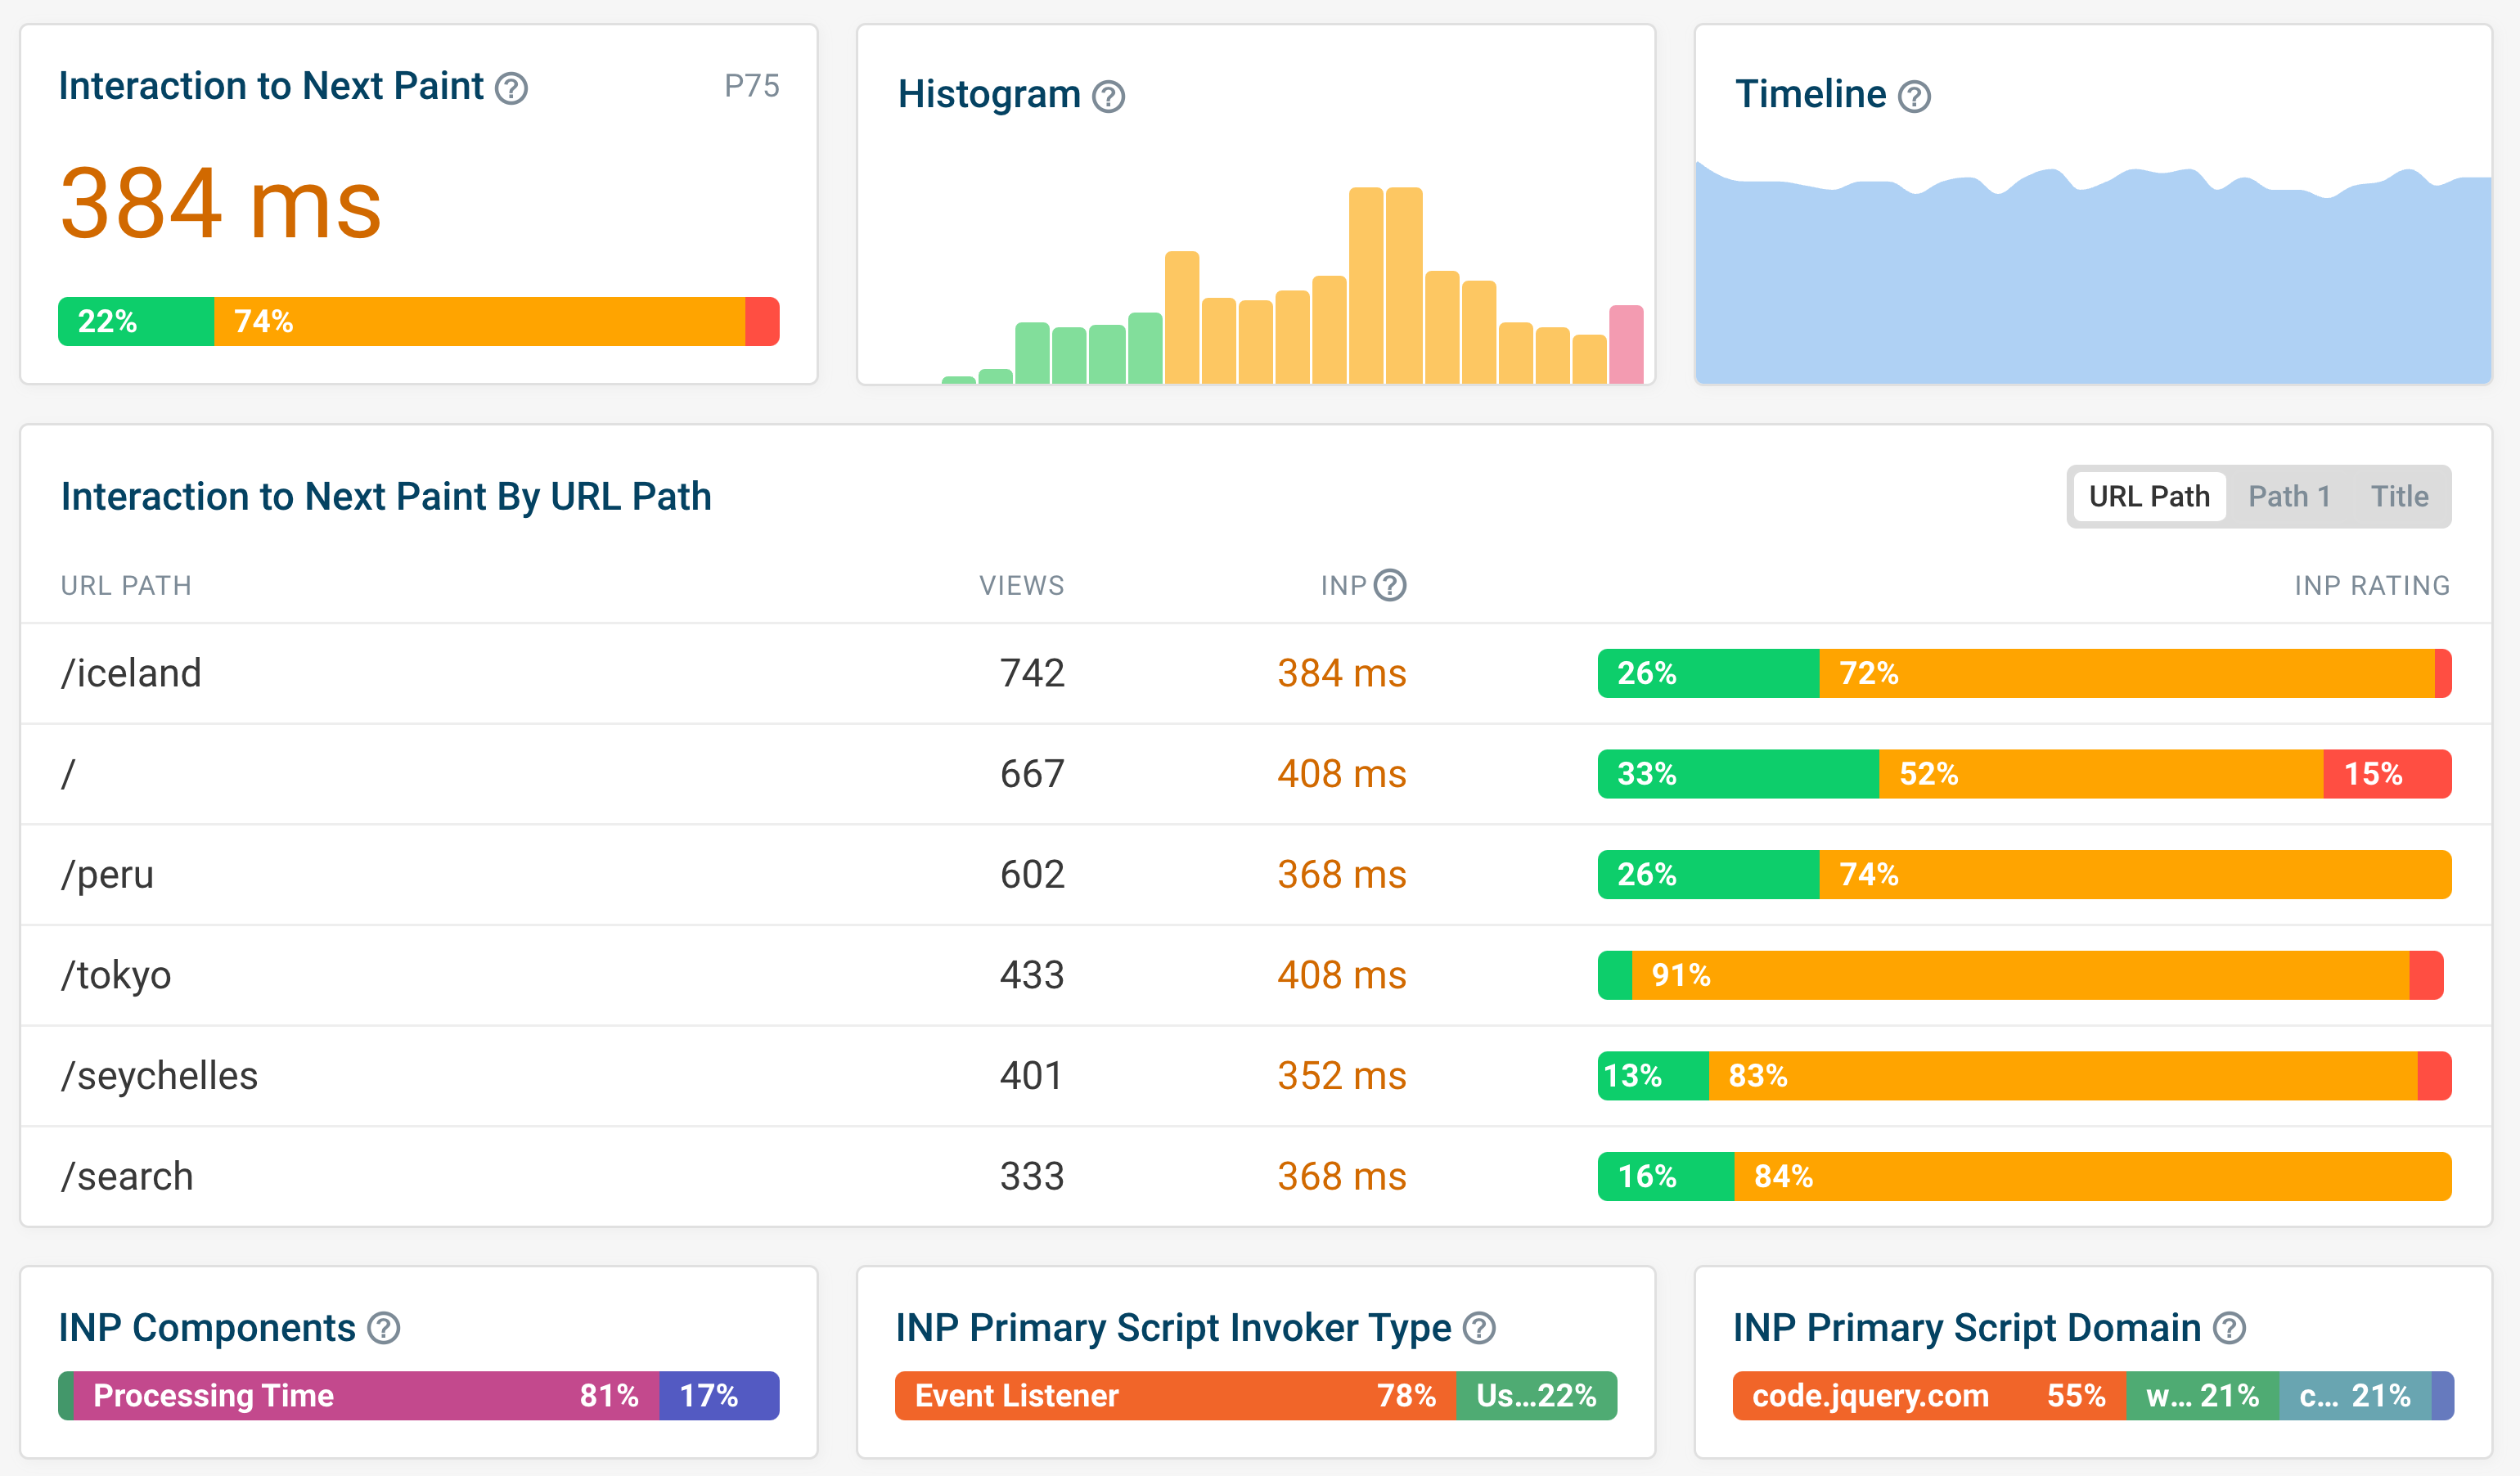
What we think of INP becoming a Core Web Vital: FID has some limitations, but INP offers a realistic view of user interactions and page responsiveness. So this is a welcome change!
Since INP is a field metric, start capturing real user data with DebugBear's free trial so you understand your current interaction performance from actual users.
2. scheduler.yield Lets You Break Up Long Tasks In Smaller Chunks
scheduler.yield is now available in Chromium-based browsers.
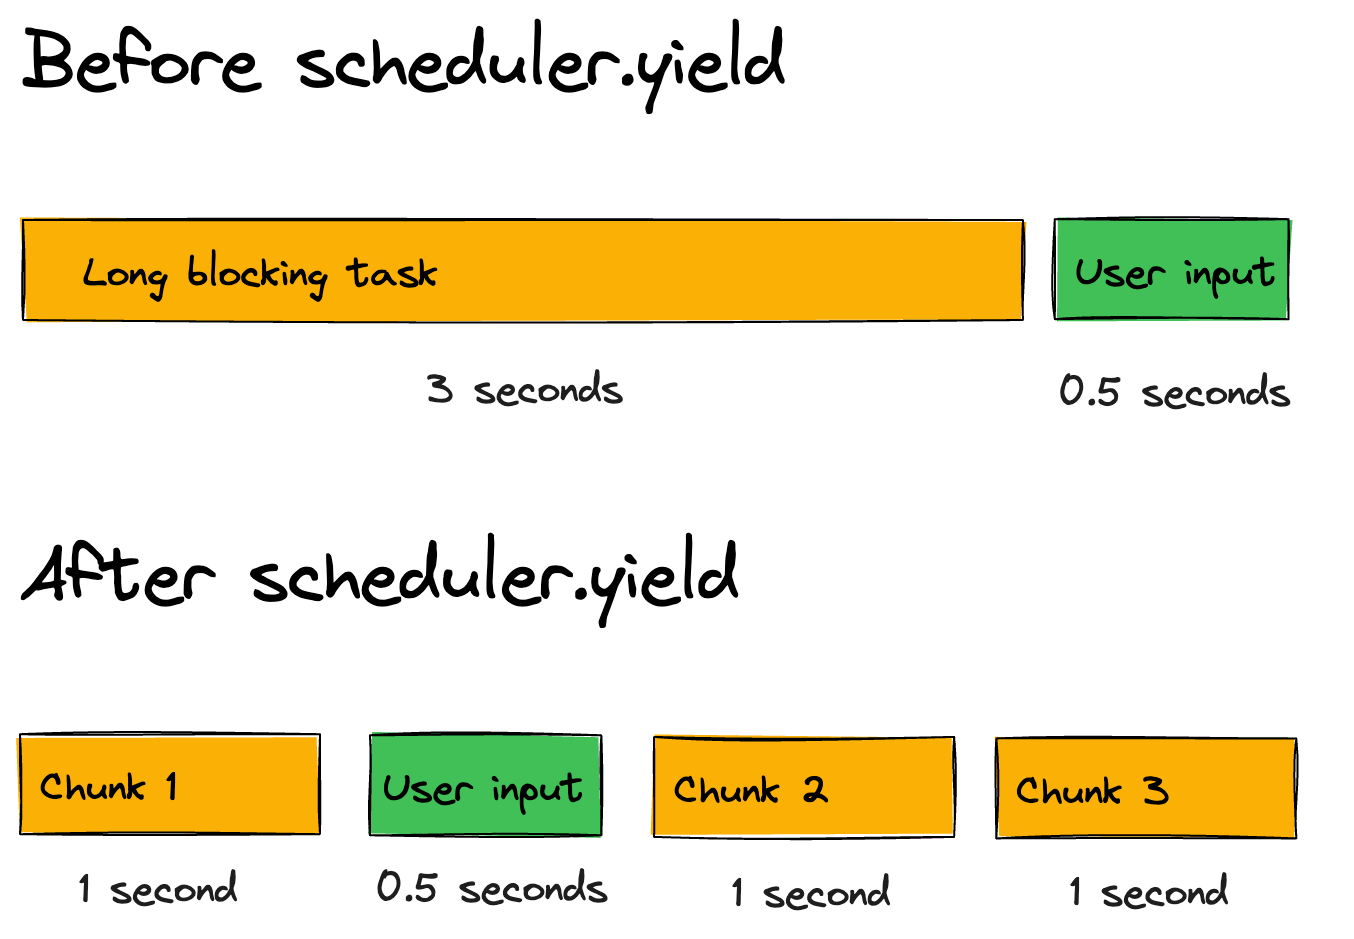
The scheduler.yield API helps optimize web applications by allowing JavaScript to yield control back to the browser's scheduler, enabling important tasks like user input and rendering to execute on the main thread. Rather than running tasks happening continuously, developers can break them into smaller chunks with yields between them. This improves responsiveness and user interaction, and in-turn, INP scores.
What we think about the scheduler.yield API: Having a way to break up long tasks into smaller chunks is great for web performance. We think this will be especially useful for developers working on complex web applications, and framework authors.
You can use our interactive demo to learn how to use scheduler.yield. Once you're comfortable with the API (look at the source code), you can start using it within heavy JavaScript tasks.
3. Long Animation Frames Provide Insights Into Slow User Experiences
The Long Animation Frames API is now available in Chrome and Edge.
The Long Animation Frames (LoAF) API provides developers with useful debug data about CPU tasks and unresponsive page interactions that cause slow user experiences.
The API helps identify what delays frame rendering and which scripts are responsible for these delays, making it particularly valuable for debugging the INP metric. By collecting long-animation-frame entries through performance.getEntries(), developers can analyze script attribution, forced synchronous layouts, and the timing of event handlers.
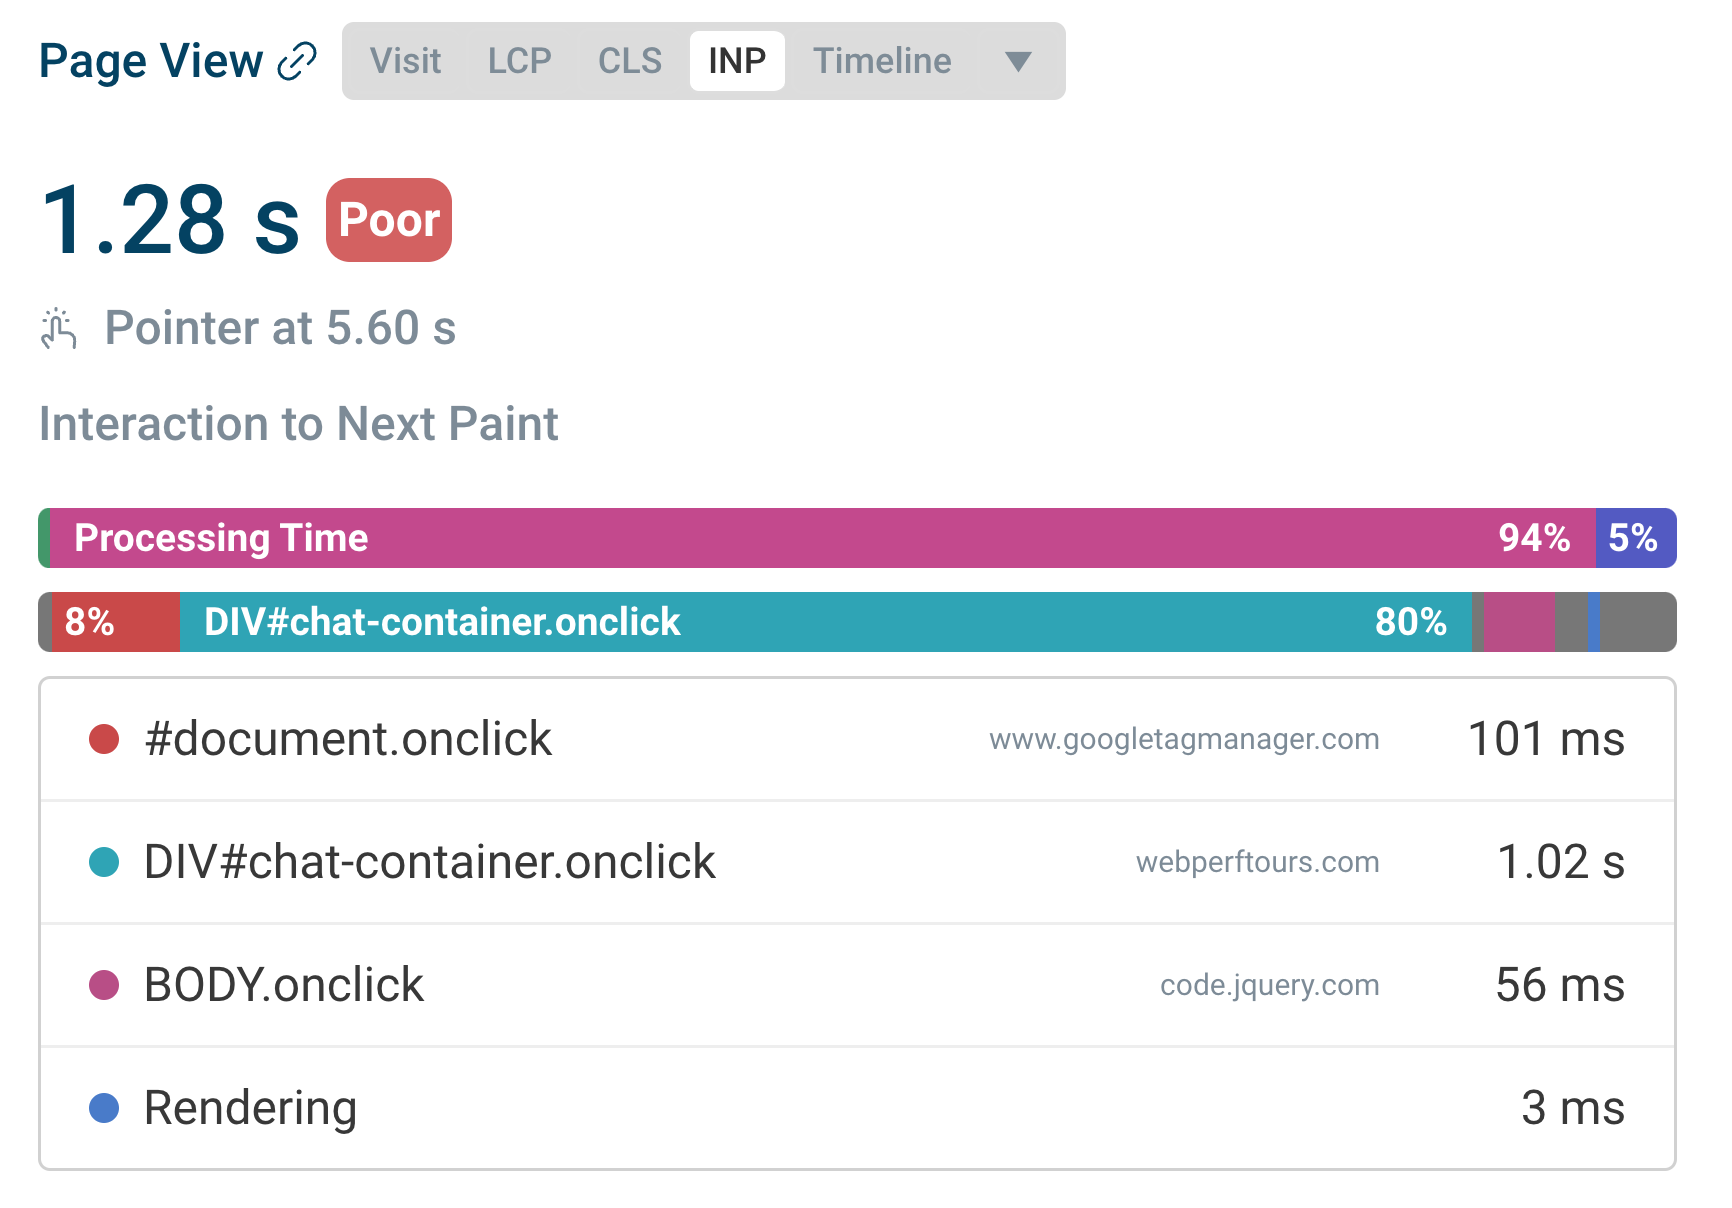
When user interactions trigger slow responses, LoAF data reveals element selectors and event types in script invoker names, helping pinpoint the source of performance issues.
The API can track multiple event handlers and their execution delays, while also providing insights to identify frames causing slow Interaction to Next Paint. For privacy reasons, some script URLs might appear empty in LoAF data, though this can often be resolved by adding the crossorigin="anonymous" attribute to scripts.
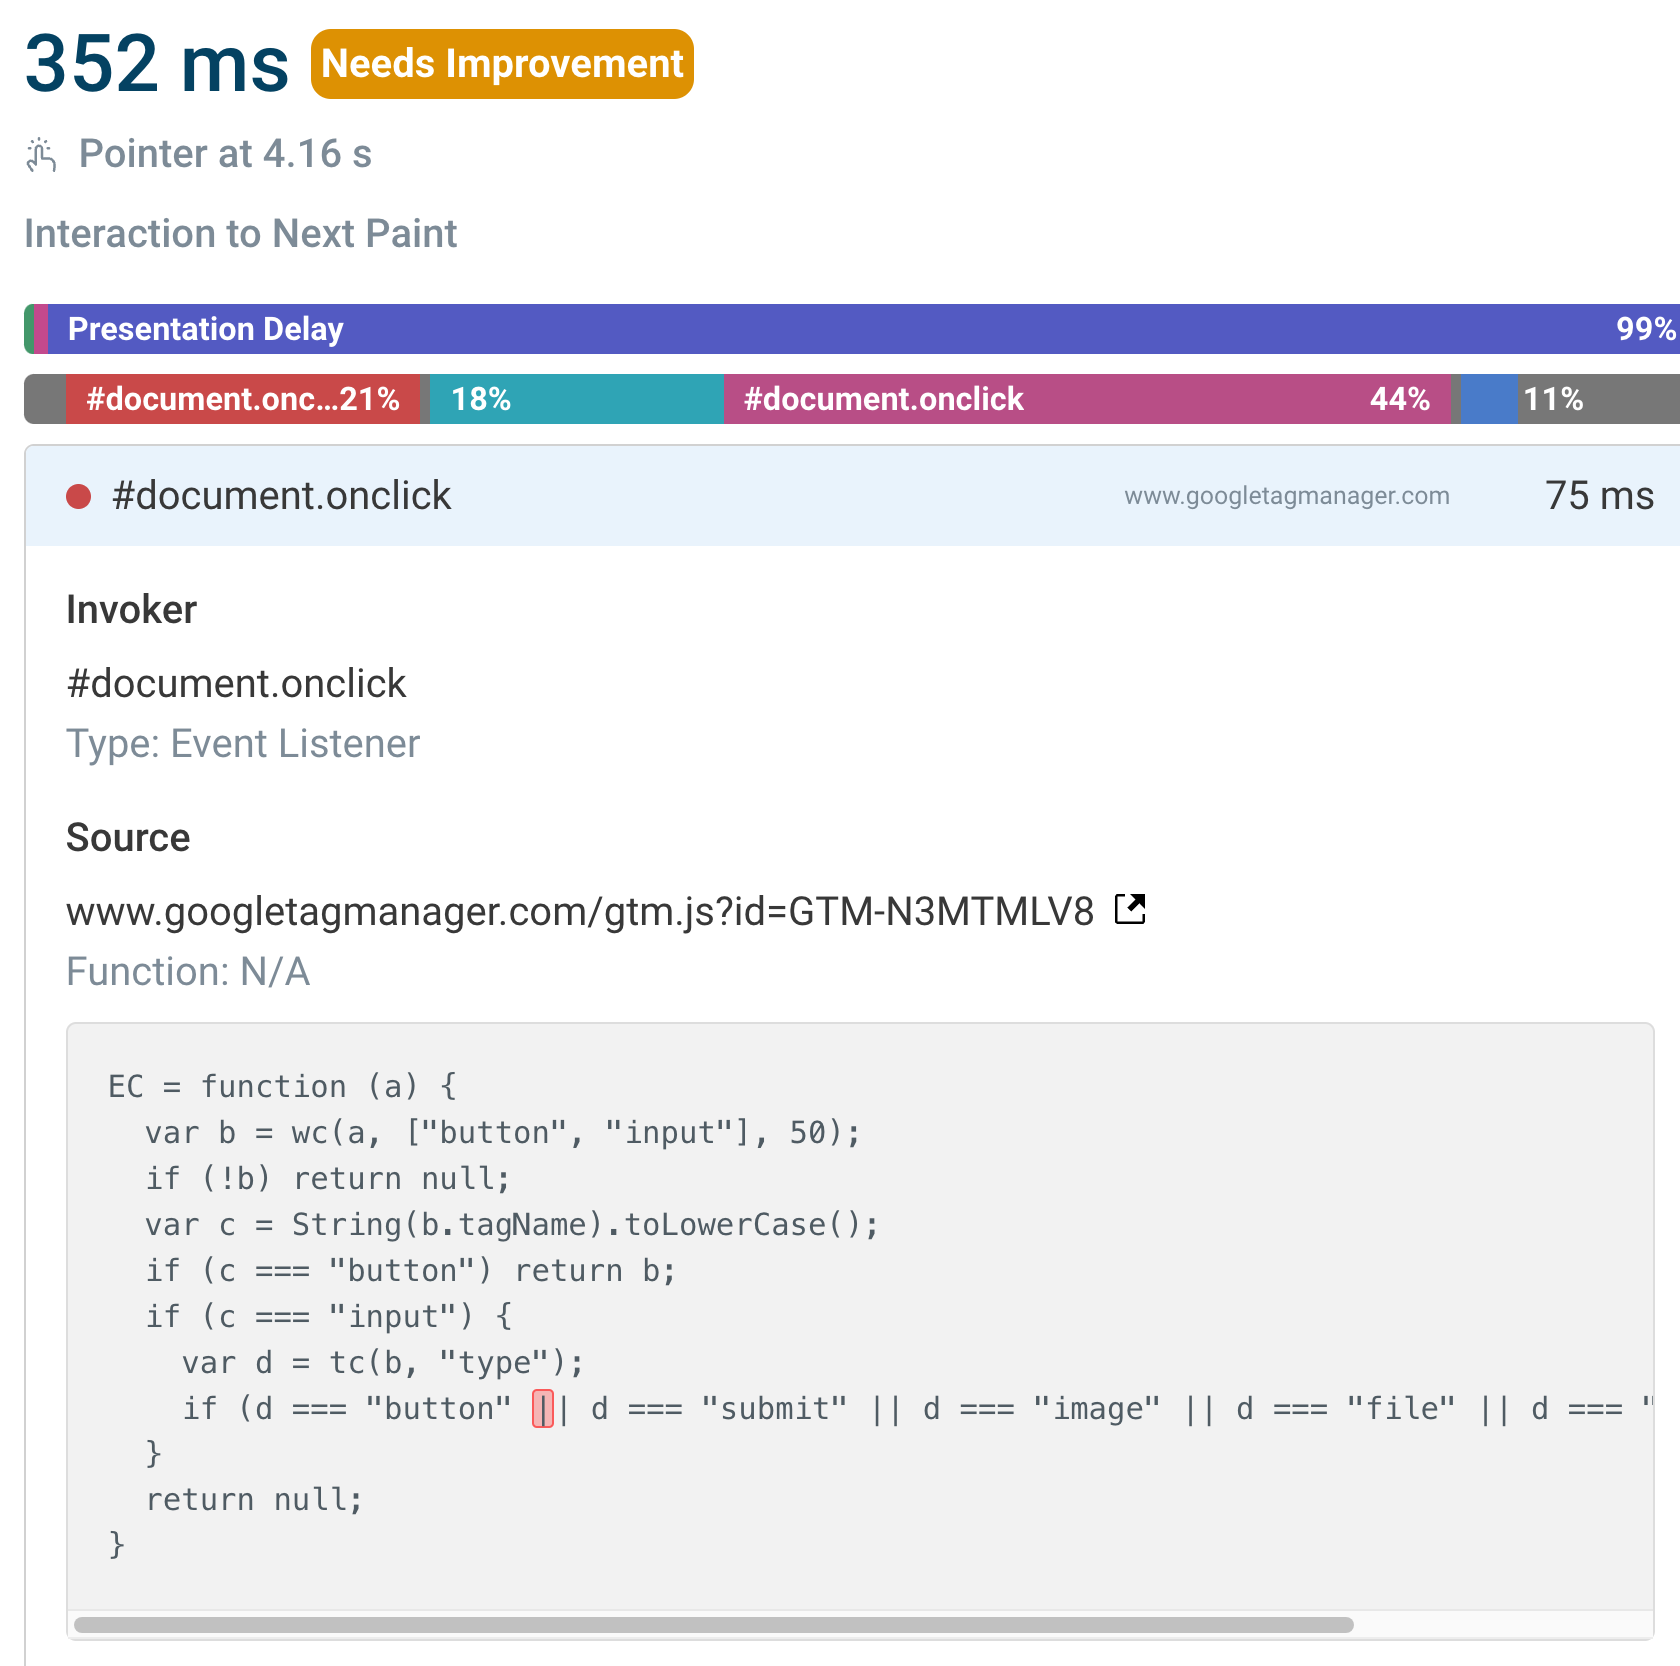
What we think about the new insights from Long Animation Frames: Instead of just being told that a page is slow, developers can now get detailed insights into the line of code that's causing the slowdown. That's a win in our book!
Go ahead and inspect LoAF data from our sample website and then start tracking it on your own website. You can capture this manually with the web-vitals.js library or use a tool like DebugBear to automatically track it.
4. Speculation Rules for Instant Page Navigation
Speculation rules has landed in Chrome, Edge, and other Chromium-based browsers.
Speculation rules enable instant page navigation. Developers can instruct browsers to proactively download and prepare pages in the background, offering two main approaches:
- Prerendering which fully downloads and renders pages.
- Prefetching which only downloads key resources without rendering.
This is useful for developers who want to achieve instant navigation without relying on heavy JavaScript frameworks or complex single-page apps.
Speculation rules can be achieved through either URL List Rules, which specify exact pages to prerender, or Document Rules, which set conditions for prerendering based on patterns and selectors. Developers can control the eagerness of prerendering with settings like immediate, moderate, or conservative, each determining when the prerendering process begins in relation to user interaction.
Prerendering is limited to 10 pages with immediate eagerness, and certain Web APIs are deferred during the prerendering process.
What we think about page navigation with Speculation Rules: Third party libraries have tried to do this in the past, but they've all had their limitations. Having this built into the browser means a more browser-native experience, and that's a good thing.
Start with prefetching, as prerendering needs more testing and consideration. To start, add this code to your web pages, adjusting the URLs as needed:
<script type="speculationrules">
  {
    "prefetch": [
      {
        "urls": ["shop.html", "blog.html", "contact.html"]
      }
    ]
  }
</script>
As you begin to see the benefits of prefetching, you can experiment with prerendering.
5. Chrome DevTools Improvements Are Now Available
Chrome DevTools has received a bunch of improvements in the past year, including performance annotations.
Chrome DevTools has new features aimed at improving web performance debugging and optimization. The Performance Panel now includes tools for analyzing Core Web Vitals metrics (LCP, CLS, and INP), showing both lab data from local testing and field data from real users via the Chrome User Experience Report (CrUX).
The Performance Panel also offers detailed breakdowns of performance metrics, including LCP load phases, interactive elements causing INP issues, and layout shift culprits. There are also visual representations of performance problems and specific recommendations for improvements, such as adding fetchpriority attributes, optimizing image formats, or addressing layout stability issues.
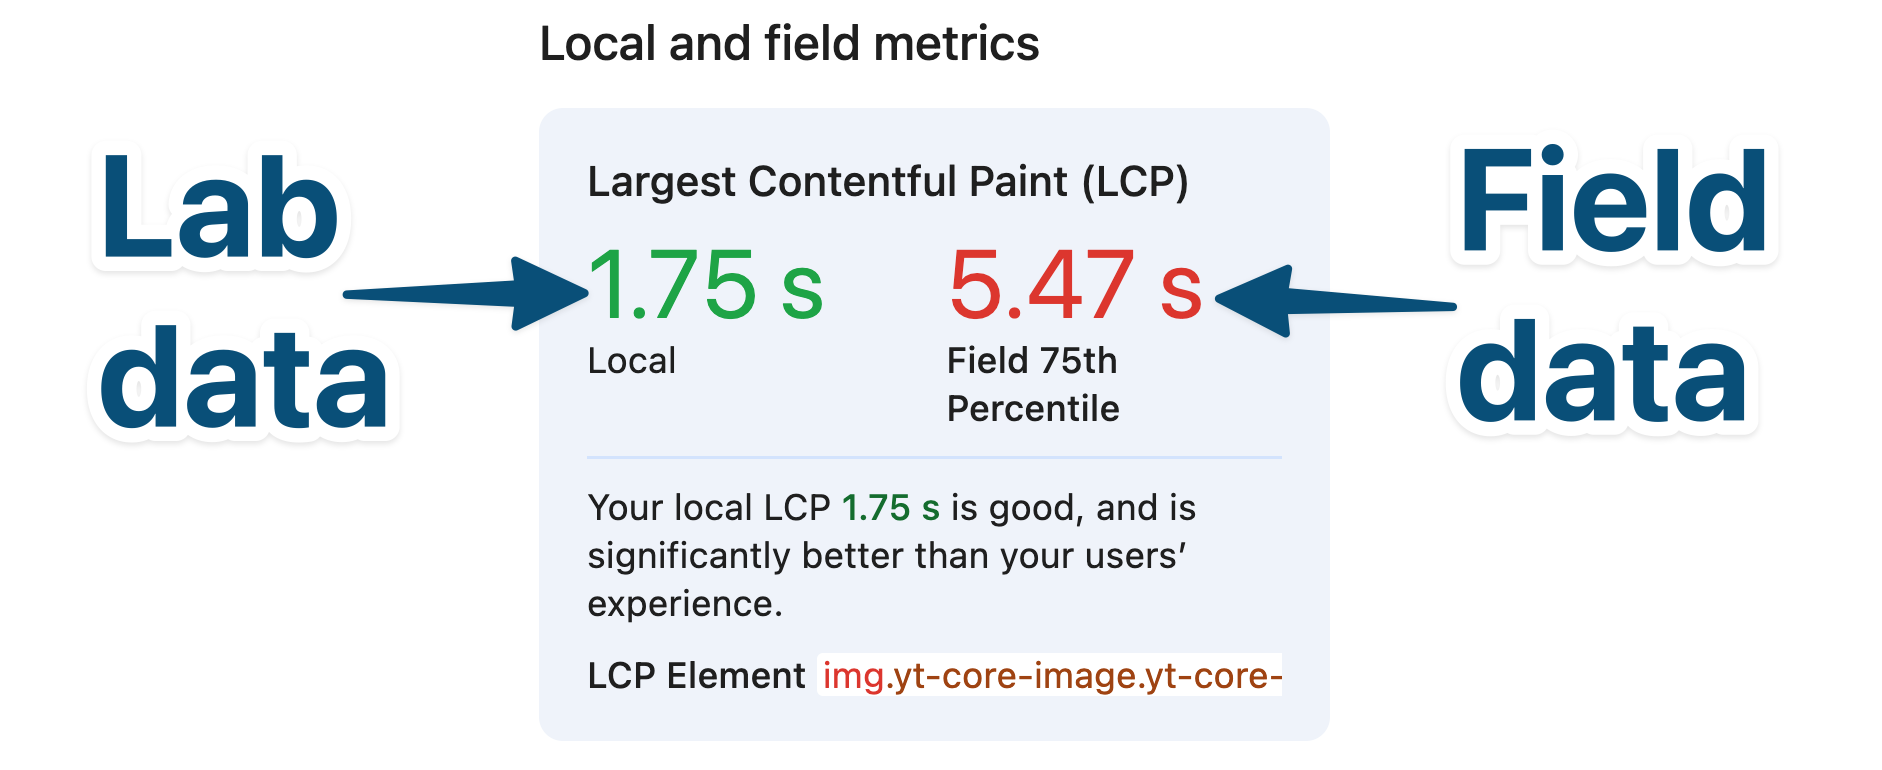
Developers can add annotations to performance recordings, including item labels, connections between events, and time ranges, helping teams collaborate on performance optimization.
What we think about the Chrome DevTools improvements: The Performance Annotation features should make collaboration within teams easier. No more staring at a confusing waterfall chart and trying to explain what's going on.
Try these two things with the Performance panel open in Chrome DevTools:
- Navigate through your website and notice your Core Web Vitals metrics.
- Capture a performance recording, and then double click on individual events to add annotations to records.
6. Cloudflare Speed Brain Automates Web Performance Optimization
Cloudflare announced Speed Brain in September 2024, a new feature that uses machine learning to optimize web performance.

Cloudflare's Speed Brain helps improve web performance optimization, using predictive prefetching through the Speculation Rules API to improve page load times. This works by anticipating user behavior and instructing browsers to download content before it's needed. Speed Brain uses Cloudflare's CDN network, so that only cacheable content is prefetched.
Their stated results look good, with free plan domains experiencing up to a 45% reduction in Largest Contentful Paint (LCP), and potential improvements of up to 75% when using machine learning models for predictive prefetching. Cloudflare plans to enhance Speed Brain with more sophisticated machine learning models and full page prerendering capabilities in future versions.
What we think about Cloudflare's approach to page prefetching: This feels like a no-brainer (pun intended!). Cloudflare has lots of data to aid predictive prefetching, and it's great to see them using it to improve web performance.
With Cloudflare setup on your domain, navigate to Cloudflare Dashboard > Speed > Optimization > Recommendations > Speed Brain and ensure that the feature is enabled.
7. Shared Compression Dictionaries Now Supported in Chrome
Shared Compression Dictionaries is now supported in Chrome.
Shared compression dictionaries offer an improvement in HTTP file compression, offering a new way to reduce data transfer for repeated website visits. This works by maintaining a list of common terms or phrases frequently used across files, allowing the server to compress resources more efficiently and the browser to decompress them effectively. When a file has been updated, previously downloaded data can be reused instead of downloading entirely new content, potentially reducing file sizes by more than 90% in some cases.
The web performance benefits of shared compression dictionaries are impressive — in some cases, they can reduce the download size of a text or binary file by more than 90%.
There's support for both static (delta) compression for files that change with new releases, like CSS and JavaScript files, and dynamic compression for frequently changing content like blog posts or product pages.
Shared compression dictionaries extend two popular HTTP compression algorithms - Brotli and Zstandard - and was released with Chrome 130.
Implementation requires proper HTTP header configuration, including the Use-As-Dictionary header for marking resources as dictionaries, and the Available-Dictionary header for browsers to indicate available dictionaries.
What we think about Shared Compression Dictionaries: This is a great way to reduce the amount of data that needs to be transferred between the server and the browser. Could also lead to cost savings.
8. View Transitions API Offers Seamless Page Navigation
View Transitions made their way to Chrome and Edge, and Safari.
View Transitions offer a powerful way to animate transitions between different views in web applications, improving both perceived performance and user experience. The API comes in two forms: same-document transitions for single-page app interactions, and cross-document transitions for navigation between different pages on the same website.
While the default implementation requires just a few lines of CSS to enable a cross-fade effect, developers can create more sophisticated animations by customizing transitions using CSS keyframes and JavaScript events.
A recommended approach for most websites is to combine cross-document view transitions with speculation rules, as this provides good performance and graceful degradation in older browsers.
It's important that websites remain fully functional even when view transitions aren't supported.
For web apps with complex state management and interactive components, same-document view transitions paired with the Navigation API offer better state preservation between navigations.
What we think about the View Transitions API: Web developers now have more reasons to ditch the heavy JavaScript frameworks, while still providing smooth transitions between pages.
Add this code to your global CSS, and start navigating between pages on your website to test it:
@view-transition {
  navigation: auto;
}
9. PageSpeed Insights Adjusts Throttling Settings
PageSpeed Insights is adjusting its throttling settings to provide more realistic performance scores, with changes rolling out to both PSI and its API. The update aims to address concerns about unrealistically slow test results from PSI servers.
Users are advised to focus primarily on Core Web Vitals data from real users, using Lighthouse scores only as a rough guide for potential improvements rather than as a definitive performance metric.
What we think about the PageSpeed Insights throttling changes: This is a welcome change. It's important that the performance scores we see are as close to real-world performance as possible.
Try entering your website URL into PageSpeed Insights and observe the results.
10. DebugBear Has Been Cooking
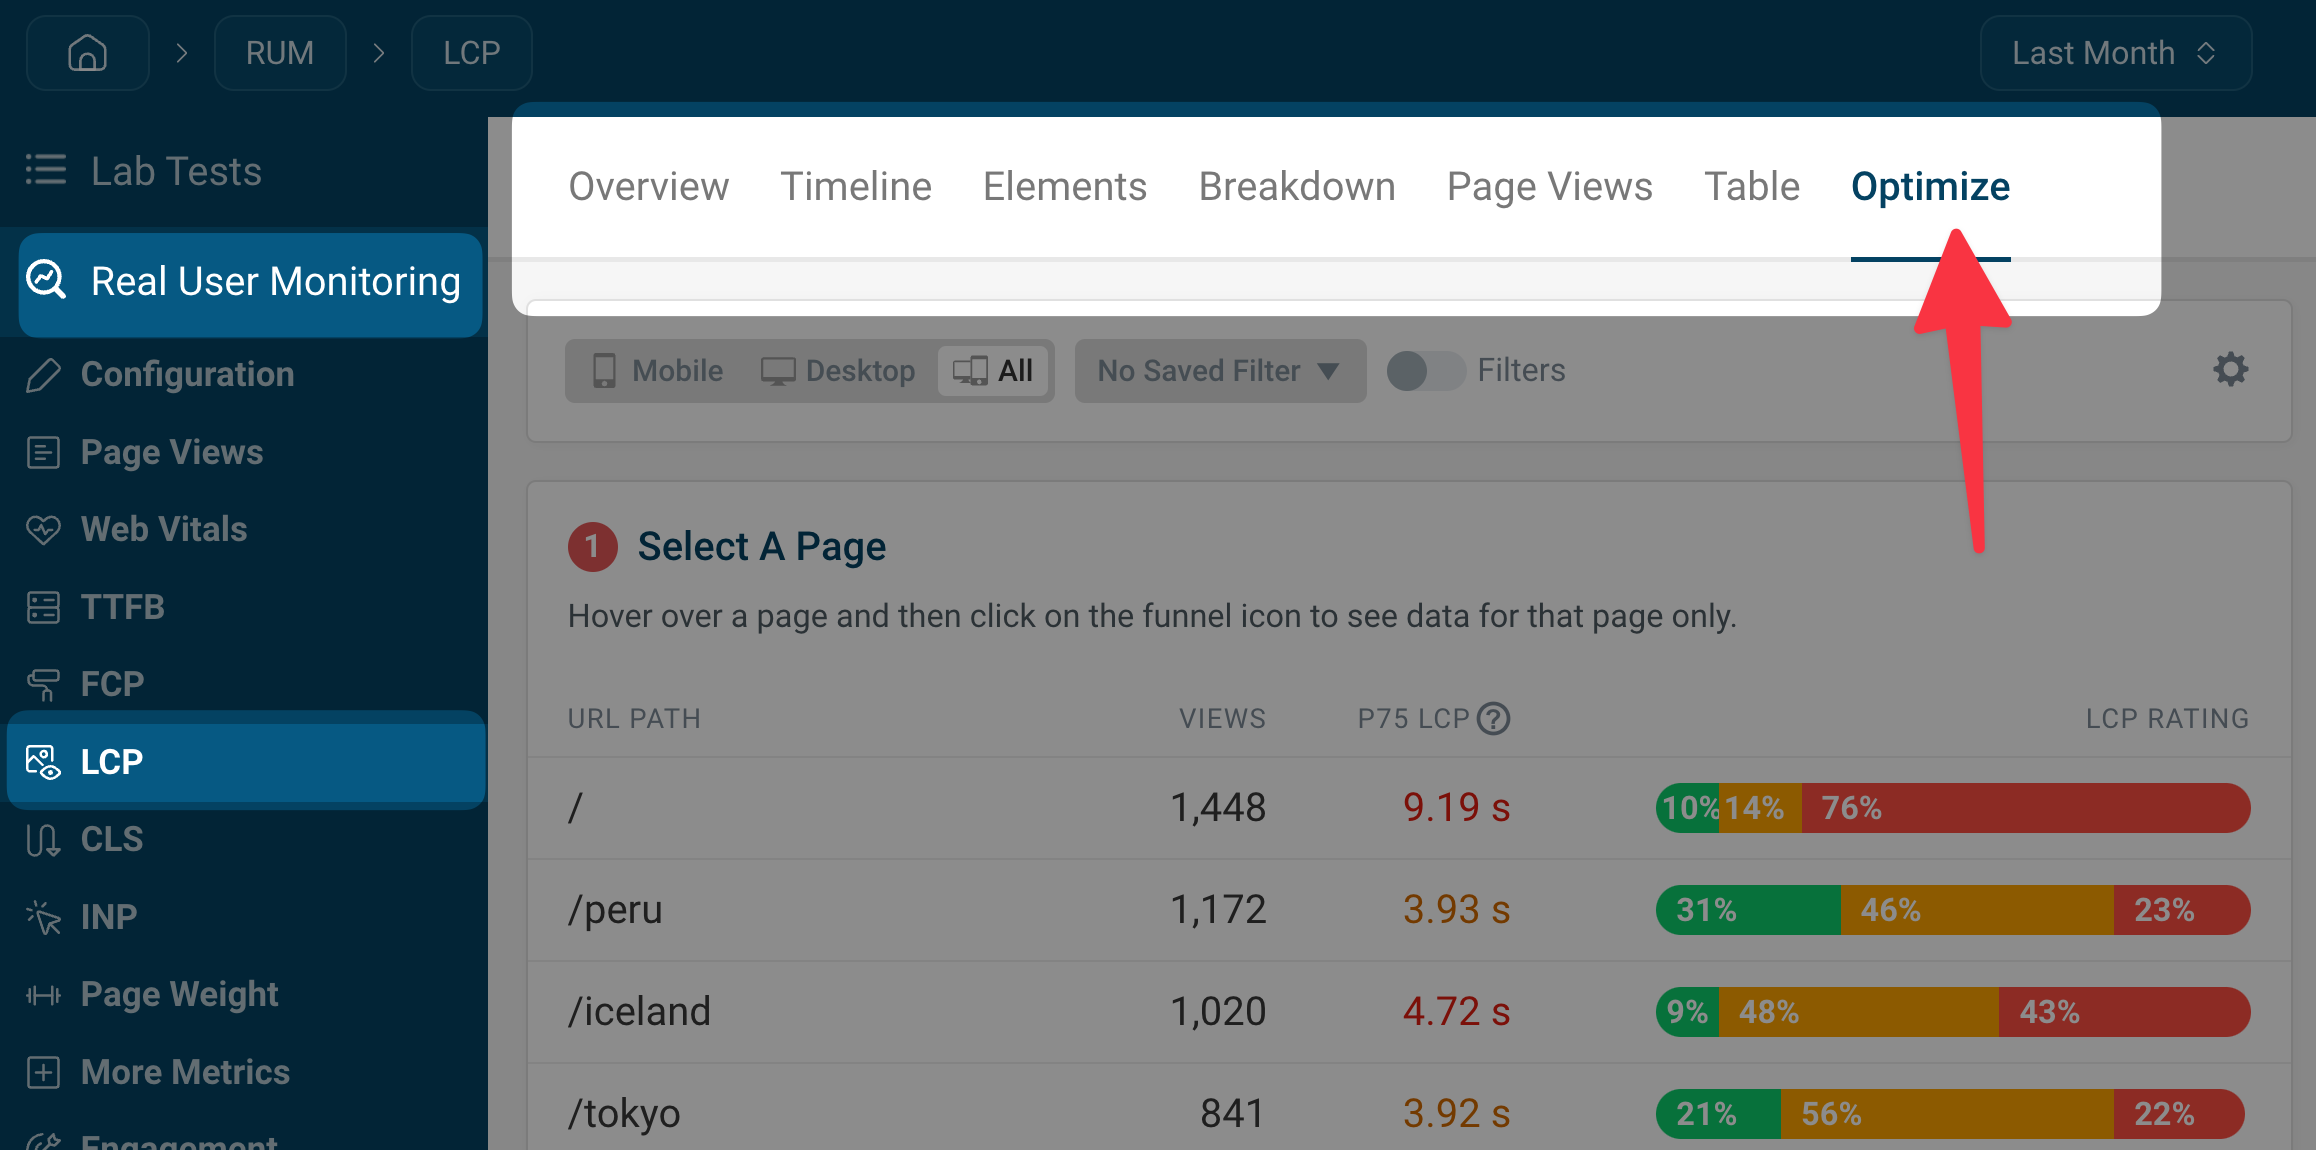
DebugBear has expanded its Real User Monitoring capabilities with new Optimize tabs across multiple performance metrics like LCP and INP. These tabs provide a guided, step-by-step approach to identifying and fixing performance issues. The process involves selecting specific pages and elements, analyzing the root causes of poor performance, and drilling down into individual user experiences.
Another addition is the new error tracking dashboard that displays total error counts, common error messages, and problematic script URLs, enabling quick identification of user-impacting issues.
DebugBear has ramped up its educational content through the official DebugBear YouTube channel, covering a wide range of web performance topics.
Topics include lazy loading best practices, font optimization, script loading techniques, and detailed explanations of performance metrics like INP and LCP, with videos ranging from quick tips to in-depth tutorials.
Check out the YouTube channel, the blog, and the documentation for more web performance insights and optimization strategies.
