
Checking your Core Web Vitals as a one-off is not enough, you need to monitor them continuously to ensure your site is performing well for all users. This guide teaches you how to use the web-vitals.js library to monitor Core Web Vitals for your real users.
What You'll Learn
Google already collects some performance data from real users on certain websites. While the Chrome User Experience Report (CrUX) can be interesting to view, it's limited to Chrome browsers on popular websites.
This post discusses how to use the web-vitals JavaScript library to collect Core Web Vitals data from your own users, and discusses some options for sending Web Vitals data to a server.
You'll learn how to get detailed real user debug data for Core Web Vitals using the attribution build - a feature of the web-vitals library that provides detailed information about what might be causing performance issues:
- See what element interactions cause poor INP.
- Learn what LCP components are the biggest.
- Understand what scripts contribute to INP and more.
Introduction to Core Web Vitals and the web-vitals.js Library
Core Web Vitals are performance metrics that Google considers important in a webpage's overall user experience. The three Core Web Vitals are:
- 🖼️ Largest Contentful Paint (LCP): Measures how quickly the main page content renders
- 🖱️ Interaction to Next Paint (INP): Measures the latency for a user interaction
- ↕️ Cumulative Layout Shift (CLS): Measures the visual stability of the page
The web-vitals library provides an easy way to measure these metrics (and more) from your real users. At its simplest level, you can use the library by registering callbacks for each Core Web Vitals metric:
<script type="module">
  import { onCLS, onINP, onLCP } from "https://unpkg.com/web-vitals@4?module";

  onCLS(console.log);
  onINP(console.log);
  onLCP(console.log);
</script>
You pass a callback function to each of the onCLS, onINP, and onLCP functions. When the metric is ready to be reported, the callback is invoked with the metric data.
Passing console.log as the callback to onCLS like this: onCLS(console.log) is just another way of writing this code:
onCLS((metric) => {
  console.log(metric);
});
While logging to your own browser console is a start, the real value comes from sending this data to a server while collecting it from real users who are visiting your site.
When you run this code on your own developer machine, it's essentially lab data. But when you implement it on your production site, that's when you get valuable field data.
At this point, you know how to import the web-vitals library and set up basic logging. Now it's time to dive into how you can collect Web Vitals data using both vanilla JavaScript and the official library.
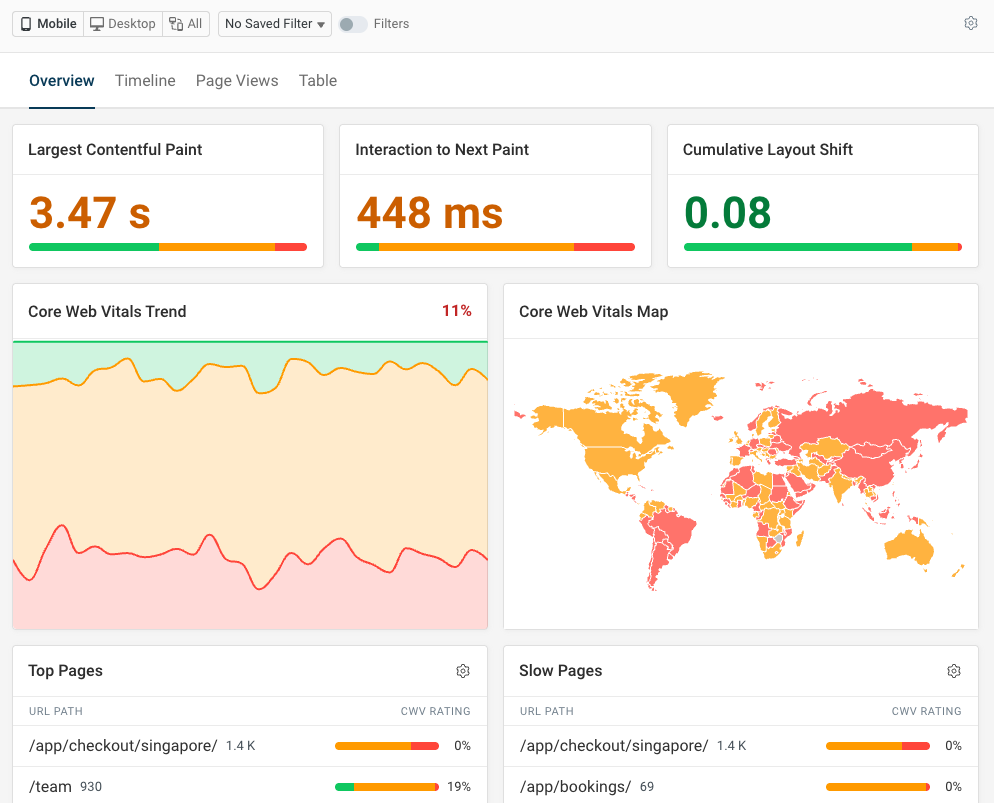
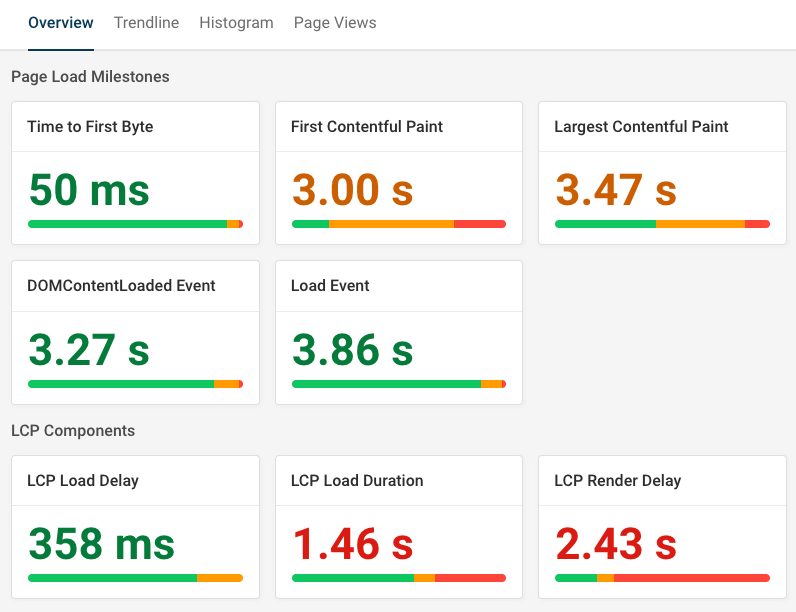
Ultimately you'll be able to collect Core Web Vitals on your website and set up dashboards to help you analyze performance. The screenshot shows what that looks like when using DebugBear real user monitoring.
Collect web vitals data with Vanilla JavaScript
While it's easier to use the official library, you can also collect Web Vitals data using vanilla JavaScript by calling the performance browser APIs directly. Here's how you can do it for each of the Core Web Vitals:
Collect Largest Contentful Paint (LCP) data with Vanilla JavaScript
To collect LCP data, you can use the PerformanceObserver API which has good browser support. While the API has good browser support, metric availability can vary between browsers.
Try pasting this code into the Console panel of the Chrome DevTools.
new PerformanceObserver((entryList) => {
  for (const entry of entryList.getEntries()) {
    console.log("LCP candidate:", entry.startTime, entry);
  }
}).observe({ type: "largest-contentful-paint", buffered: true });
Here's an example of the output when running this code on the example.com website:
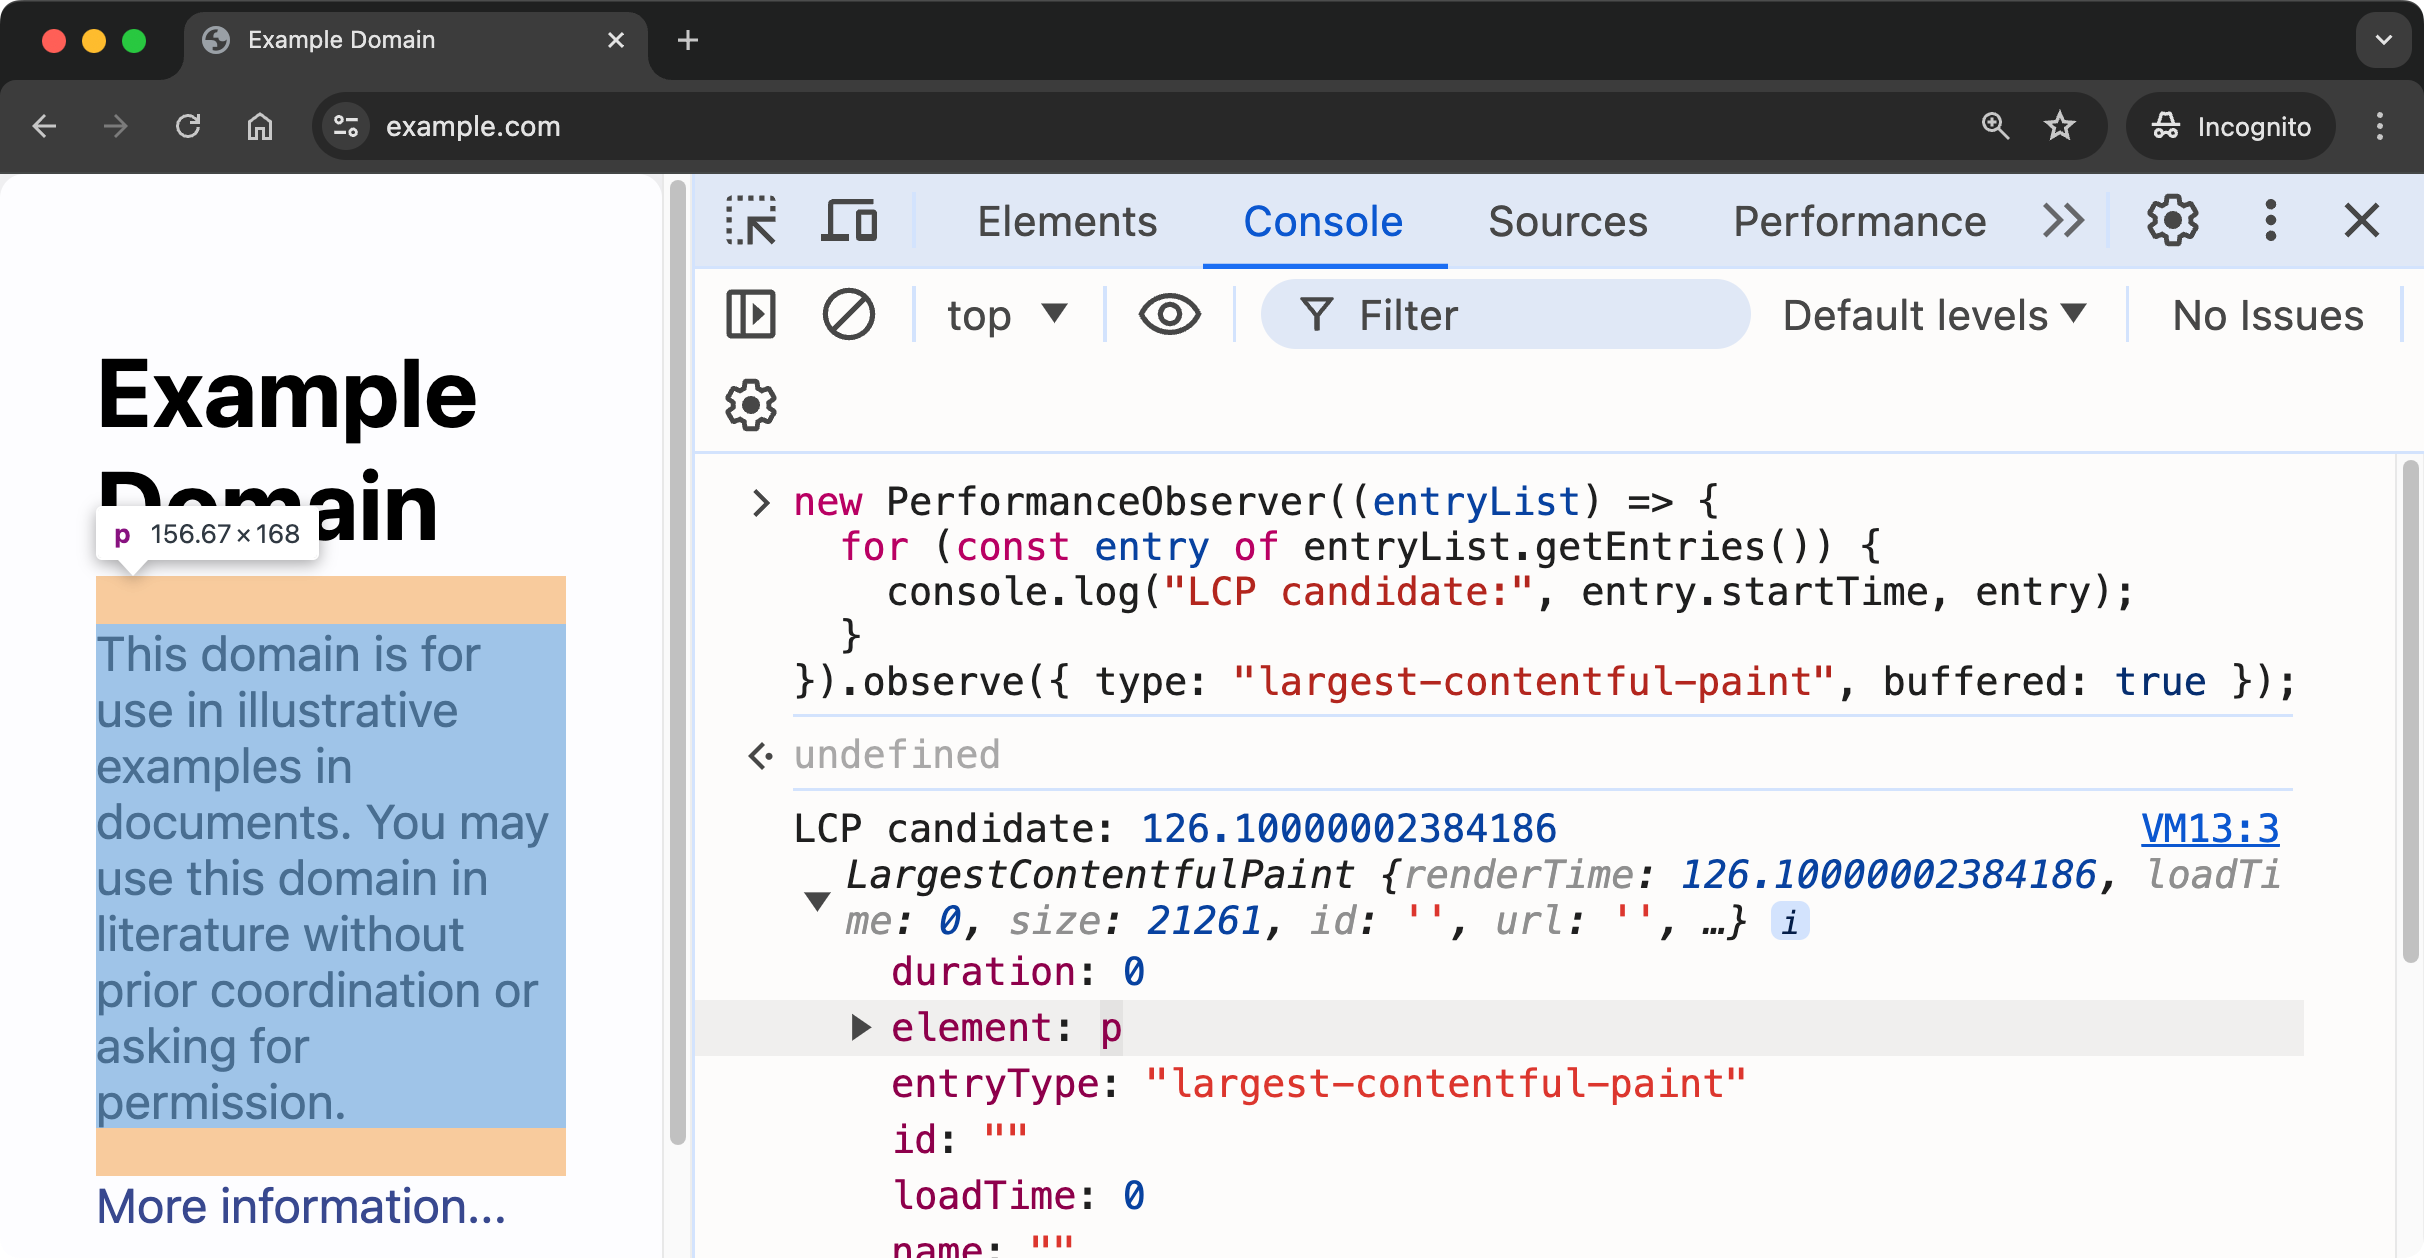
Note how you get a specific reference to the LCP element. You can use the DOM node reference to assist with debugging and identifying the element that's causing the LCP.
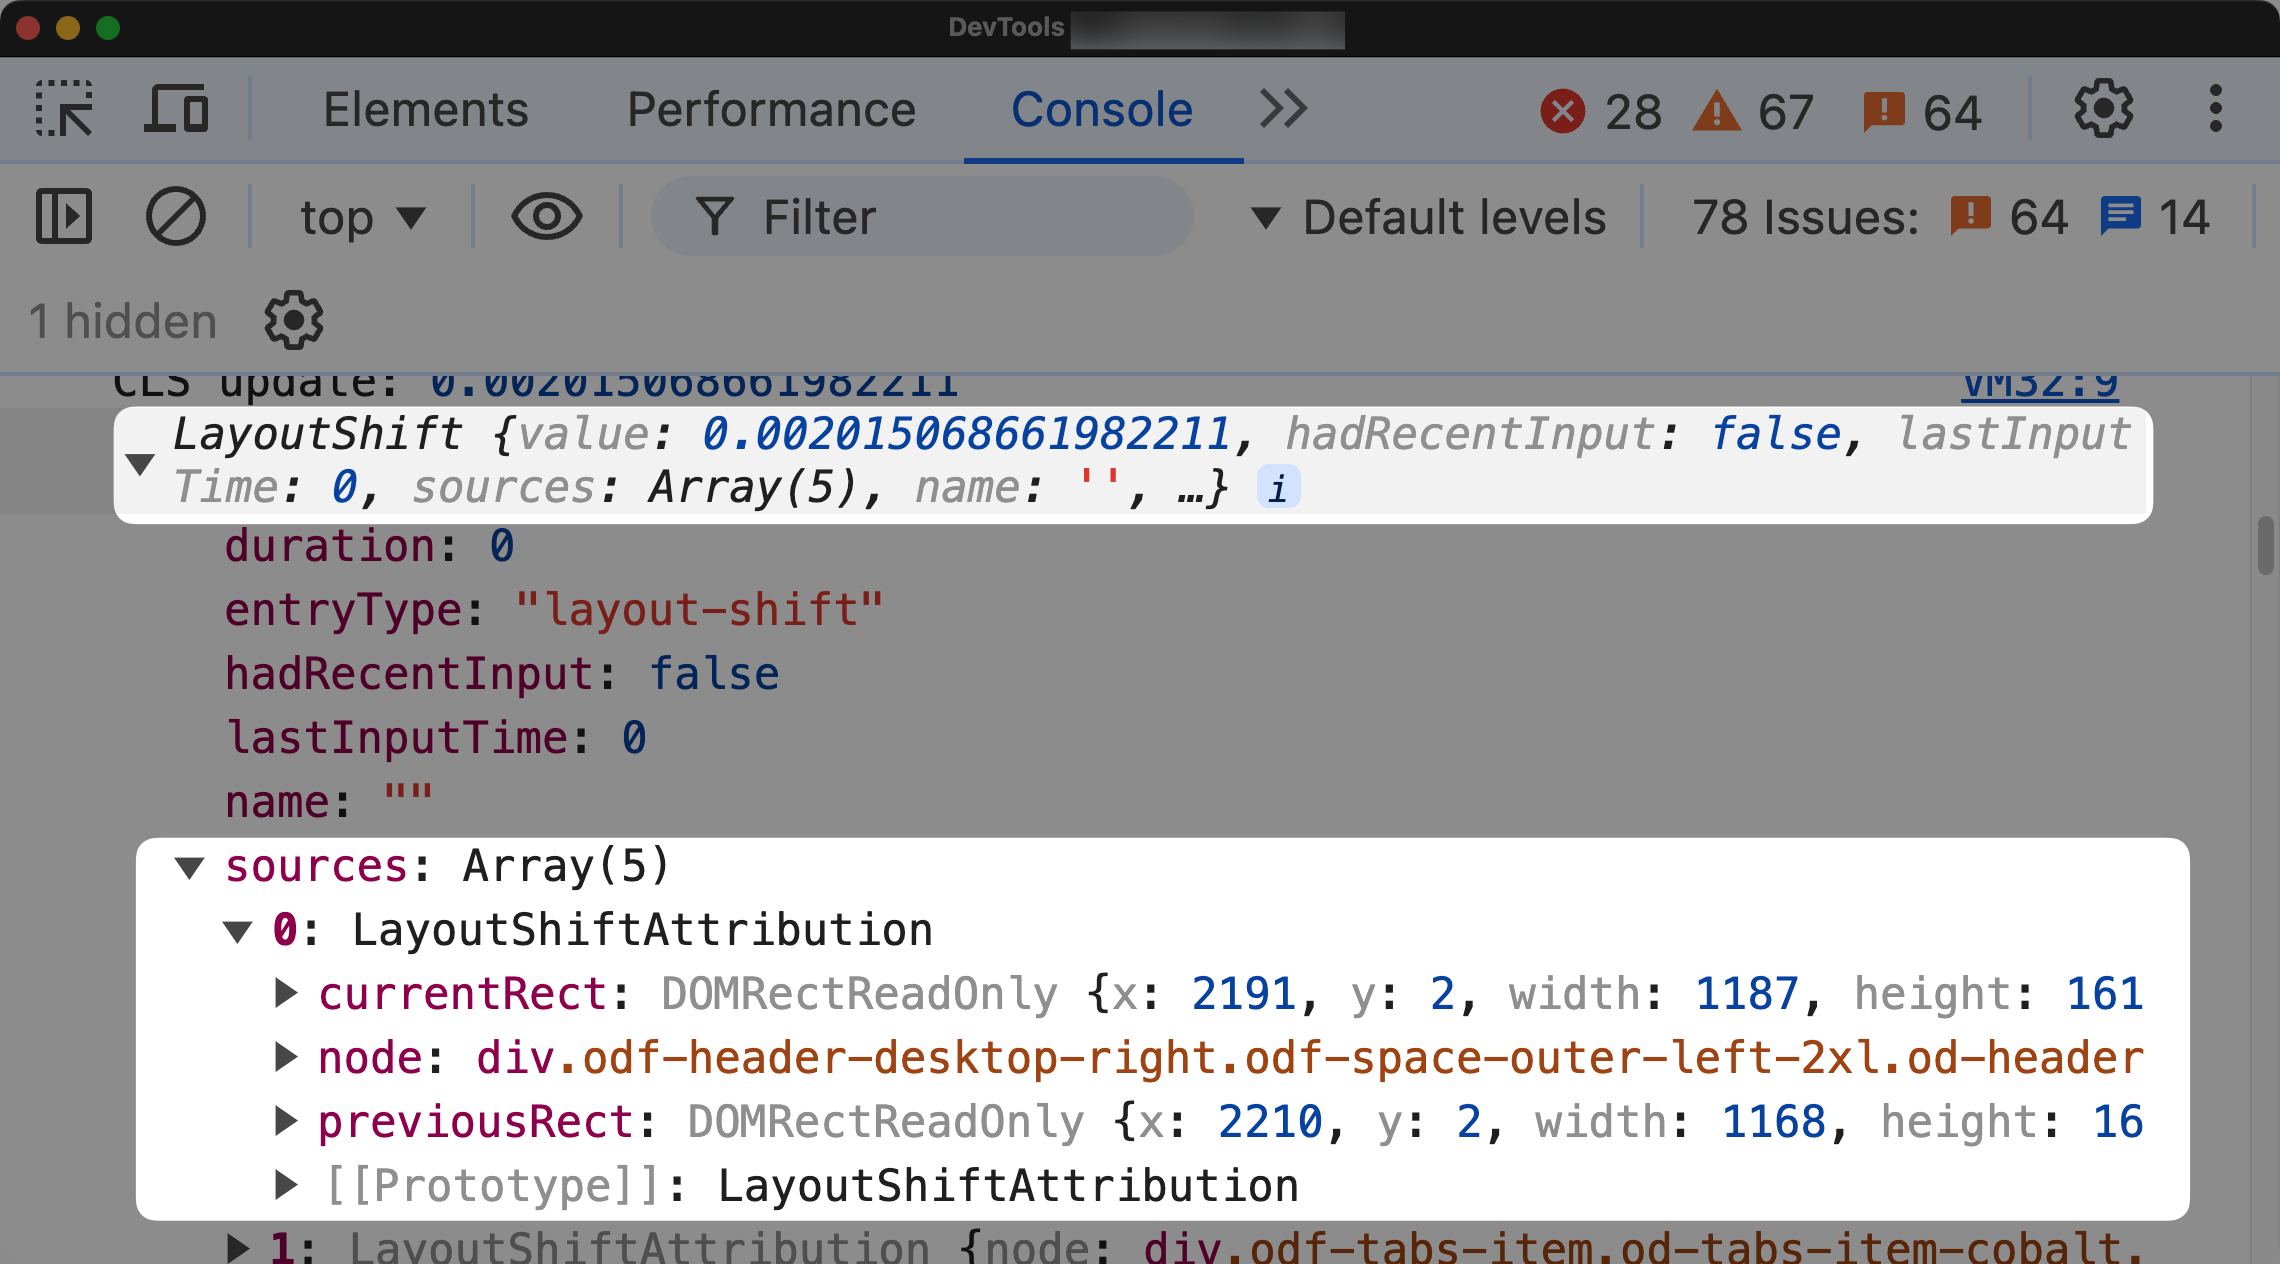
Collect Cumulative Layout Shift (CLS) data with Vanilla JavaScript
The Layout Instability API offers lots of useful insight into layout shifts. Here's the code to collect CLS data:
let cumulativeLayoutShift = 0;

new PerformanceObserver((entryList) => {
  for (const entry of entryList.getEntries()) {
    // Layout shifts that happen shortly after user input are not considered
    if (!entry.hadRecentInput) {
      cumulativeLayoutShift += entry.value;
    }
    console.log("CLS update:", entry.value, entry);
    // cumulativeLayoutShift offers the total CLS value
  }
}).observe({ type: "layout-shift", buffered: true });
A layout-shift item also offers attribution data which can help you identify the cause of the layout shift.
Collect Interaction to Next Paint (INP) data with Vanilla JavaScript
INP data comes from the Event Timing API which provides detailed information about events that happen on a webpage.
const observer = new PerformanceObserver((entryList) => {
  for (const entry of entryList.getEntries()) {
    const {
      processingStart,
      processingEnd,
      startTime,
      duration,
      name: eventType,
      target = "N/A",
    } = entry;

    const inputDelay = processingStart - startTime;
    const processingTime = processingEnd - processingStart;
    const presentationDelay = startTime + duration - processingEnd;

    console.log("Interaction", {
      inputDelay,
      processingTime,
      presentationDelay,
      duration,
      eventType,
      target,
    });
  }
});

observer.observe({ type: "event", buffered: true, durationThreshold: 16 });
This code shows data that looks like this:
{
  "inputDelay": 1.0999999940395355,
  "processingTime": 0,
  "presentationDelay": 22.900000005960464,
  "duration": 24,
  "eventType": "pointerenter",
  "target": "section#home.od-page.od_page.active"
}
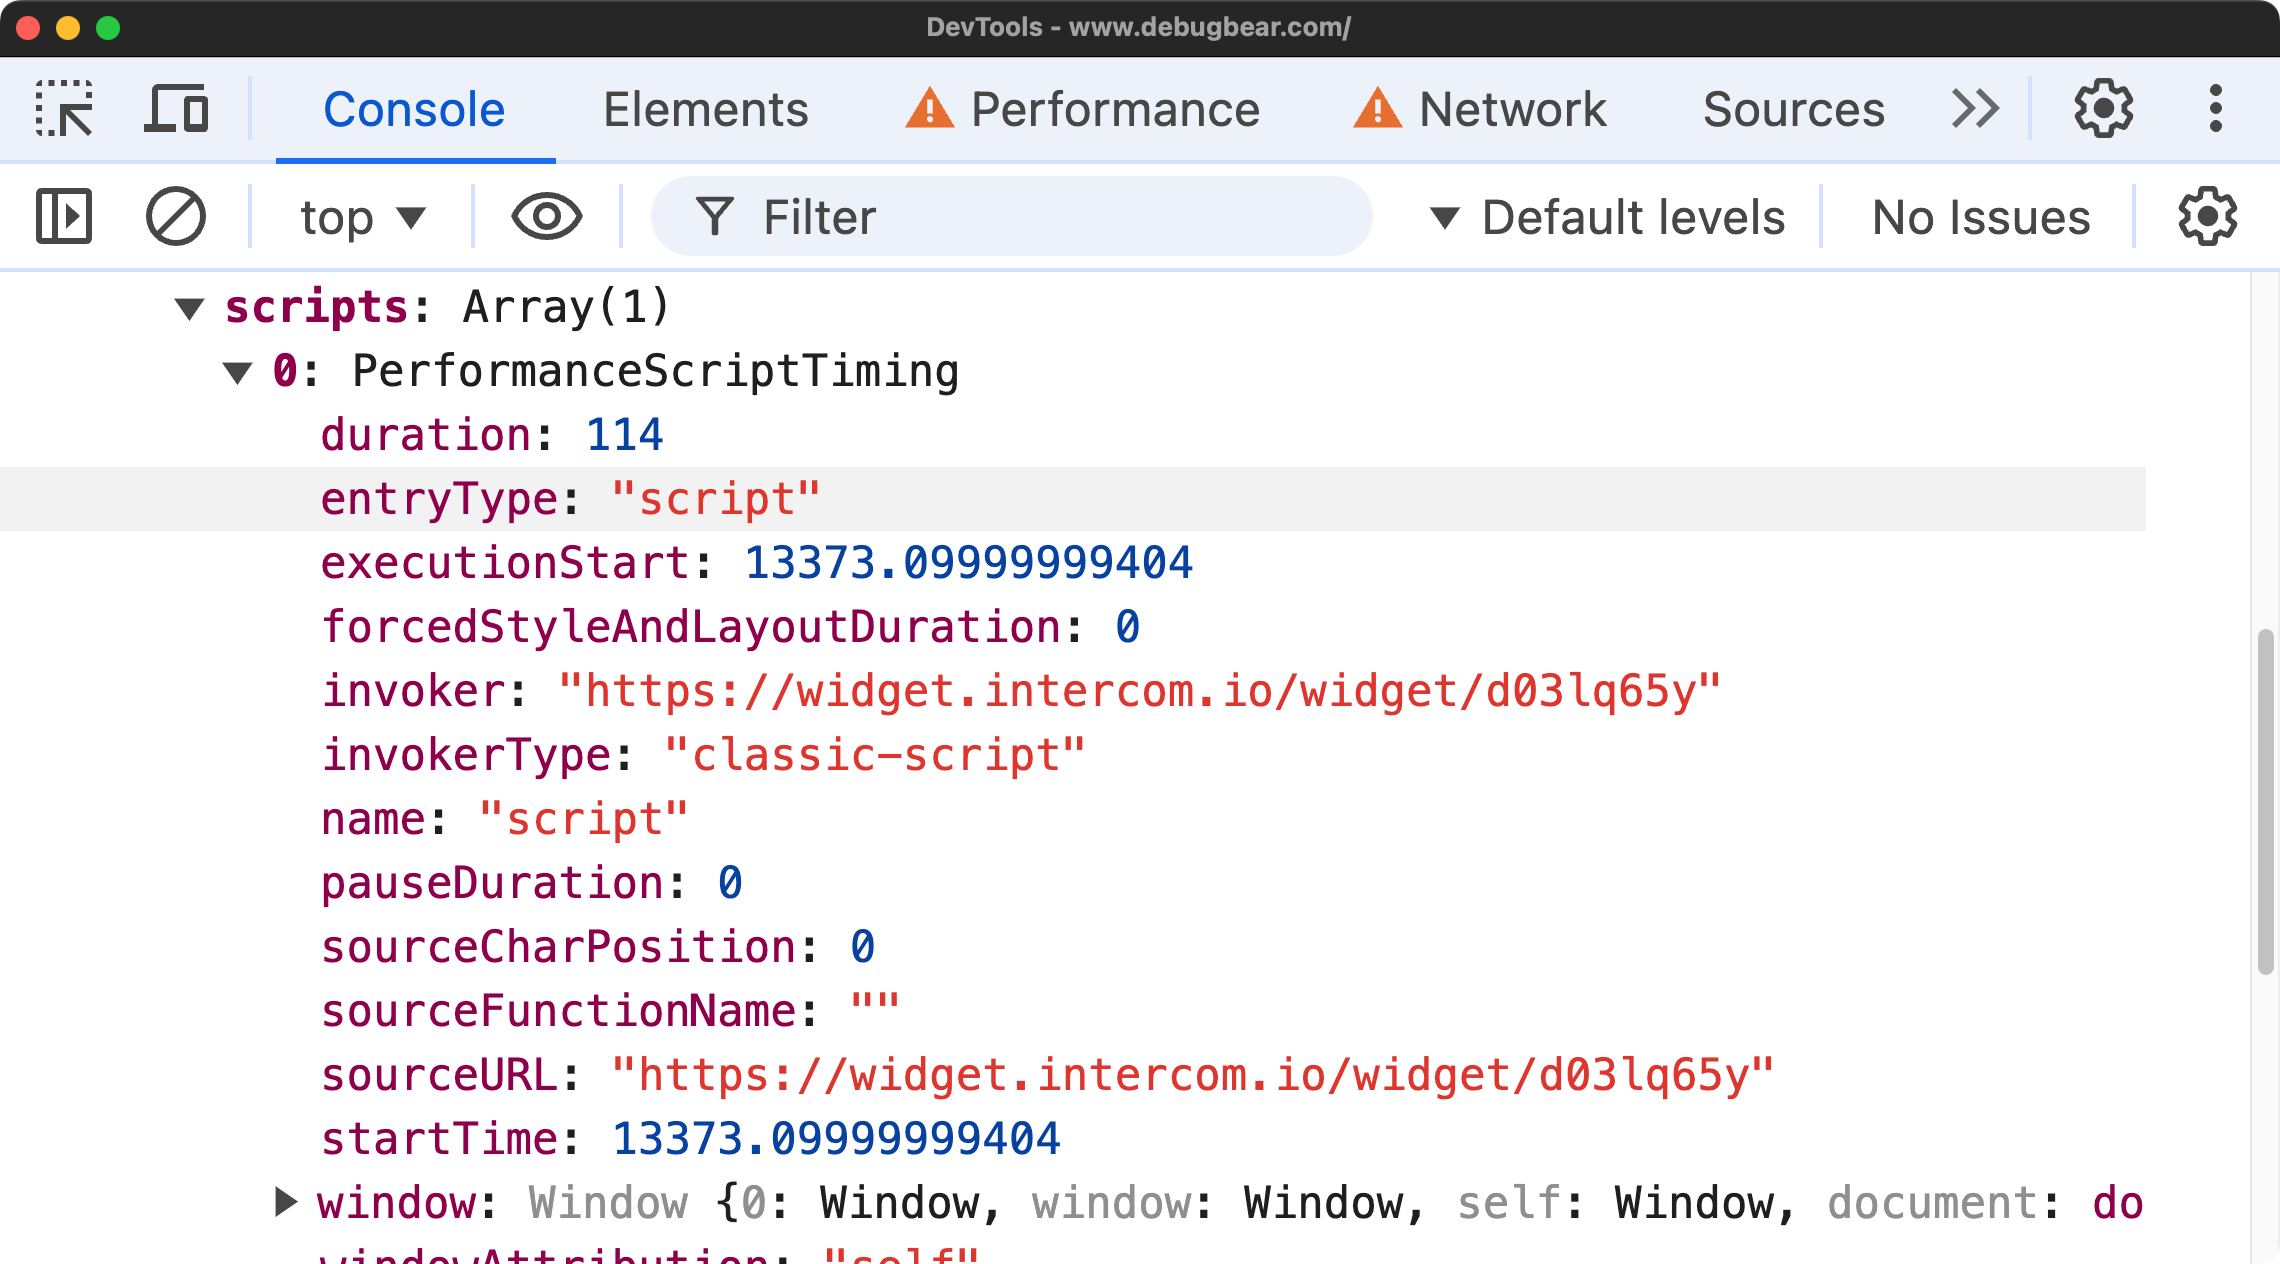
You can also use the Long Animation Frame API to gather additional performance data. This is especially useful as connecting slow interactions to long frames can help you identify specific performance bottlenecks in your code.
const observer = new PerformanceObserver((list) => {
  for (const entry of list.getEntries()) {
    console.log("LaF", entry.toJSON());
  }
});

observer.observe({ type: "long-animation-frame", buffered: true });
Where available, the long-animation-frame entry provides you with detailed information about the long frame, including the script that caused it.
At this point, you understand how to collect Web Vitals data using vanilla JavaScript. Let's move on to see how the official web-vitals library simplifies this process.
Collect Core Web Vitals with the web-vitals JavaScript Library
The official web-vitals library provides a more succinct way to collect Web Vitals data.
Here's how you can collect INP data, and then send that data to a server using the sendBeacon API:
onINP(({ name, value, rating }) => {
  const body = JSON.stringify({ name, value, rating });
  navigator.sendBeacon("/analytics", body);
});

/* Sends data that looks like this:

{
    "name": "INP",
    "value": 35,
    "rating": "good"
}
*/
There is some nuance with how and when INP, LCP, and CLS data is reported through the callbacks in this library. If you are following along with this code, and you don't see any data being reported straight after an interaction, try this:
- Perform your interaction.
- Go to another tab in your browser, and then return to the tab where you have the code running.
The INP should then be reported.
For brevity, we're only showing the INP metric here. You can use the same approach for LCP and CLS.
This method is more concise and easier to implement than the vanilla JavaScript approach.
If you need more fine grained control over the way the data is sent, you might want to use the fetch API instead of sendBeacon. However you should consider using the priority option with fetch to signal to the browser that this tracking data is not critical to the user experience:
await fetch('https://example.com/data', {priority: 'low'})
This can help the browser prioritize other critical network requests over the tracking data.
Use the web-vitals Library from a CDN or npm
You have two main options for including the web-vitals library in your project: installing it via npm or loading it from a CDN.
To install from npm:
npm install web-vitals
Then, import it in your code. Note that your build process will need to be able to resolve the node_modules directory:
import { onLCP, onINP, onCLS } from "web-vitals";
Alternatively, you can use a CDN:
import { onCLS, onINP, onLCP } from "https://unpkg.com/web-vitals@4?module";
Generally speaking, using web-vitals on your own CDN is recommended for production use. However, the public unpkg CDN is useful for quick testing and prototyping.
The reportAllChanges Flag in the web-vitals Library
The web-vitals library provides a reportAllChanges flag that can be useful for debugging purposes. Here's how you can use it:
onCLS(console.log, { reportAllChanges: true });
This flag causes the callback to be invoked every time the metric value changes, rather than just when it's ready to be reported. While this can be helpful during development and debugging, you generally won't need to use it in production.
In addition to the Core Web Vitals, the web-vitals library allows you to measure other useful metrics:
Access Time to First Byte (TTFB) with the web-vitals Library
TTFB is a measure of how long it takes for a user's browser to receive the first byte of page content. It's a good indicator of server responsiveness and network conditions:
This outputs useful information about TTFB, providing insights into the initial response time of your server.
onTTFB(console.log);
From the onTTFB callback, you can discover useful information like domInteractive, domComplete, and much more.
Access First Contentful Paint (FCP) with the web-vitals Library
FCP measures the time from when the page starts loading to when any part of the page's content is rendered on the screen:
onFCP(console.log);
You can use these metrics to complement the Core Web Vitals data, however you should be mindful that they are not part of the Core Web Vitals set of metrics.
Accessing Core Web Vitals Thresholds
A Core Web Vital metric can be rated as "good," "needs improvement," or "poor" based on specific threshold values.
The web-vitals library provides easy access to the threshold values; these can be useful when you need to perform custom calculations, comparisons, or even when you have specialized reporting requirements.
To access the thresholds, you can import them from the library:
import { CLSThresholds, INPThresholds, LCPThresholds } from "web-vitals";

console.log(CLSThresholds); // [ 0.1, 0.25 ]
console.log(INPThresholds); // [ 200, 500 ]
console.log(LCPThresholds); // [ 2500, 4000 ]
However, in most cases, you won't need to calculate the rating yourself. The library provides the rating directly in the callback:
onLCP(({ rating }) => {
  console.log(rating); // good
});
The web-vitals Attribution Build
One powerful feature of the web-vitals library is the attribution build, which provides additional data to help you debug why a particular metric might be performing poorly.
To use the attribution build, you need to change the import statement:
- import {onLCP, onINP, onCLS} from 'web-vitals';
+ import {onLCP, onINP, onCLS} from 'web-vitals/attribution';
Or if you're using a CDN:
<script type="module">
  import {
    onCLS,
    onINP,
    onLCP,
  } from "https://unpkg.com/web-vitals@4/dist/web-vitals.attribution.js?module";

  onCLS(console.log);
  onINP(console.log);
  onLCP(console.log);
</script>
You can then access the attribution data like this:
onLCP(({ name, value, attribution }) => {
  console.log({ name, value, attribution });
});
The attribution data provides detailed information about what might be causing performance issues. For example, for LCP, it might look like this:
{
  "element": "html>body>p",
  "timeToFirstByte": 6.5,
  "resourceLoadDelay": 0,
  "resourceLoadDuration": 0,
  "elementRenderDelay": 30.099999994039536,
  "navigationEntry": {
    // ... (navigation timing data)
  },
  "lcpEntry": {
    // ... (LCP-specific data)
  }
}
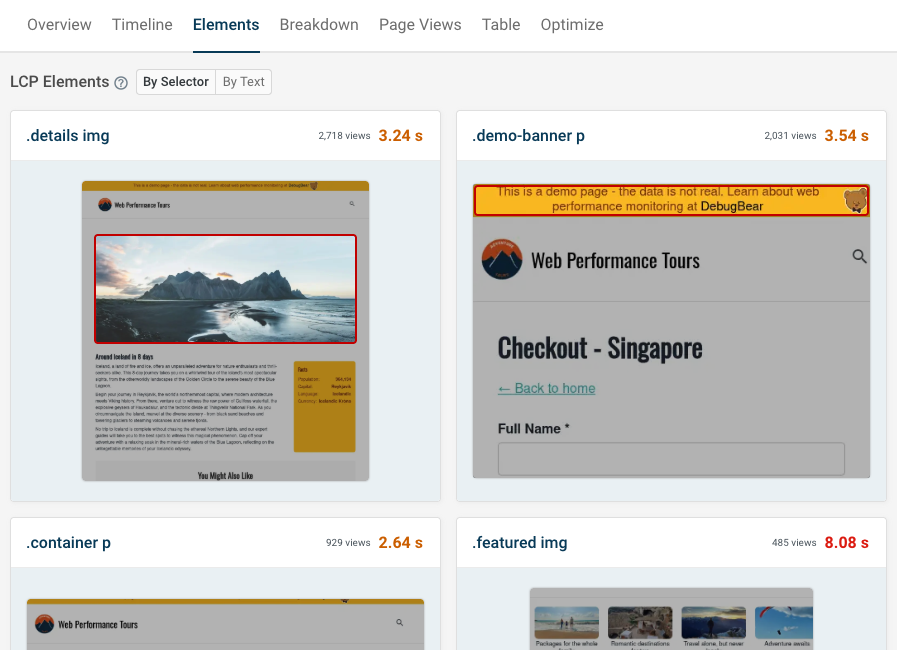
You can use such data to identify the specific element that's causing the LCP issue. For example, the .element property gives you the selector for the element that's causing the LCP issue.
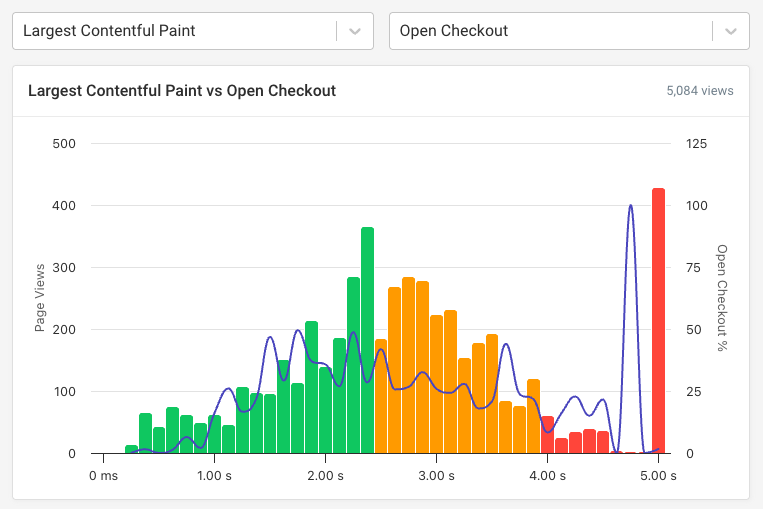
Attribution data can be stored and aggregated for further analysis. Consider the following chart that shows the most common LCP resources for a page or website:
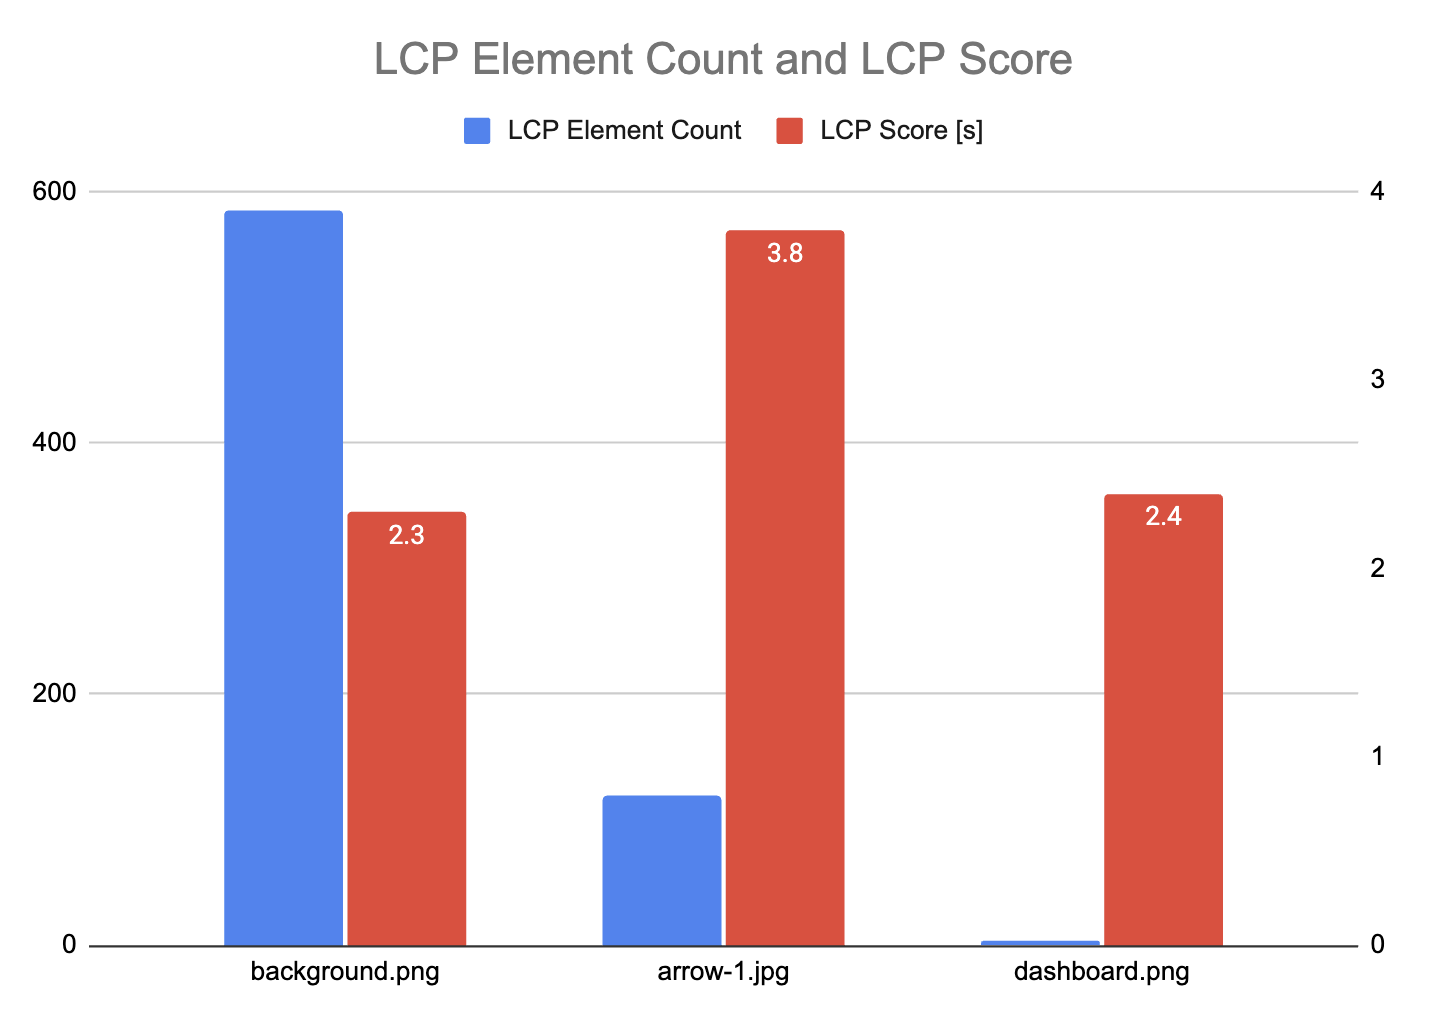
In this example, we can see background.png is the most common LCP image, but it has a good LCP score of 2.3 seconds. However, for many visitors arrow-1.jpg is the biggest content element, and here visitors wait 3.8 seconds for this content to show up. Therefore, to achieve a good LCP score for more of your users, you would look into ways to speed up the arrow-1.jpg image.
INP Attribution Example
Here's an example of how you can use attribution data to debug Interaction to Next Paint (INP) issues:
onINP(({ attribution }) => {
  console.log(attribution);
});
The attribution data looks like:
{
  "interactionTarget": "#sidebar-button",
  "interactionTargetElement": {}, // ... (DOM node for target element)
  "interactionType": "pointer",
  "interactionTime": 2951.5,
  "nextPaintTime": 3175.5,
  "processedEventEntries": [
    // ... (individual event entries)
  ],
  "longAnimationFrameEntries": [
    {
      // ... (long-animation-frame entries)
    }
  ],
  "inputDelay": 2.800000011920929,
  "processingDuration": 199.7999999821186,
  "presentationDelay": 21.400000005960464,
  "loadState": "complete"
}
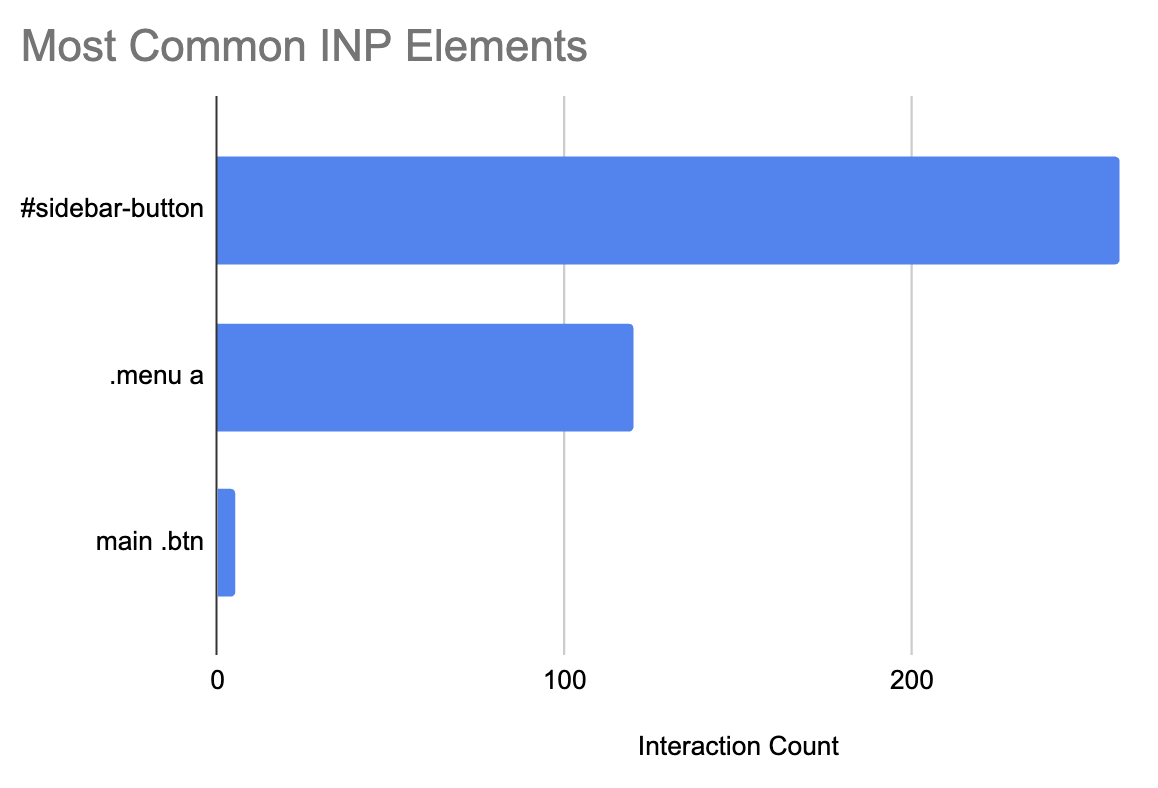
In the previous example, take note of the .interactionTarget property, which gives you the selector for the element that was interacted with. To optimize INP you need to know what elements are causing slow INP interactions, and real user data with web-vitals.js can give you this information.
The .longAnimationFrameEntries property provides more detail about long running scripts that might be causing the INP issue.
onINP(({ attribution }) => {
  const loaf = attribution.longAnimationFrameEntries.at(0);
  const script = loaf?.scripts.sort((a, b) => b.duration - a.duration).at(0);

  if (script) {
    console.log(script);
  }
});
Where available, this code outputs information about the longest-running script during an interaction, which could be causing poor INP scores:
{
  "name": "script",
  "entryType": "script",
  "startTime": 751,
  "duration": 199,
  "invoker": "BUTTON#menu.onclick",
  "invokerType": "event-listener",
  "windowAttribution": "self",
  "executionStart": 751,
  "forcedStyleAndLayoutDuration": 0,
  "pauseDuration": 0,
  "sourceURL": "https://example.com/main.js",
  "sourceFunctionName": "clickHandler",
  "sourceCharPosition": 139
}
There's a wealth of information in the attribution data, for example the sourceURL offers an insight into the script that's causing the INP issue.
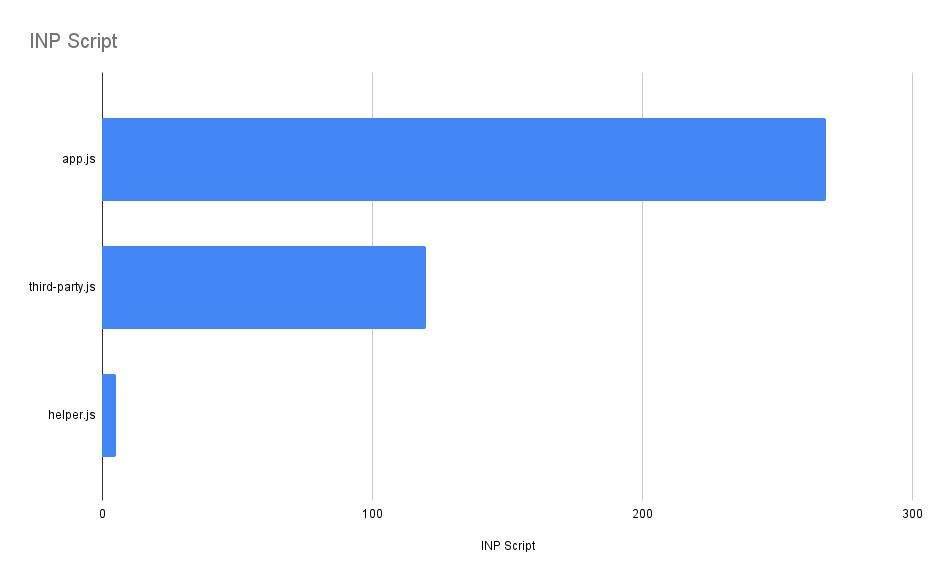
The previous chart shows that main.js and third-party.js are potential contributors to a poor INP score - and this offers a starting point for debugging and optimizing the scripts.
For more detailed information on attribution for each metric, you can refer to the official documentation:
At this point, you have an understanding of how to use the attribution build to gain deeper insights into your performance metrics.
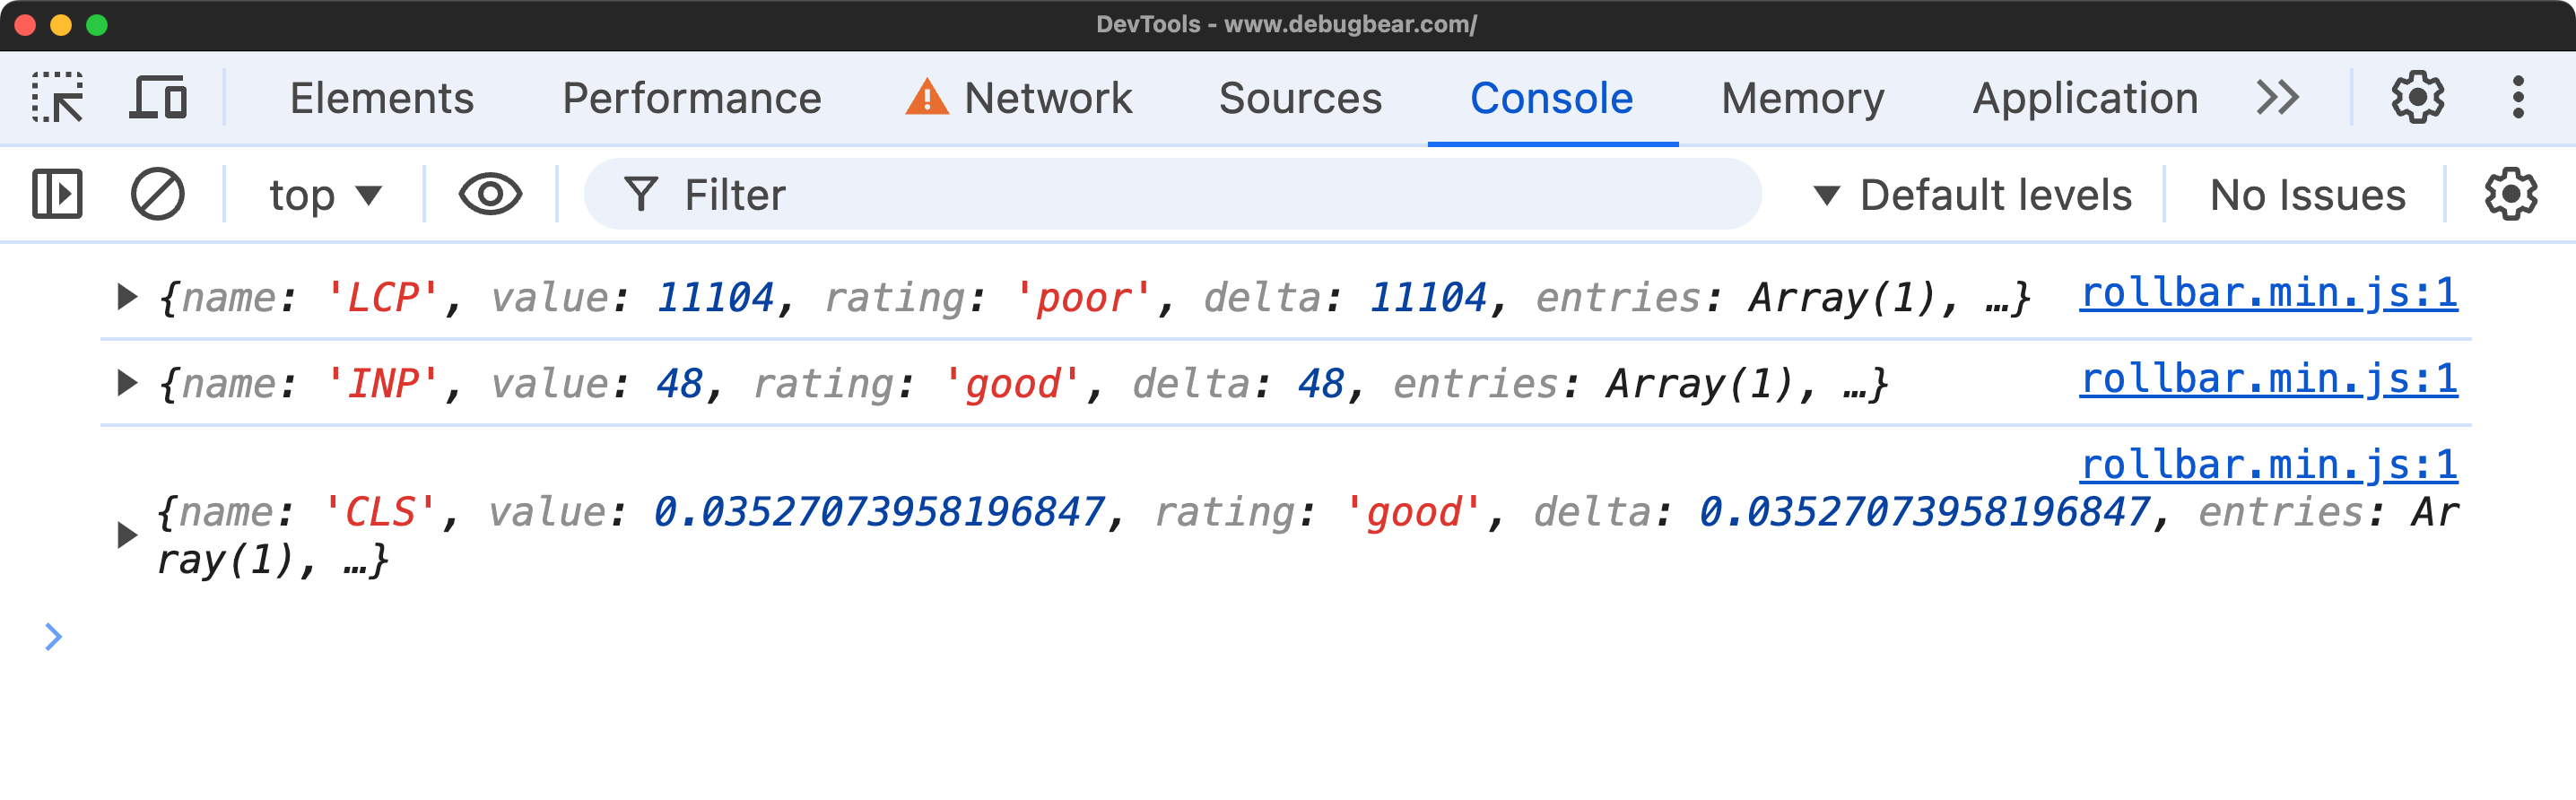
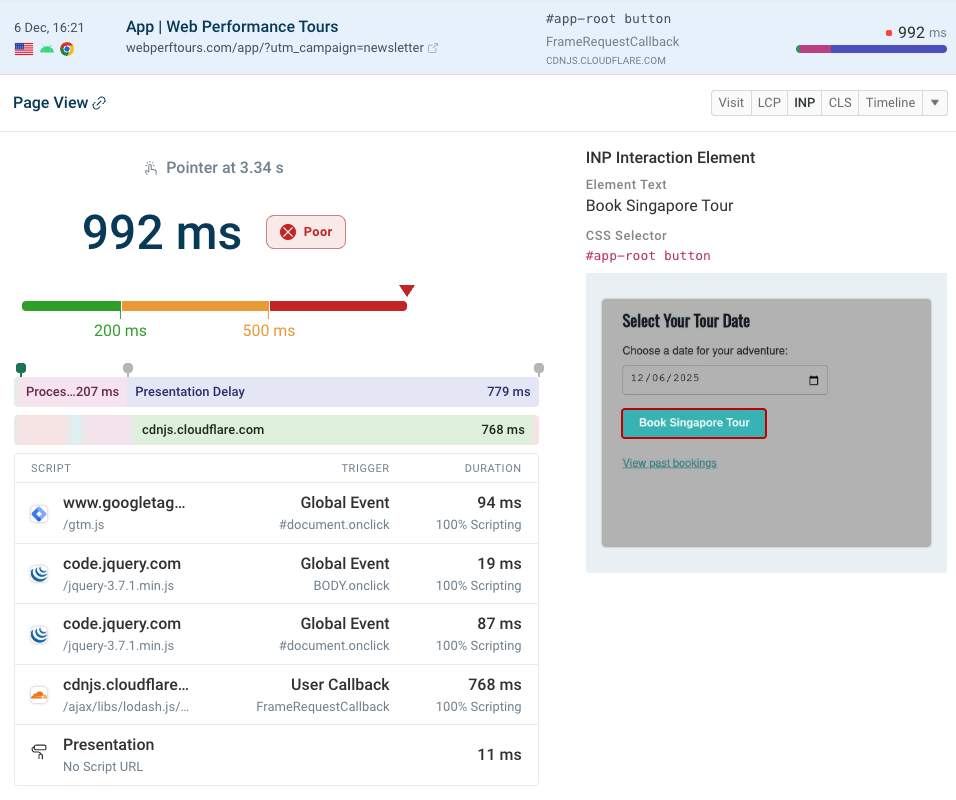
DebugBear's RUM product tracks detailed attribution data for the Core Web Vitals metrics.
Here's an example showing a page view with a poor INP score. You can see what element the user interacted with and what scripts ran during the interaction.
Browser Support for the web-vitals Library
Here is the browser support for the Core Web Vitals metrics using the web-vitals library:
| Metric | Browser Support |
|---|---|
| LCP | Chromium, Firefox, Safari |
| INP | Chromium, Firefox, Safari |
| CLS | Chromium |
| TTFB | Chromium, Firefox, Safari |
| FCP | Chromium, Firefox, Safari |
If you register a callback for a metric that is not supported in a particular browser, the callback will not be invoked. This means you can safely use the web-vitals library without worrying about breaking your site in unsupported browsers.
LCP and INP were added to Safari in late 2025.
Processing web vitals metrics data on the backend
While the web-vitals.js library makes it easy to collect performance data on the front-end, you'll still need to find a way to process this data on the backend. You might want to store the data, set up alerts for slow page views, and build dashboards for reporting aggregate user experience data.
Send Core Web Vitals Data to an Express Server
You've seen how to collect Web Vitals data, but how do you send that data to a server? This section, and the following sections, discuss some options.
For these examples, assume you collect, and send data like this:
onLCP(({ name, value, rating }) => {
  const body = JSON.stringify({ name, value, rating });
  navigator.sendBeacon("/api", body);
});
The code shown in the previous snippets sends a request body payload, via the sendBeacon API, that looks like this:
{
  "name": "LCP",
  "value": 26.19999998807907,
  "rating": "good"
}
To handle this data on an Express server, you can do something like this:
import express from "express";
import bodyParser from "body-parser";

const app = express();
const port = 3000;

app.use(bodyParser.raw({ type: "*/*" }));

app.post("/api", (req, res) => {
  const bodyString = req.body.toString("utf-8");
  const jsonData = JSON.parse(bodyString);
  console.log(jsonData);
  // At this point, you can process and save the data in a database

  res.status(200).send("Data received successfully");
});

app.listen(port, () => {
  console.log(`Server listening at http://localhost:${port}`);
});
You may be wondering, shouldn't a JSON parser be used? Why is the incoming body parsed like this: bodyParser.raw({ type: "*/*" })?
By default, sendBeacon sends data with a Content-Type of text/plain;charset=UTF-8. This means that the body is sent as a raw string, not as JSON.
If you're comfortable with deploying Node.js code onto a server, you can use this approach to collect real user data right now. But you should continue reading this post to understand other considerations when collecting Web Vitals data.
Send Core Web Vitals Data to a Vercel Serverless Function
If you're using Vercel for hosting, you can use their serverless functions to handle the incoming data:
export async function POST(request) {
  const bodyString = await request.text();
  const jsonData = JSON.parse(bodyString);
  console.log("Received data:", jsonData);
  return new Response("Data received successfully", { status: 200 });
}
Vercel also provides storage options that you can use to store the data. Using Vercel, or another serverless provider, can be great for automatically scaling to handle large amounts of data. However you should also be aware of the costs associated with serverless functions.
Send Core Web Vitals Data to Google Analytics
You can also send Web Vitals data directly to Google Analytics. Here's an example of how to do this:
function sendToGoogleAnalytics({ name, delta, id }) {
  gtag("event", name, {
    event_category: "Web Vitals",
    value: Math.round(name === "CLS" ? delta * 1000 : delta),
    event_label: id,
    non_interaction: true,
  });
}

onCLS(sendToGoogleAnalytics);
onINP(sendToGoogleAnalytics);
onLCP(sendToGoogleAnalytics);
You might notice the previous code snippet takes in an id and delta parameter. This highlights the scenario where a metric might be reported multiple times with different values. The id parameter can be used to uniquely identify the metric for that page view, while the delta parameter can be used to compute the total value of the metric.
Note that the official documentation has the most up to date information on how to send Web Vitals data to Google Analytics.
Send Web Vitals Data to Cloudflare Workers and Get Email Alerts
Cloudflare Workers provides a powerful platform for processing and storing Web Vitals data at the edge.
This example shows how to use Cloudflare Workers to:
- Receive Core Web Vitals data (with Hono)
- Store the data in Cloudflare KV (for demonstration purposes only)
- Send an email alert if the data indicates poor performance
The architecture of this system is as follows:
Here's an example of the code. Note, if you're trying this yourself, you should follow the Cloudflare Workers guide.
import { Hono } from "hono";
import { EmailMessage } from "cloudflare:email";
import { createMimeMessage } from "mimetext";

// This function sends an email from within a Cloudflare Worker
async function sendEmail(env, data) {
  const msg = createMimeMessage();
  msg.setSender({ name: "Alert Warning", addr: "alerts@company.com" });
  msg.setRecipient("web-team@company.com");
  msg.setSubject("CWV Alert");
  msg.addMessage({
    contentType: "text/plain",
    data: `A poor CWV rating was received. Please investigate: ${data}`,
  });

  var message = new EmailMessage(
    "alerts@company.com",
    "web-team@company.com",
    msg.asRaw(),
  );

  // `emailer` is a Worker binding
  await env.emailer.send(message);
}

// Hono is similar to Express
const app = new Hono();

app.post("/api", async (context) => {
  const data = await context.req.json();
  // `KVStore` is a Worker binding
  const rawLCPRatings = await context.env.KVStore.get("LCP");
  const currentLCPRatings = rawLCPRatings ? JSON.parse(rawLCPRatings) : [];

  // Append the new rating to the existing ratings
  const updatedLCPRatings = JSON.stringify([...currentLCPRatings, data.rating]);
  await context.env.KVStore.put("LCP", updatedLCPRatings);

  // If the Core Web Vitals rating is poor, send an email
  if (data.rating === "poor") {
    await sendEmail(context.env, data);
  }

  return context.text(`Data received`);
});

export default app;
Important disclaimers:
As a thought exercise, you can imagine that the schema of the data suggested by the previous code might look like this:
| Metric | Rating |
|---|---|
| LCP | ["good", "good"] |
| INP | ["good", "good", "poor"] |
| CLS | ["good", "needs improvement"] |
Which is not production-grade, and is used for educational purposes only. In the real-world, you'd likely want to store page view data, timestamps, and other relevant information - including the Core Web Vital metric data.
- This is not production-grade code and should be adapted and tested thoroughly before use in a real-world scenario.
- Storing data in this way (appending to a JSON string in KV) is not scalable for large amounts of data and would make data difficult to query.
- Sending an email for each poor rating could lead to excessive notifications. A better approach would be to aggregate data and send summary reports at regular intervals.
Other options for storing and processing Web Vitals data with Cloudflare include:
- Using Cloudflare D1 database for more structured and scalable data storage
- Using Cloudflare Analytics Engine for built-in analytics capabilities
What You Learned About the web-vitals Library
In this guide, you explored the web-vitals library:
- The basics of Core Web Vitals and how to measure them
- Collecting Web Vitals data using both vanilla JavaScript and the official library
- Using the library from npm or a CDN
- Accessing and interpreting Core Web Vitals thresholds
- Using the attribution build for deeper performance insights
- Sending Web Vitals data to various server types and analytics platforms
DebugBear offers a comprehensive Real User Monitoring solution:
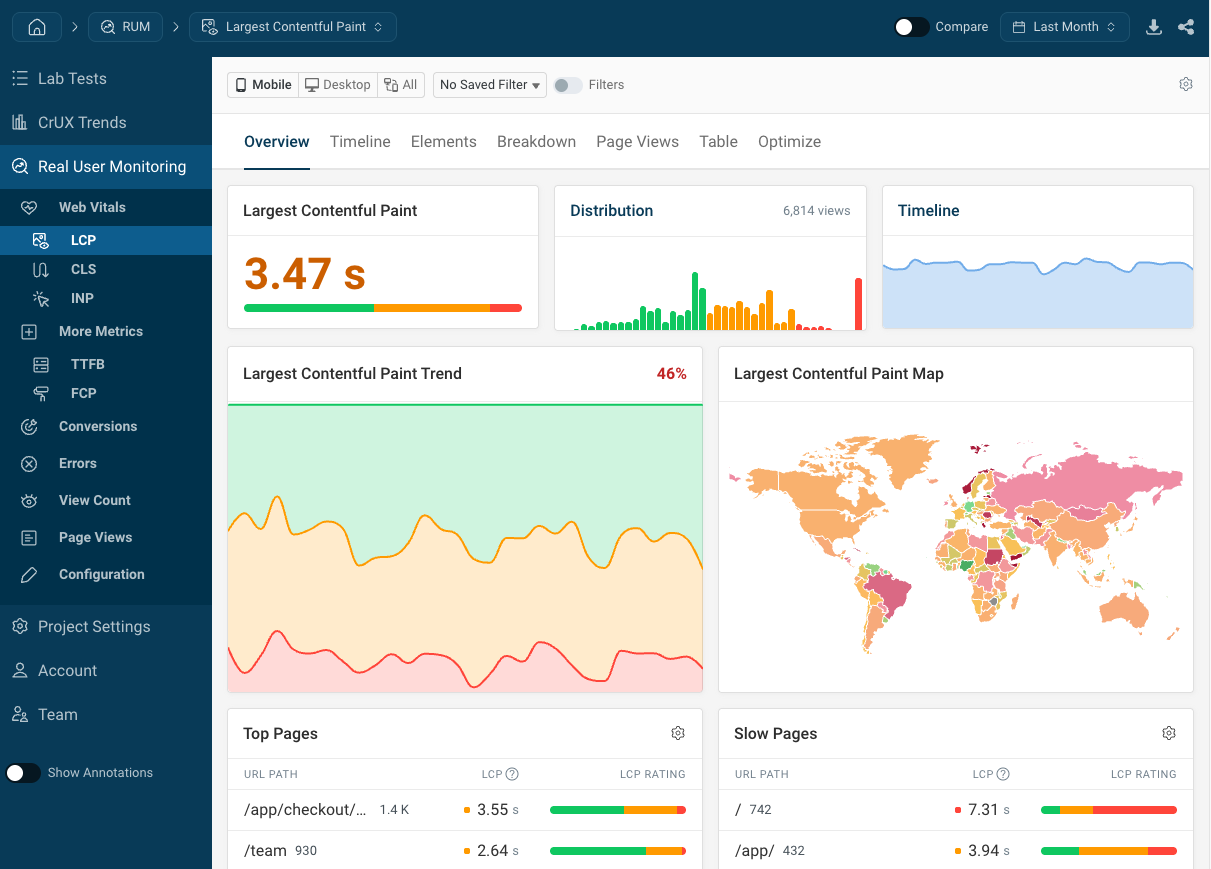
For example, the INP Elements feature gives you a visual breakdown of what elements are affecting your users most.
Considerations for Building Your Own Performance Monitoring System
If you roll your own solution, you'll need to consider a number of factors.
Core Web Vitals and Performance Collection Techniques Change Over Time
Can you keep up to date with how Core Web Vitals, and performance collection techniques, evolve? In fact, just this year, Google deprecated a Core Web Vital metric (First Input Delay) and replaced it with Interaction to Next Paint. Before this change, DebugBear had updated its RUM library, RUM dashboards, documentation and educational content to reflect the new metric.
The DebugBear product evolves constantly, and we publish regular updates to our changelog to keep you informed.
Collecting Core Web Vitals Data Is Not Always Reliable
When using the web-vitals library in a custom solution, you might encounter issues with data reliability. For example, a user can navigate away from a page before the metric is ready to be reported. Or the same metric can be reported multiple times with different values.
DebugBear offers a reliable tracking solution that:
- Keeps a consistent record of page views.
- Prevents duplicate reporting.
- Ensures all data is collected all the way until the page is closed.
Self Hosted Real User Monitoring Can Be Expensive
It's easy to get hit with unexpected costs when deploying a serverless function that receives thousands, or even millions, of requests.
With DebugBear, you can pay a predictable monthly fee and avoid any surprises.
Custom Real User Monitoring Requires Scalable Infrastructure
You might instead host your own RUM server, but can your server handle an influx of data? Remember that one single page view can generate a barrage of network requests to your server endpoint.
DebugBear's RUM solution can handle hundreds of millions of page views per month.
Debugging and Analyzing Performance Data Can Be Complex
Collecting data and storing it in a database is not enough. You and your company need to view, analyze, query, and act on the data.
DebugBear provides a powerful dashboard that makes it easy to understand your performance data.
Ad Blockers Can Block Custom Tracking Scripts
Once Ad blockers catch onto your custom tracking script, they might block it.
DebugBear offers a RUM proxy that lets you collect data without worrying about ad blockers. You proxy the data through DebugBear's servers, but never have to worry about the complexity of using your own infrastructure.
Your Team May Need Training on Web Performance
You've finally collected data, set up the infrastructure, and built a dashboard. But now you have to train your team on how to use it and teach them to understand what web performance metrics mean.
DebugBear provides a unique optimization wizard that takes you through your data, while performing behind-the-scenes analysis. The wizard provides actionable insights and recommendations to improve your site's performance.
DebugBear also offers a comprehensive web performance education platform, with tutorials, product documentation, videos, and active social media channels. Our educational content has also been featured on MSN, SearchEngineJournal, SmashingMagazine, CSS Tricks and more.
Your Team May Have Issues with Your Custom Solution
Depending on the size of your company, you may need to convince stakeholders, decision-makers, and other teams of your performance monitoring solution. For example, are DevOps on board with the infrastructure and security implications of your solution?
DebugBear offers a battle-tested solution that's trusted by companies all around the world.
Monitor real user web vitals with DebugBear
DebugBear offers a comprehensive Real User Monitoring solution that addresses all of these concerns. You can collect, store, analyze, and act on your performance data without worrying about infrastructure, costs, or privacy implications.


Monitor Page Speed & Core Web Vitals
DebugBear monitoring includes:
- In-depth Page Speed Reports
- Automated Recommendations
- Real User Analytics Data