
Web performance is important for user experience and SEO. While manually running a PageSpeed Insights test is useful, integrating performance data into your workflows can help your optimization efforts. Enter the PageSpeed Insights API.
In this guide, you'll learn how to use the PageSpeed Insights API to automate performance analysis of your websites or web pages.
What is PageSpeed Insights?
Before diving into the API, you should know that PageSpeed Insights (PSI) offers:
- Lab data: Simulated performance metrics from Lighthouse.
- Field data: Real-user metrics from the Chrome User Experience Report (CrUX).
- Performance scores and improvement suggestions.
PSI currently provides both real-world performance data and lab data for your web pages.
Google will be discontinuing real-world data from the Chrome User Experience Report in this PageSpeed Insights API.
To get reliable CrUX data, use the CrUX History API.
Why use the PageSpeed Insights API?
The PSI API lets you programmatically access the data available in the PageSpeed Insights web interface. Here are some compelling use cases:
- Automated testing: Integrate performance checks into your CI/CD pipeline.
- Bulk analysis: Test multiple websites or pages at once, and compare performance between them.
- Custom dashboards: Build performance monitoring tools tailored to your needs.
- Data analysis: Aggregate and analyze performance trends over time.
- Alerts: Set up notifications for performance regressions.
By using the API, you can make performance optimization a part of your development and monitoring processes.
The PageSpeed Insights API reference is available here, and currently offers one endpoint.
/runPagespeed: Runs PageSpeed analysis on the page at the specified URL, and returns PageSpeed scores, a list of suggestions to make that page faster, and other information.
If you'd like a managed service to track your page speed, try DebugBear Core Web Vitals monitoring.
Get a PageSpeed Insights API key
While you can make limited requests without authentication, obtaining an API key is recommended for higher quotas and more reliable access.
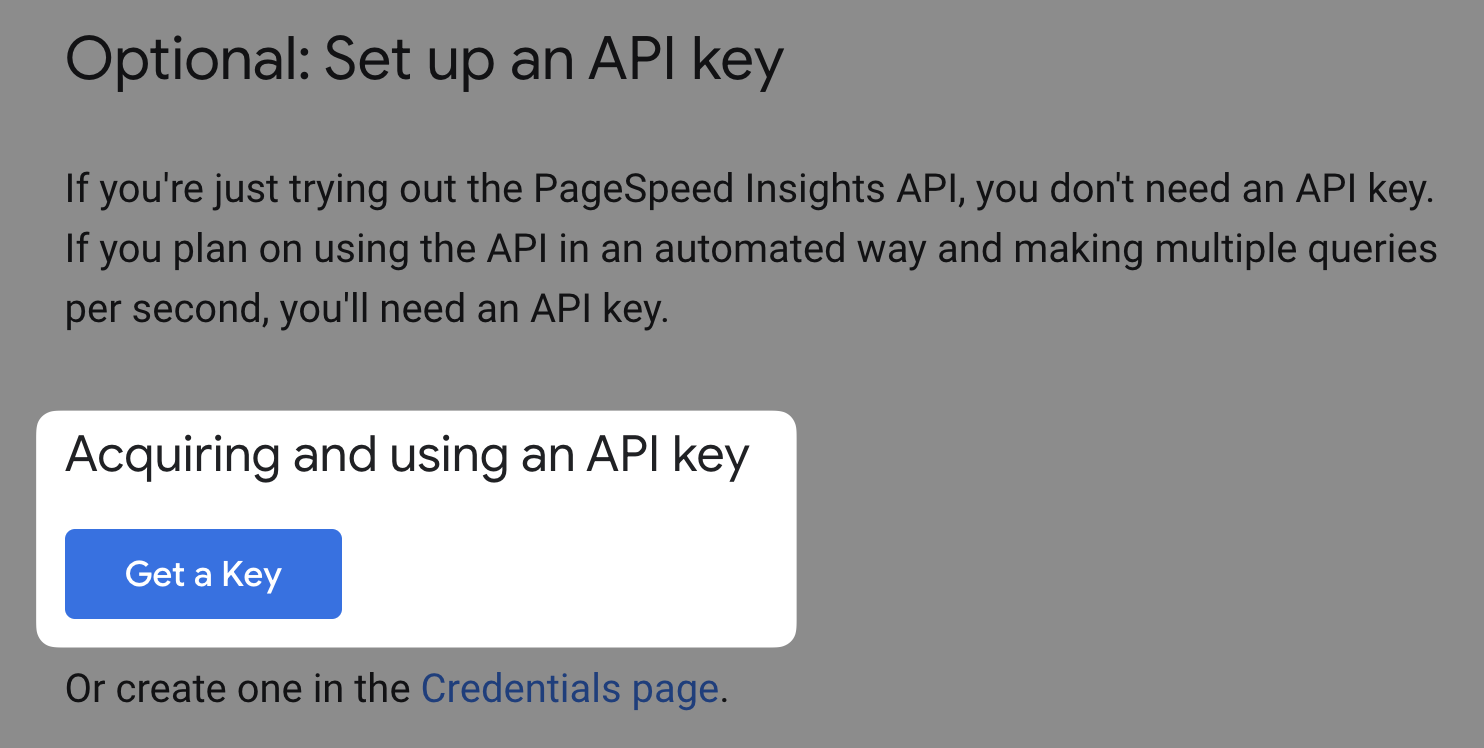
- Visit the Get Started with the PageSpeed Insights API page.
- Select Get a Key from the Acquiring and using an API key section.
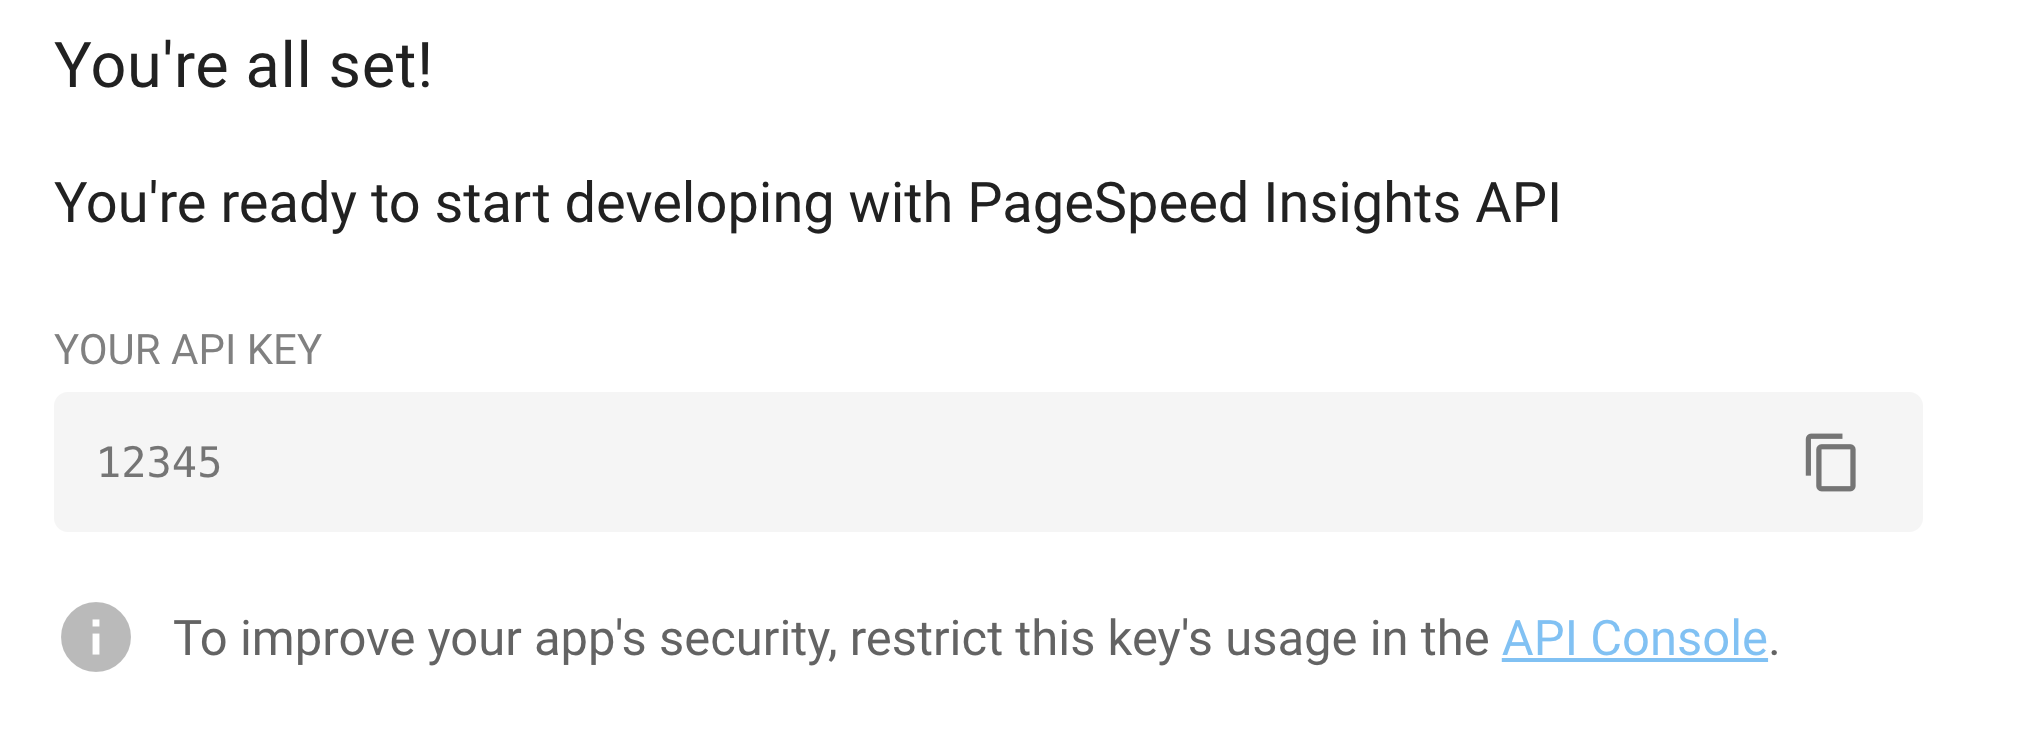
- Create a new project, or select an existing project and select Next.
- Copy the generated API key and store it securely.
Make a PageSpeed Insights API Request from your Terminal
Let's start with a simple cURL request to test the API:
- Run this in your terminal:
macOS:
curl "https://www.googleapis.com/pagespeedonline/v5/runPagespeed?url=https://developers.google.com" | pbcopy
Unix/Linux:
curl "https://www.googleapis.com/pagespeedonline/v5/runPagespeed?url=https://developers.google.com"
- If you used the macOS command, paste your clipboard contents into a preferred JSON viewer, for example:
-
Your code editor.
-
An online JSON viewer.
Otherwise, the JSON response is displayed directly in your terminal.
curl "https://www.googleapis.com/pagespeedonline/v5/runPagespeed?url=https://developers.google.com" - without the | pbcopy part, will output the JSON response directly in the terminal. The JSON output is so large however, that it can be difficult to read.
That's why we recommend piping the output to pbcopy on macOS, which copies the output to your clipboard.
This will return a JSON response with all the PSI data for the specified URL.
Note that we are not using an API key in this example, but for production use, you should include your key in the request:
curl https://www.googleapis.com/pagespeedonline/v5/runPagespeed?url=https://developers.google.com&key=yourAPIKey
Understanding the PageSpeed Insights API Response
The API response is packed with valuable information. Here's a breakdown of key sections:
- loadingExperience: Field data (CrUX) for the specific URL.
- originLoadingExperience: Field data for the entire origin.
- lighthouseResult: Lab data and Lighthouse audit results.
The JSON structure for the field data metrics looks like this (data.originLoadingExperience.metrics):
{
  "CUMULATIVE_LAYOUT_SHIFT_SCORE": {
    "percentile": 20,
    "distributions": [...],
    "category": "AVERAGE"
  },
  "INTERACTION_TO_NEXT_PAINT": {
    "percentile": 81,
    "distributions": [...],
    "category": "FAST"
  },
  "LARGEST_CONTENTFUL_PAINT_MS": {
    "percentile": 2353,
    "distributions": [...],
    "category": "FAST"
  },
  "EXPERIMENTAL_TIME_TO_FIRST_BYTE": {...},
  "FIRST_CONTENTFUL_PAINT_MS": {...},
  "FIRST_INPUT_DELAY_MS": {...}
}
If you are interested in learning about the exact structure of the response, you can check out Google's official API reference for the runPagespeed endpoint.
Be sure to have a look at the Request Parameters which explains how to customize:
- The device type.
- The Lighthouse categories to run.
- Other optional parameters.
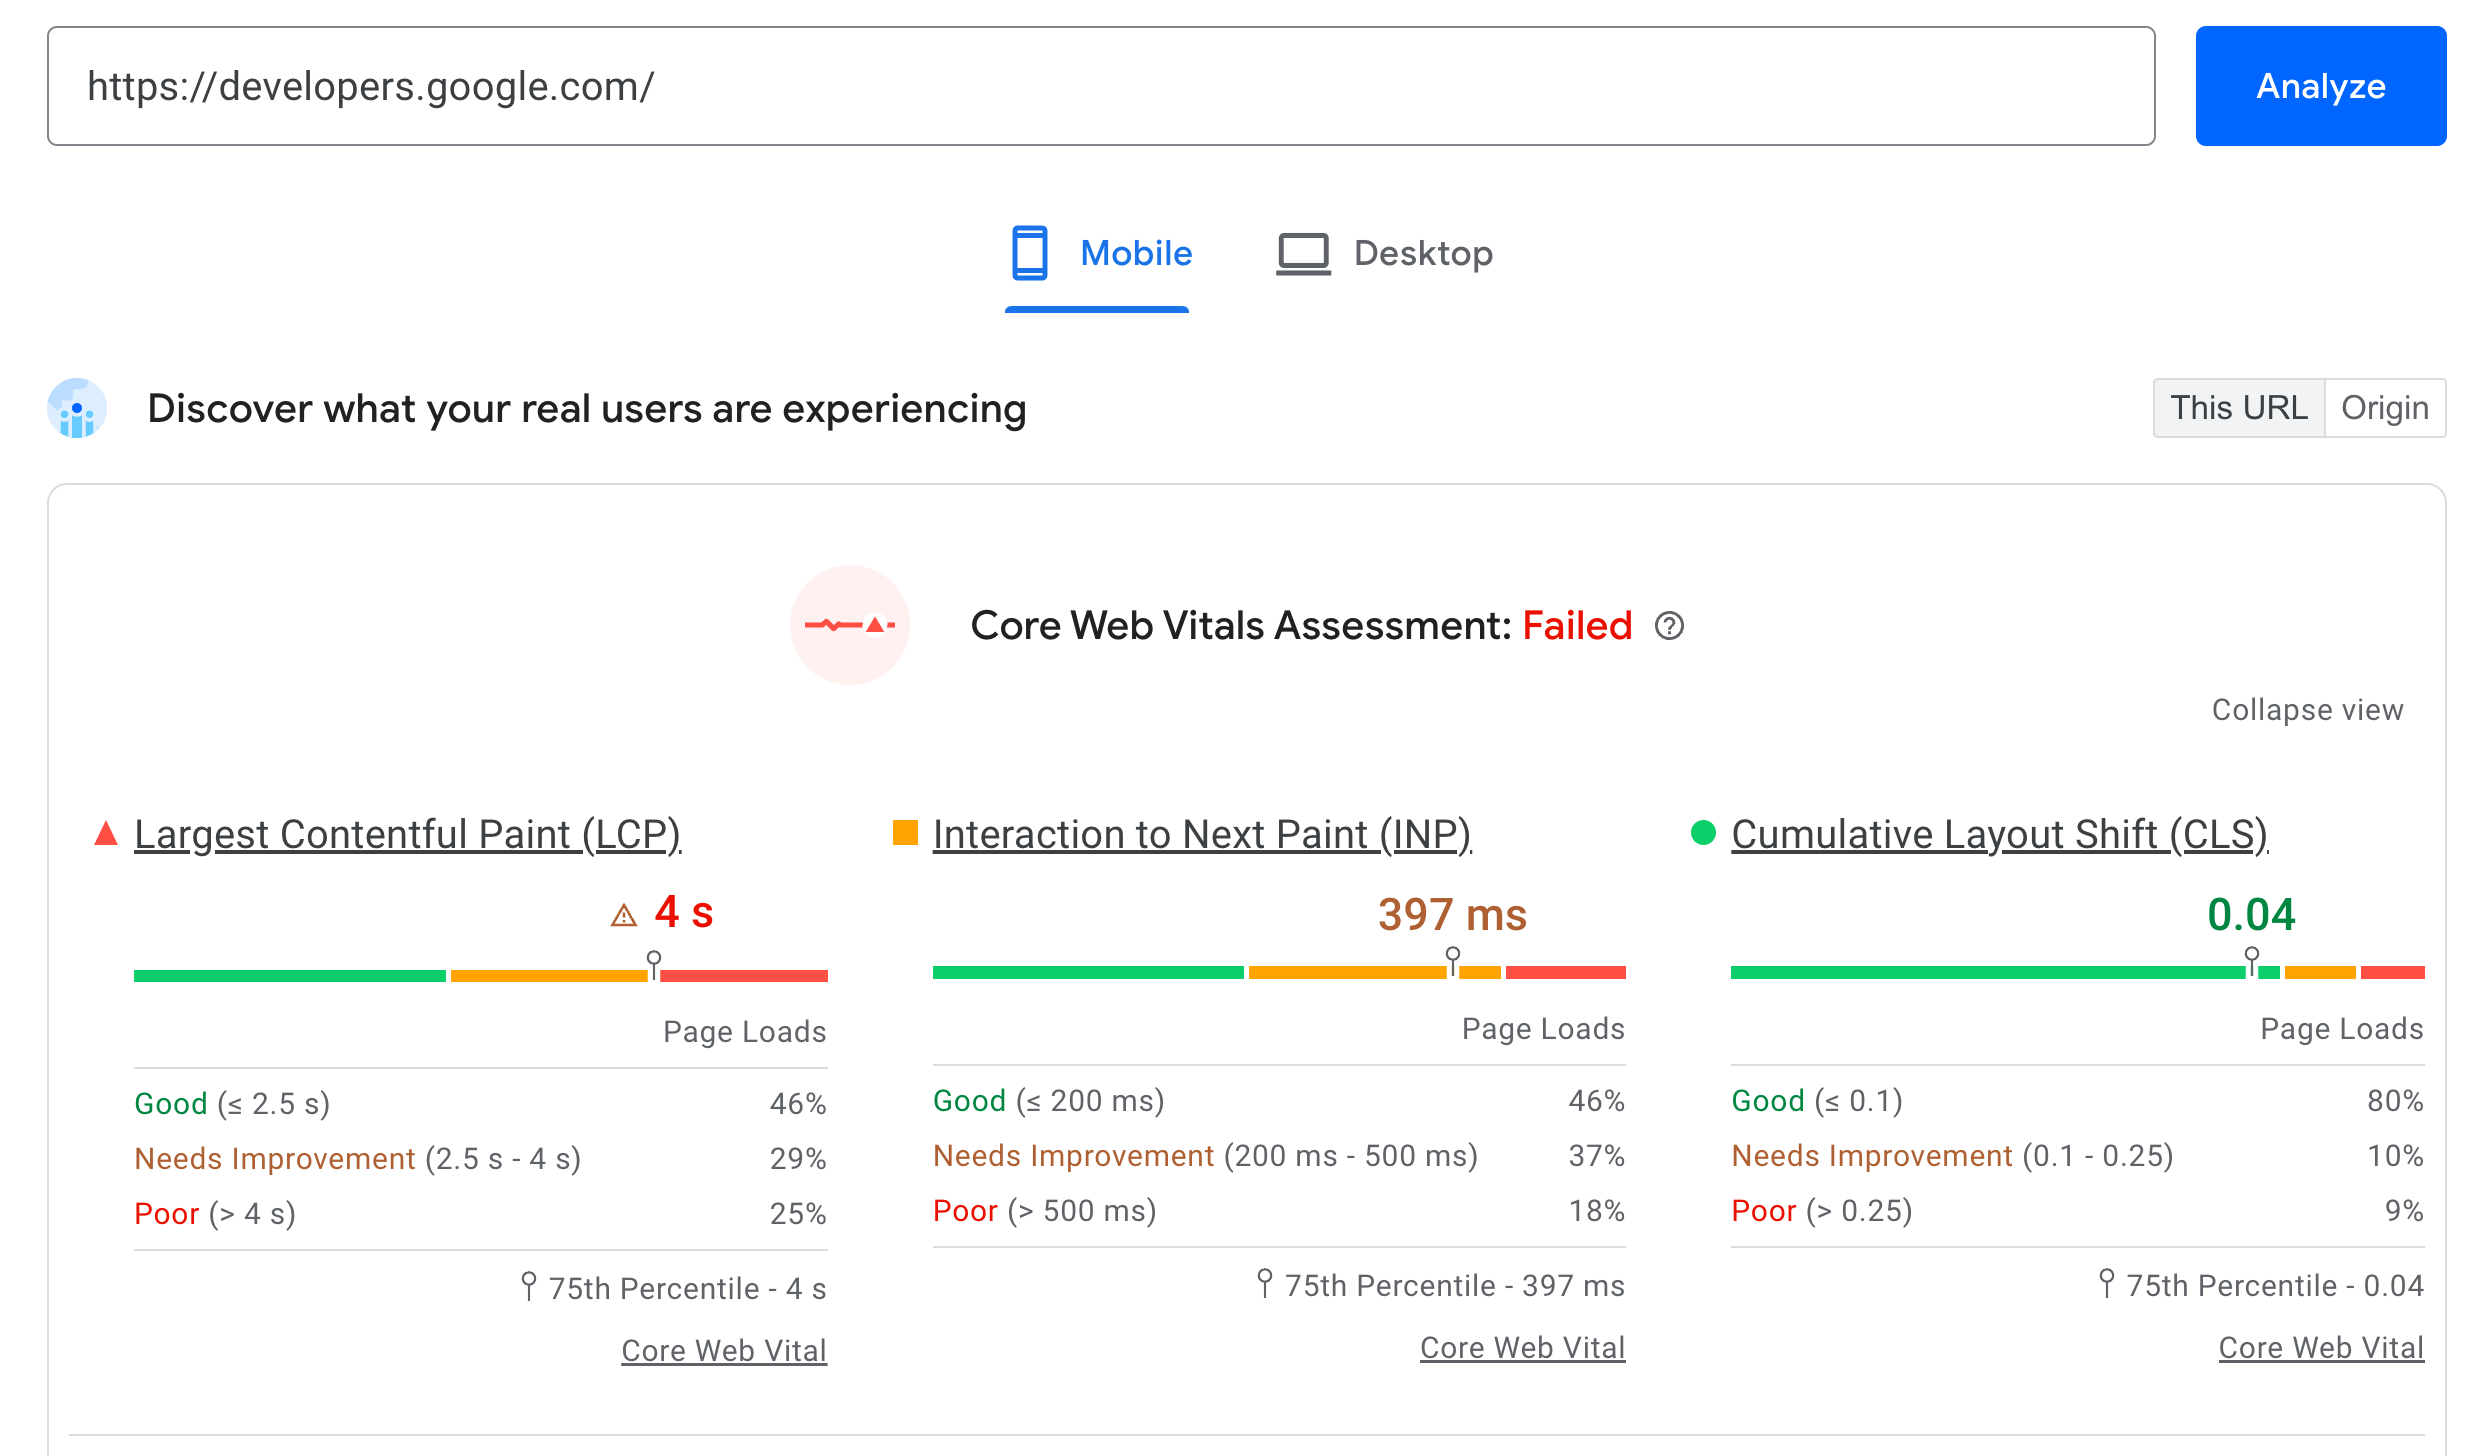
Core Web Vitals From Field Data
Core Web Vitals are a set of metrics that Google considers important in a webpage's overall user experience.
Here's how you extract these metrics from the API response data:
const cruxMetrics = {
  "Largest Contentful Paint":
    data.loadingExperience.metrics.LARGEST_CONTENTFUL_PAINT_MS.category,
  "Interaction to Next Paint":
    data.loadingExperience.metrics.INTERACTION_TO_NEXT_PAINT.category,
  "Cumulative Layout Shift":
    data.loadingExperience.metrics.CUMULATIVE_LAYOUT_SHIFT_SCORE.category,
};
The resulting cruxMetrics object looks like this:
{
  "Largest Contentful Paint": "AVERAGE",
  "Interaction to Next Paint": "FAST",
  "Cumulative Layout Shift": "AVERAGE"
}
- Largest Contentful Paint (LCP): Measures how soon the main content appears.
- Interaction to Next Paint (INP): Measures how quickly the website reacts to user interactions.
- Cumulative Layout Shift (CLS): Measures how user experience is impacted by unexpected layout shifts.
Lighthouse Performance Score from Lab Data
Variability in Lighthouse scores is normal, so you may see different scores on each PageSpeed Insights run.
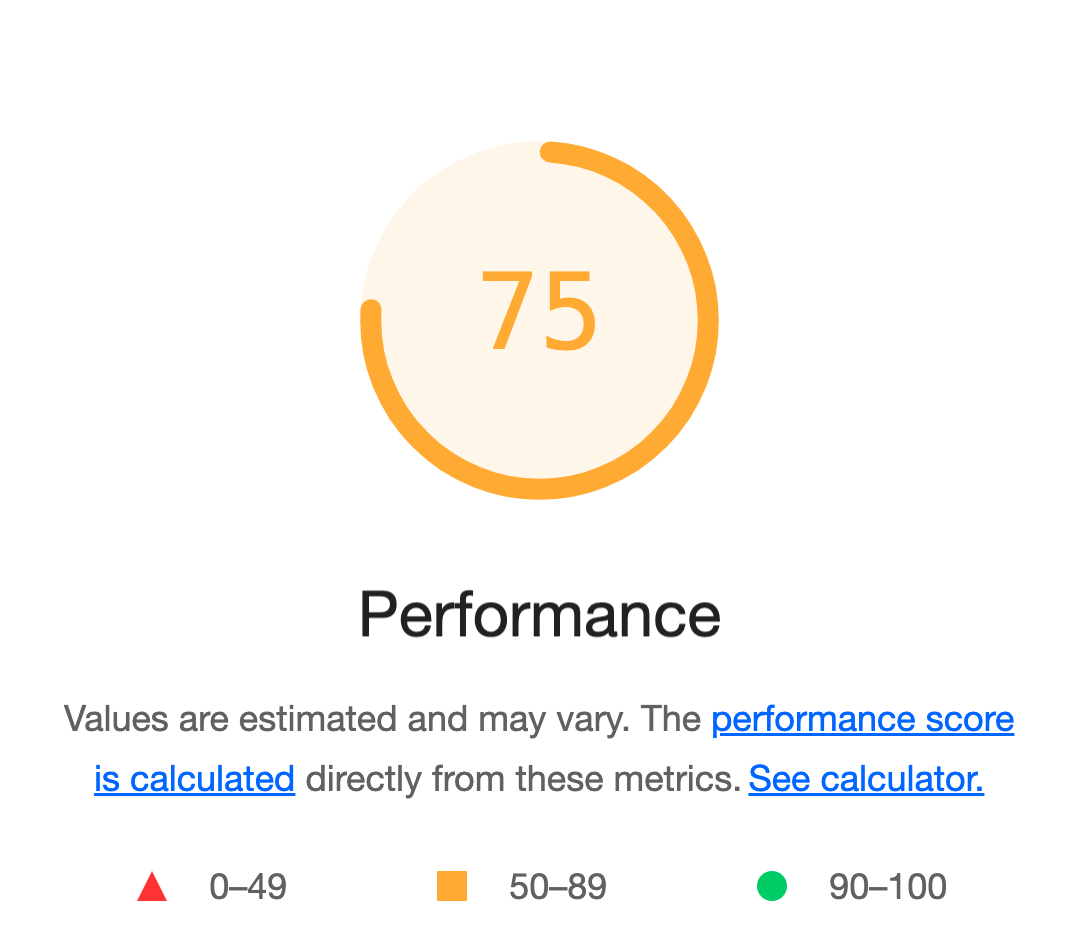
The Lighthouse Performance Score is a weighted average of several performance metrics, providing an overall assessment of your page's performance:
const lighthousePerformanceScore =
  data.lighthouseResult.categories.performance.score * 100;
// lighthousePerformanceScore = 75
This score ranges from 0 to 1, with 1 being the best possible score. Multiplying by 100 gives you a percentage that's easier to interpret.
Largest Contentful Paint (LCP) Score from Lab Data
The .loadingExperience property in the API response provides field data for LCP. However, for lab data, you can use the Lighthouse audit:
const lcp =
  data.lighthouseResult.audits["largest-contentful-paint"].displayValue;

// lcp = "2.5 s"

// Or data.lighthouseResult.audits["cumulative-layout-shift"].displayValue for CLS
While the displayValue property is useful, the largest-contentful-paint property has more detailed information about the LCP:
// output of data.lighthouseResult.audits["largest-contentful-paint"];

{
  "id": "largest-contentful-paint",
  "title": "Largest Contentful Paint",
  "description": "Largest Contentful Paint marks the time...",
  "score": 0.47,
  "scoreDisplayMode": "numeric",
  "displayValue": "2.5 s",
  "numericValue": 2484,
  "numericUnit": "millisecond"
}
This data can be especially useful when creating custom reports or dashboards.
Largest Contentful Paint Element from Lab Data
You can also identify the specific element causing the LCP:
const lcpElementDetails =
  data.lighthouseResult.audits["largest-contentful-paint-element"].details
    ?.items[0]?.items[0]?.node;
The lcpElementDetails variable contains information about the element responsible for the LCP:
{
  "type": "node",
  "selector": "#container > img",
  "snippet": "<img src=\"/static/main.png\">",
  "boundingRect": {
    "width": 630,
    "left": 681
    // Also "height", "top", "bottom", "right"
  },
  "nodeLabel": "Image of cat"
}
This information tells you which specific element on your page is responsible for the LCP. For example, it might be a large image, a text block, or a video.
Use the PageSpeed Insights API with Node.js
Here's a Node.js script to fetch and display key metrics using the PageSpeed Insights API. The instructions on how to use this are shown after the code.
const API_URL = "https://www.googleapis.com/pagespeedonline/v5/runPagespeed";
const TEST_URL = "https://developers.google.com";

function setUpQuery() {
  const params = new URLSearchParams({
    url: TEST_URL,
  });
  return `${API_URL}?${params}`;
}

function showMetrics(title, metrics) {
  console.log(`\n${title}`);
  for (const [key, value] of Object.entries(metrics)) {
    console.log(`${key}: ${value}`);
  }
}

console.log("Starting PageSpeed Insights analysis...");
const url = setUpQuery();
console.log(`Fetching data from: ${url}`);

const response = await fetch(url);
const data = await response.json();

console.log(`\nPage tested: ${data.id}`);

const cruxMetrics = {
  "Largest Contentful Paint":
    data.loadingExperience.metrics.LARGEST_CONTENTFUL_PAINT_MS.category,
  "Interaction to Next Paint":
    data.loadingExperience.metrics.INTERACTION_TO_NEXT_PAINT.category,
  "Cumulative Layout Shift":
    data.loadingExperience.metrics.CUMULATIVE_LAYOUT_SHIFT_SCORE.category,
};
showMetrics("CrUX Results:", cruxMetrics);

const lighthouse = data.lighthouseResult;
const lighthouseMetrics = {
  "Largest Contentful Paint":
    lighthouse.audits["largest-contentful-paint"].displayValue,
  "Largest Contentful Paint Element":
    lighthouse.audits["largest-contentful-paint-element"].details?.items[0]
      ?.items[0]?.node?.snippet || "N/A",
  "Cumulative Layout Shift":
    lighthouse.audits["cumulative-layout-shift"].displayValue,
};
showMetrics("Lighthouse Results:", lighthouseMetrics);
To run the code:
- In your terminal, run the following commands:
npm init -y
npm pkg set type="module"
-
Create a new file, for example
psi-api.js, and paste the previously shown code within that file. -
Run the code like this:
node psi-api.js
You should see an output similar to the following screenshot:
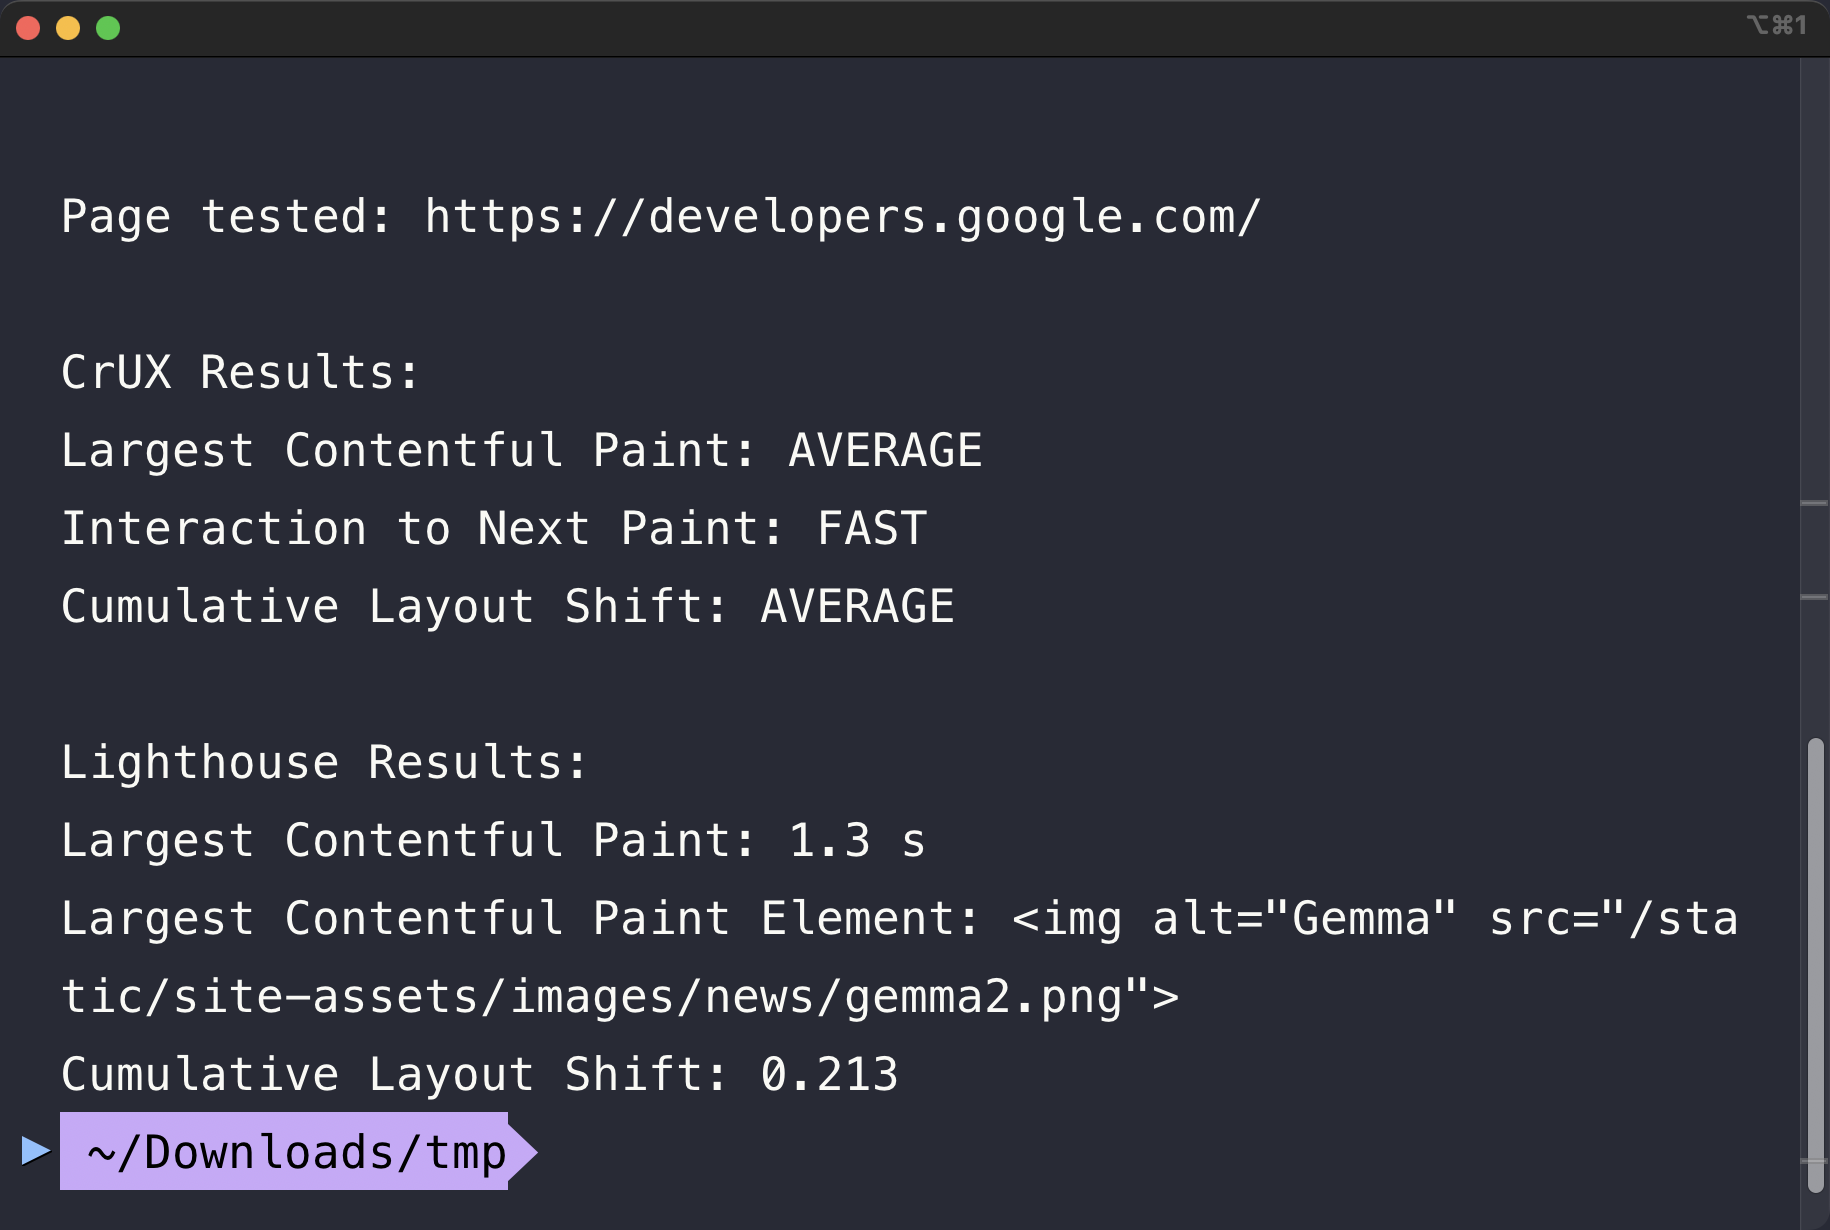
This script fetches PSI data for a given URL and displays both CrUX (field data) and Lighthouse (lab data) metrics.
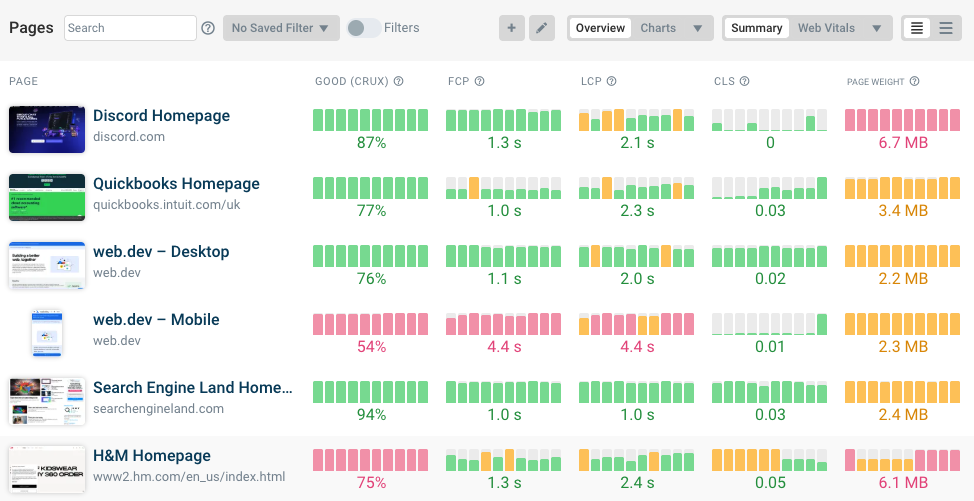
Comparing Multiple URLs with the PageSpeed Insights API
You can extend the previous code to compare performance across multiple pages. Use this code to try it out.
You would run this code in the same way as the previous Node.js example: paste the code into a file, e.g. psi-api-multiple.js, and run it with node psi-api-multiple.js.
You can add to this JavaScript array to test multiple URLs:
const urls = ["https://www.disney.com/", "https://www.hbo.com/"];
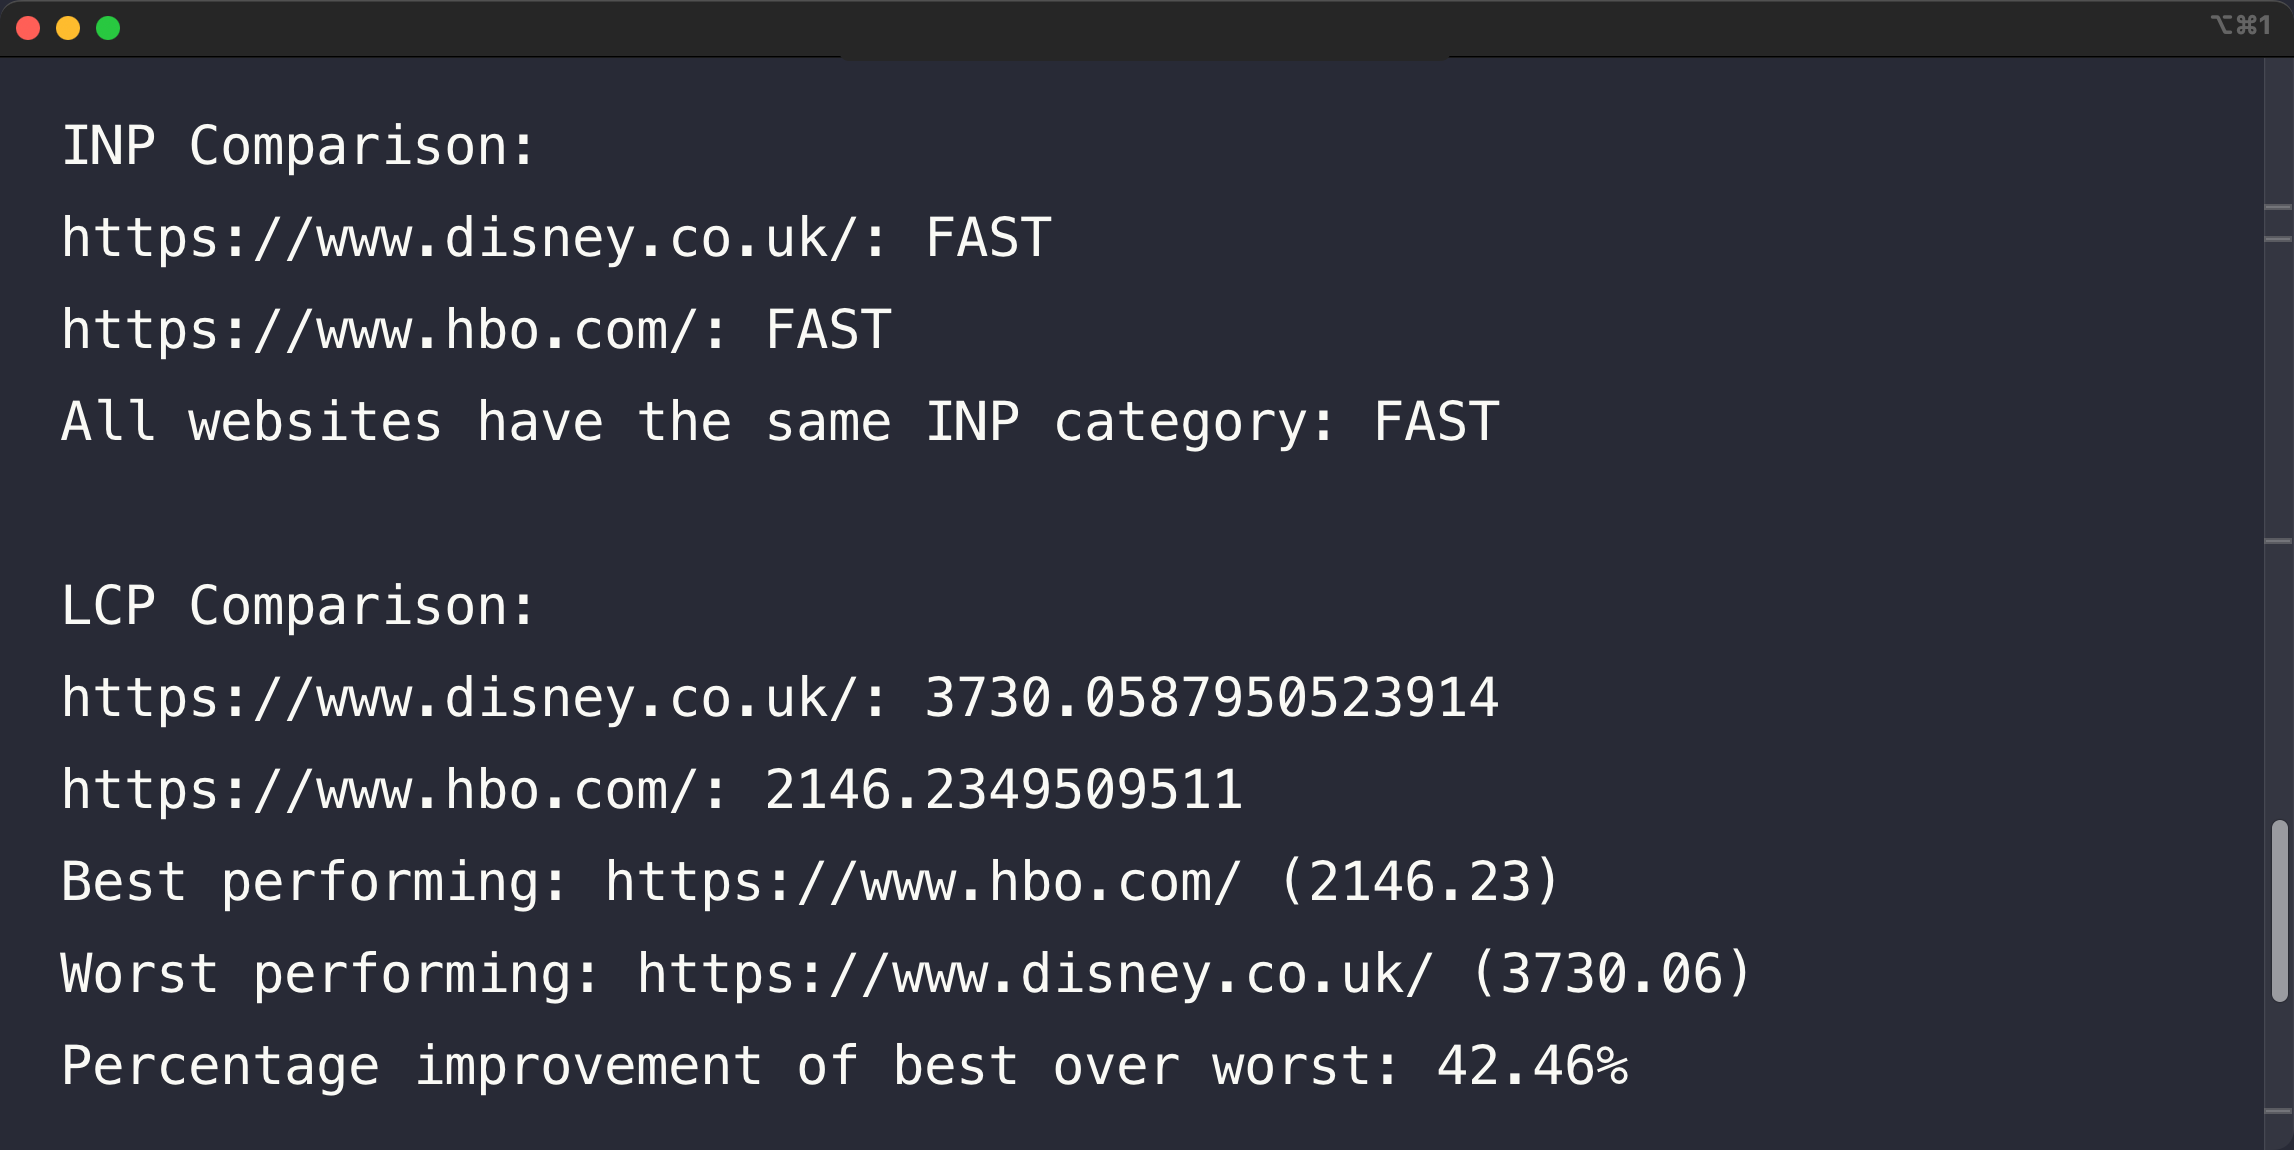
This script allows you to compare key performance metrics across multiple pages, helping you identify which pages need the most optimization work.
Using the PageSpeed Insights API From A Web Application
You can also use the PageSpeed Insights API in a web application. The source code of this demo shows how to fetch and display PSI data in a browser. The code is very similar to the Node.js example.
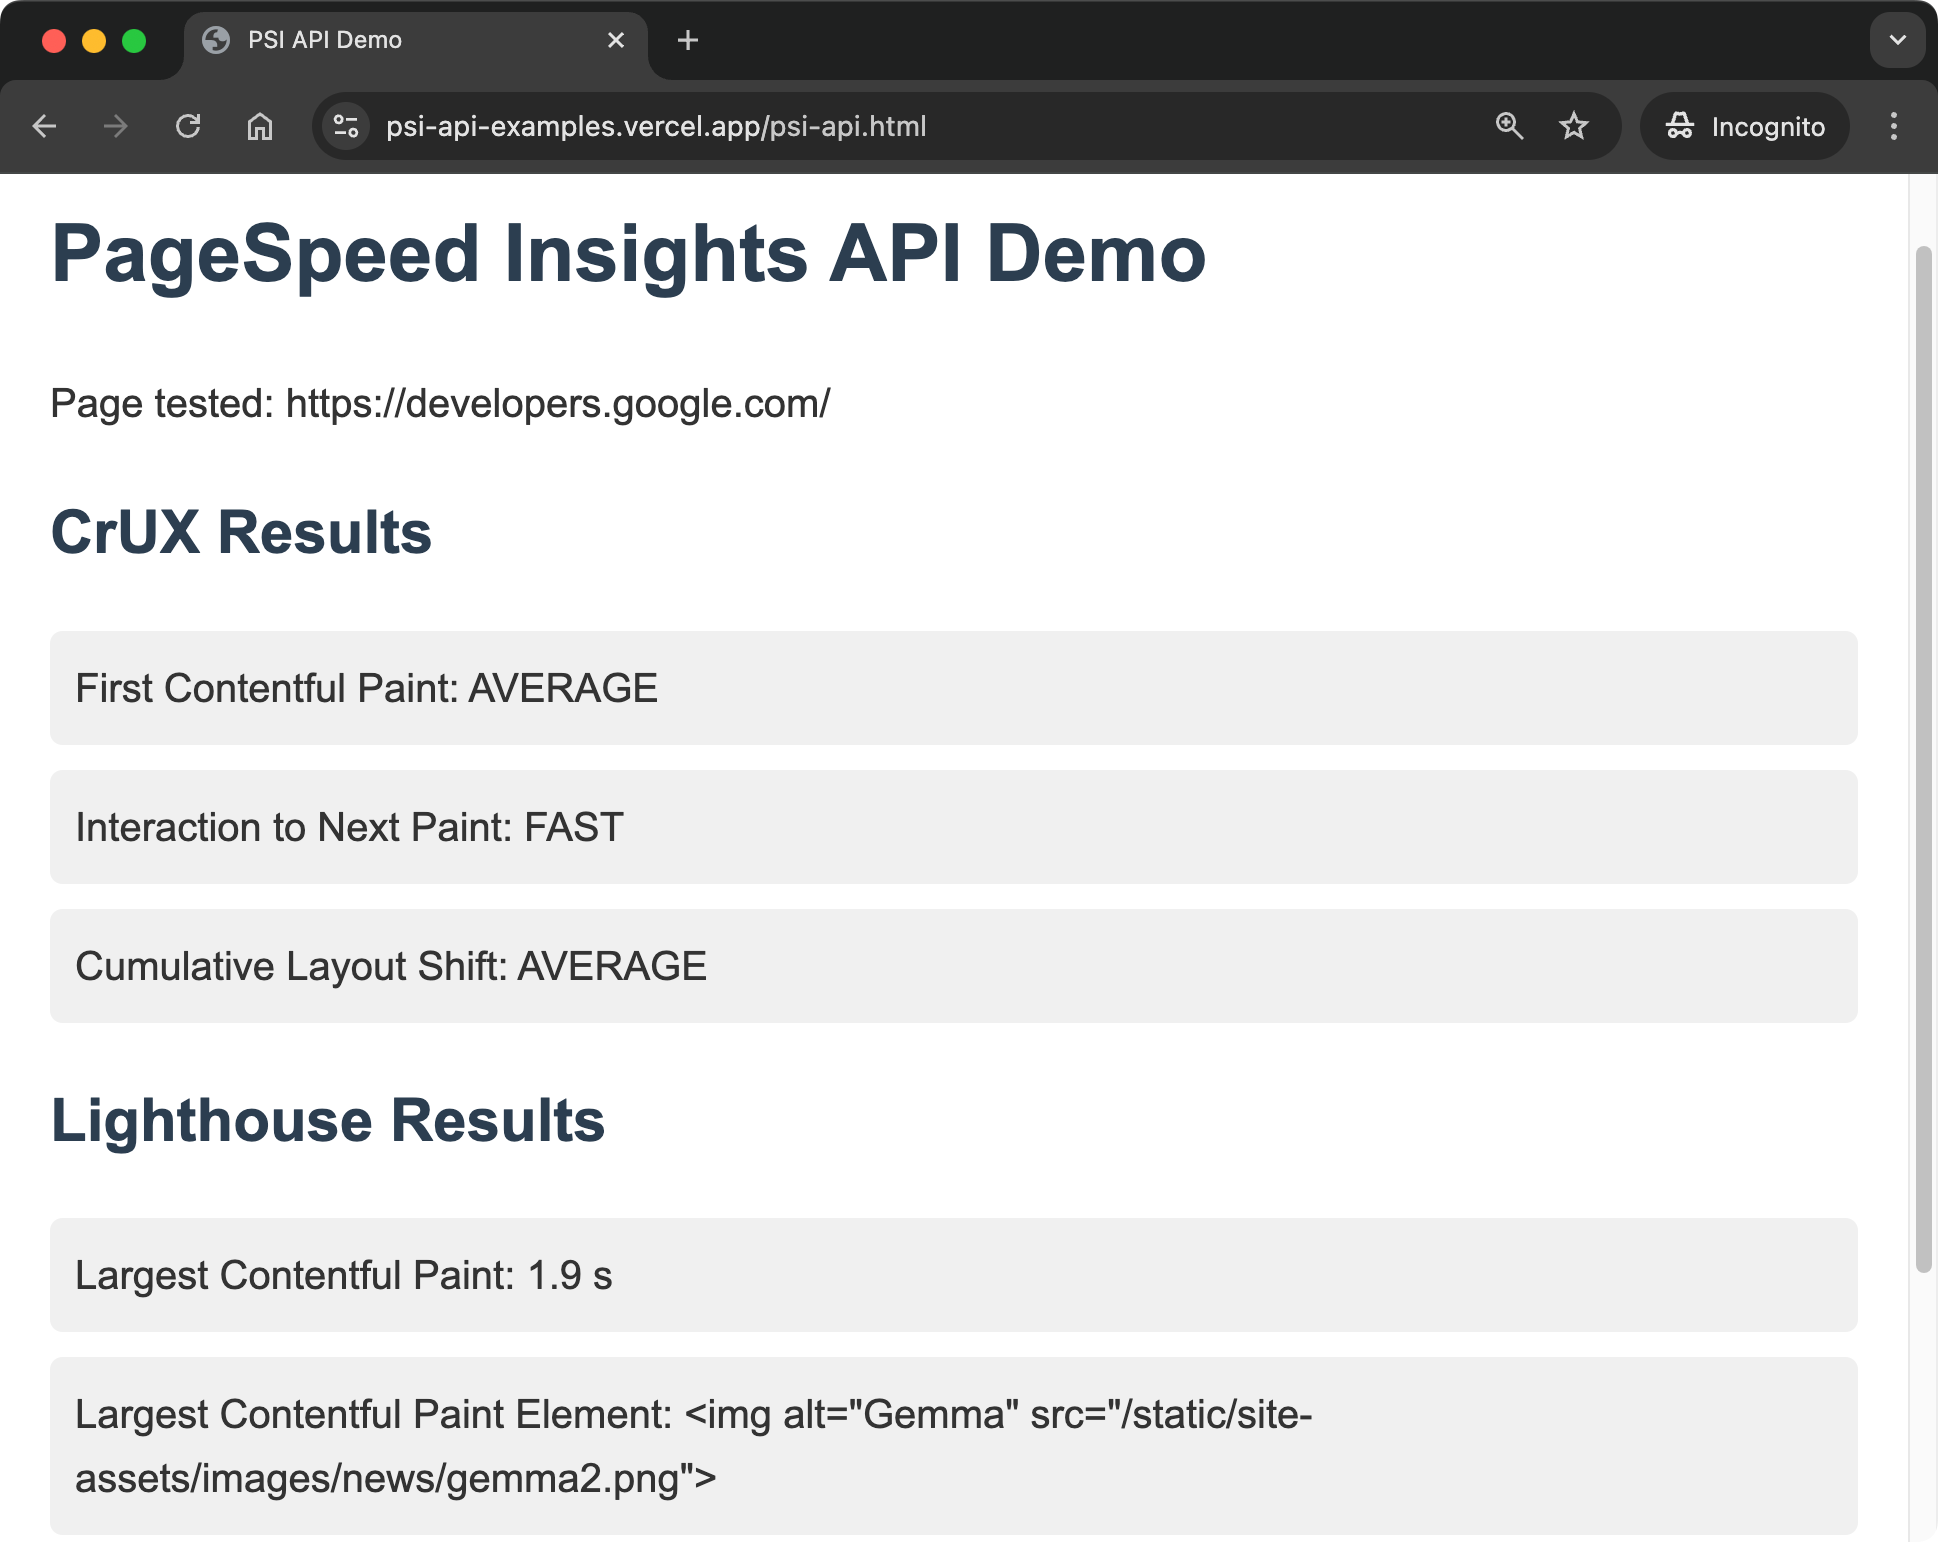
To view the code that powers this demo, you can right-click on the page and select View Page Source.
Best practices and limitations
- Respect rate limits: The PageSpeed Insights API has usage quotas. Implement proper error handling and retries, and don't forget to use an API key for higher limits during production use.
- Cache results: Avoid unnecessary API calls by caching results for a reasonable duration.
- Consider variability: Performance can fluctuate. Use multiple runs for more reliable data.
- Use with CI/CD: Integrate performance testing into your deployment pipeline to catch issues early.
Continuous monitoring with the PageSpeed Insights API
Once you're able to use the PageSpeed Insights API from a terminal command or a script, you can automate these tests to run regularly:
- Run tests on a schedule using a cron job.
- Run tests as part of a continuous integration pipeline, so you can catch performance regressions early by running PageSpeed Insights on the latest version of your website.
- You can store the results in a database or a spreadsheet to track performance over time, and plot interesting metrics on a dashboard.
PageSpeed Insights API pricing
The PageSpeed Insights API allows you to run 25,000 tests per day and make 240 requests per minute.
Google does not charge for using the PageSpeed Insights API.
Using the PageSpeed Insights API with Other Languages
This post covered usage of the PageSpeed Insights API with Node.js and JavaScript. However, you can use the API from client libraries in other languages. For example, Java, .NET, Objective-C and more.
Limitations of the PageSpeed Insights API
While the PageSpeed Insights API is a useful tool for web performance, it does have some limitations:
-
Simulated throttling only: The API uses simulated network throttling, which may not always accurately reflect real-world conditions.
-
No request waterfalls: PSI doesn't provide detailed request waterfalls that can make it challenging to notice problematic resources.
-
Limited testing scenarios: The API can't test pages that require authentication, and doesn't allow you to configure custom network conditions.
-
No real user data collection: While it provides some field data from CrUX, you can't use the API to collect real user metrics from your specific audience.
-
Rate limiting: Google imposes usage quotas, which can impact your ability to run tests at scale.
-
Infrastructure requirements: To use the API for ongoing monitoring, you need to set up and maintain your own infrastructure for data collection, storage, and reporting.
Run detailed reliable performance tests
The DebugBear website speed test provides in-depth reliable reporting that goes beyond what Lighthouse and PageSpeed Insights can offer.
You can see a video recording of the page load time and track page speed scores on a real throttled connection.
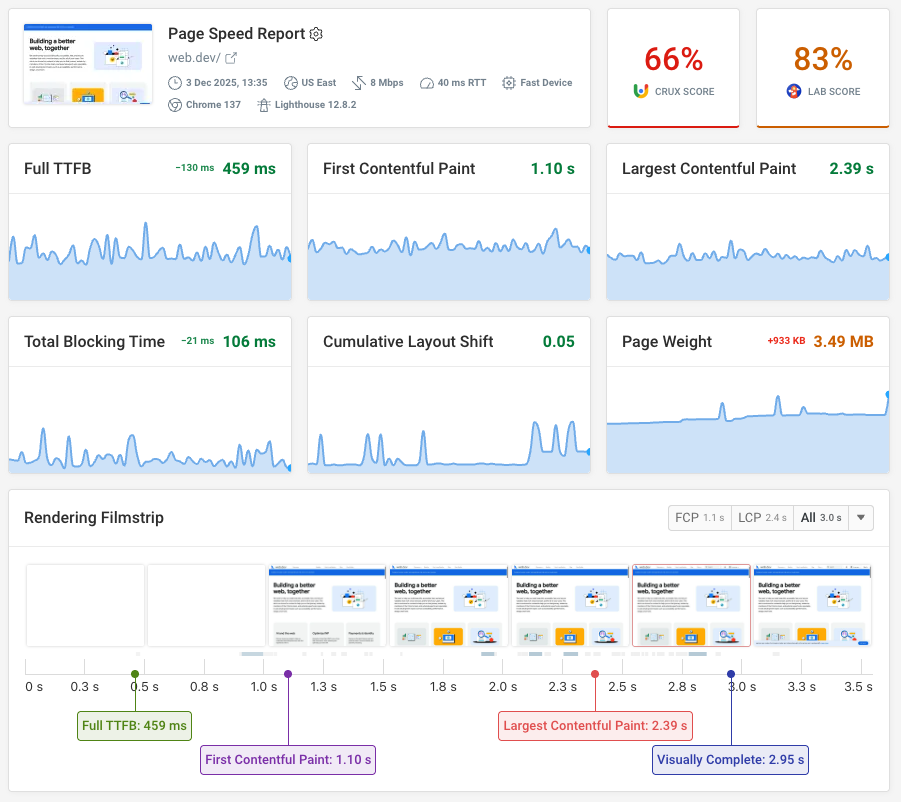
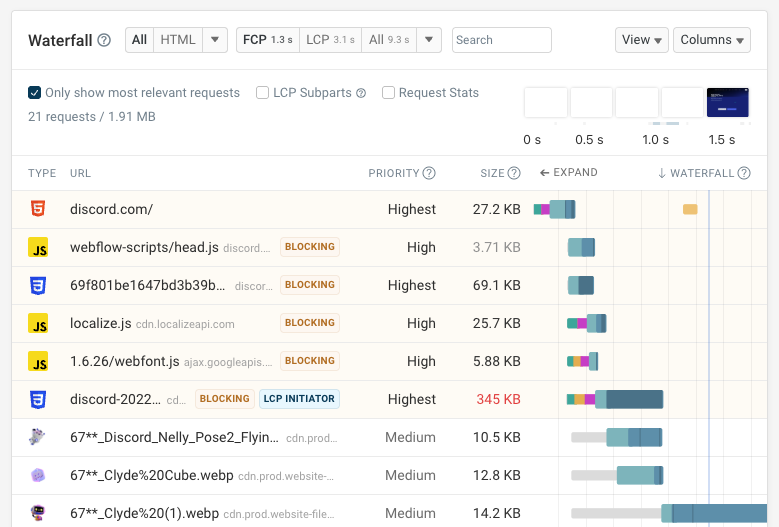
The detailed request waterfall tells you when different resources are loading and how they impact rendering progress.
You can also see the priority of each request, when data arrives for different resources, and how large each response body is.
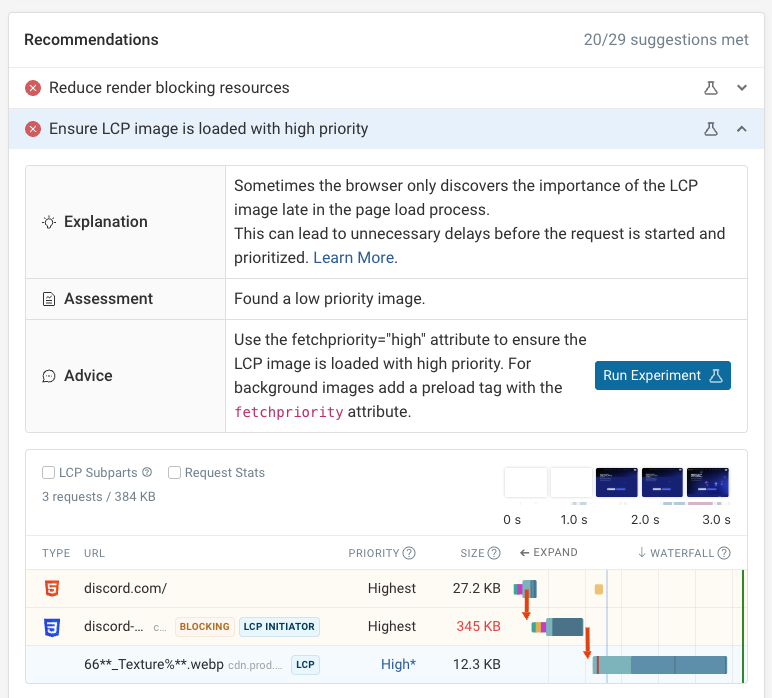
DebugBear test results include Google's Lighthouse report, but also provide custom performance recommendations.
You can also run experiments to try out optimizations without deploying code. See a before and after view of your metrics to see how a change on your website impacts performance.
Set up comprehensive web performance monitoring
By running scheduled synthetic tests on your website, you can catch issues early and track improvements.
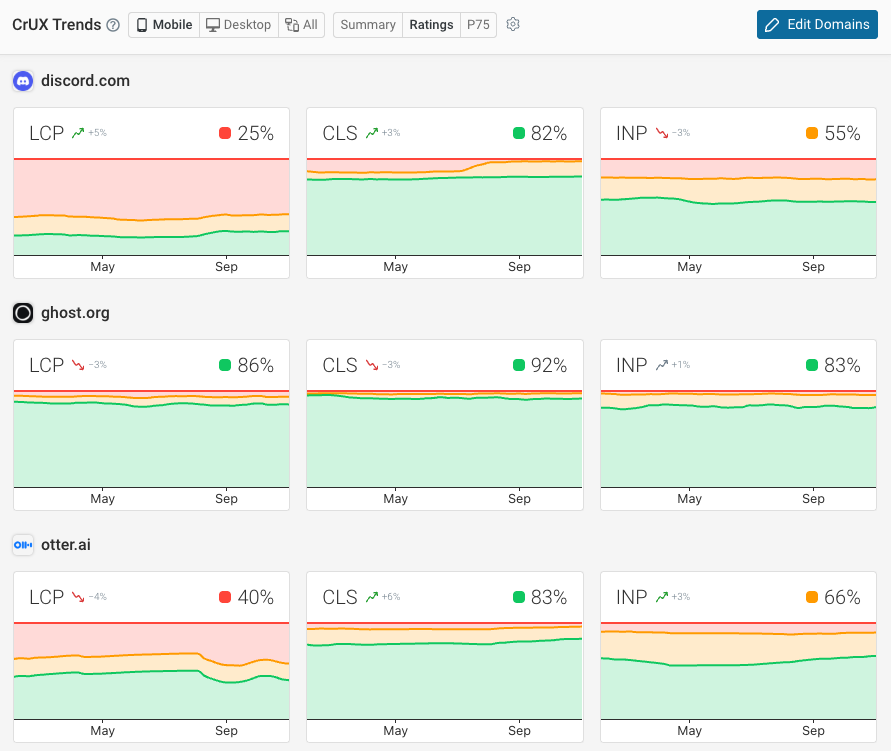
DebugBear also supports monitoring Google CrUX data for your website and for your competitors. This is the data that impacts Google SEO.
If you want to track actual visitor experience you can use real user monitoring. Get in-depth insights into Core Web Vitals on your website and measure the business impact of web performance by correlating page speed with conversion rates.
Review specific page visits to identify slow requests. Or fix slow interactions by using data from Long Animation Frames API to detect slow scripts. Start a free trial today.


Monitor Page Speed & Core Web Vitals
DebugBear monitoring includes:
- In-depth Page Speed Reports
- Automated Recommendations
- Real User Analytics Data