
Browser developer tools keep getting better every year, making it easier to build fast, responsive websites. Chrome's latest DevTools update brings some useful features that improve how you debug and optimize your web apps.
Let's explore the most exciting new Chrome DevTools features that will help you build better websites in 2025.
Introduction
This post covers 8 Chrome DevTools features we really like. This post assumes Chrome DevTools version 134 or later. However, as a Chromium-based browser, Microsoft Edge also includes some of these features.
Find Performance Bottlenecks from Large DOM Trees
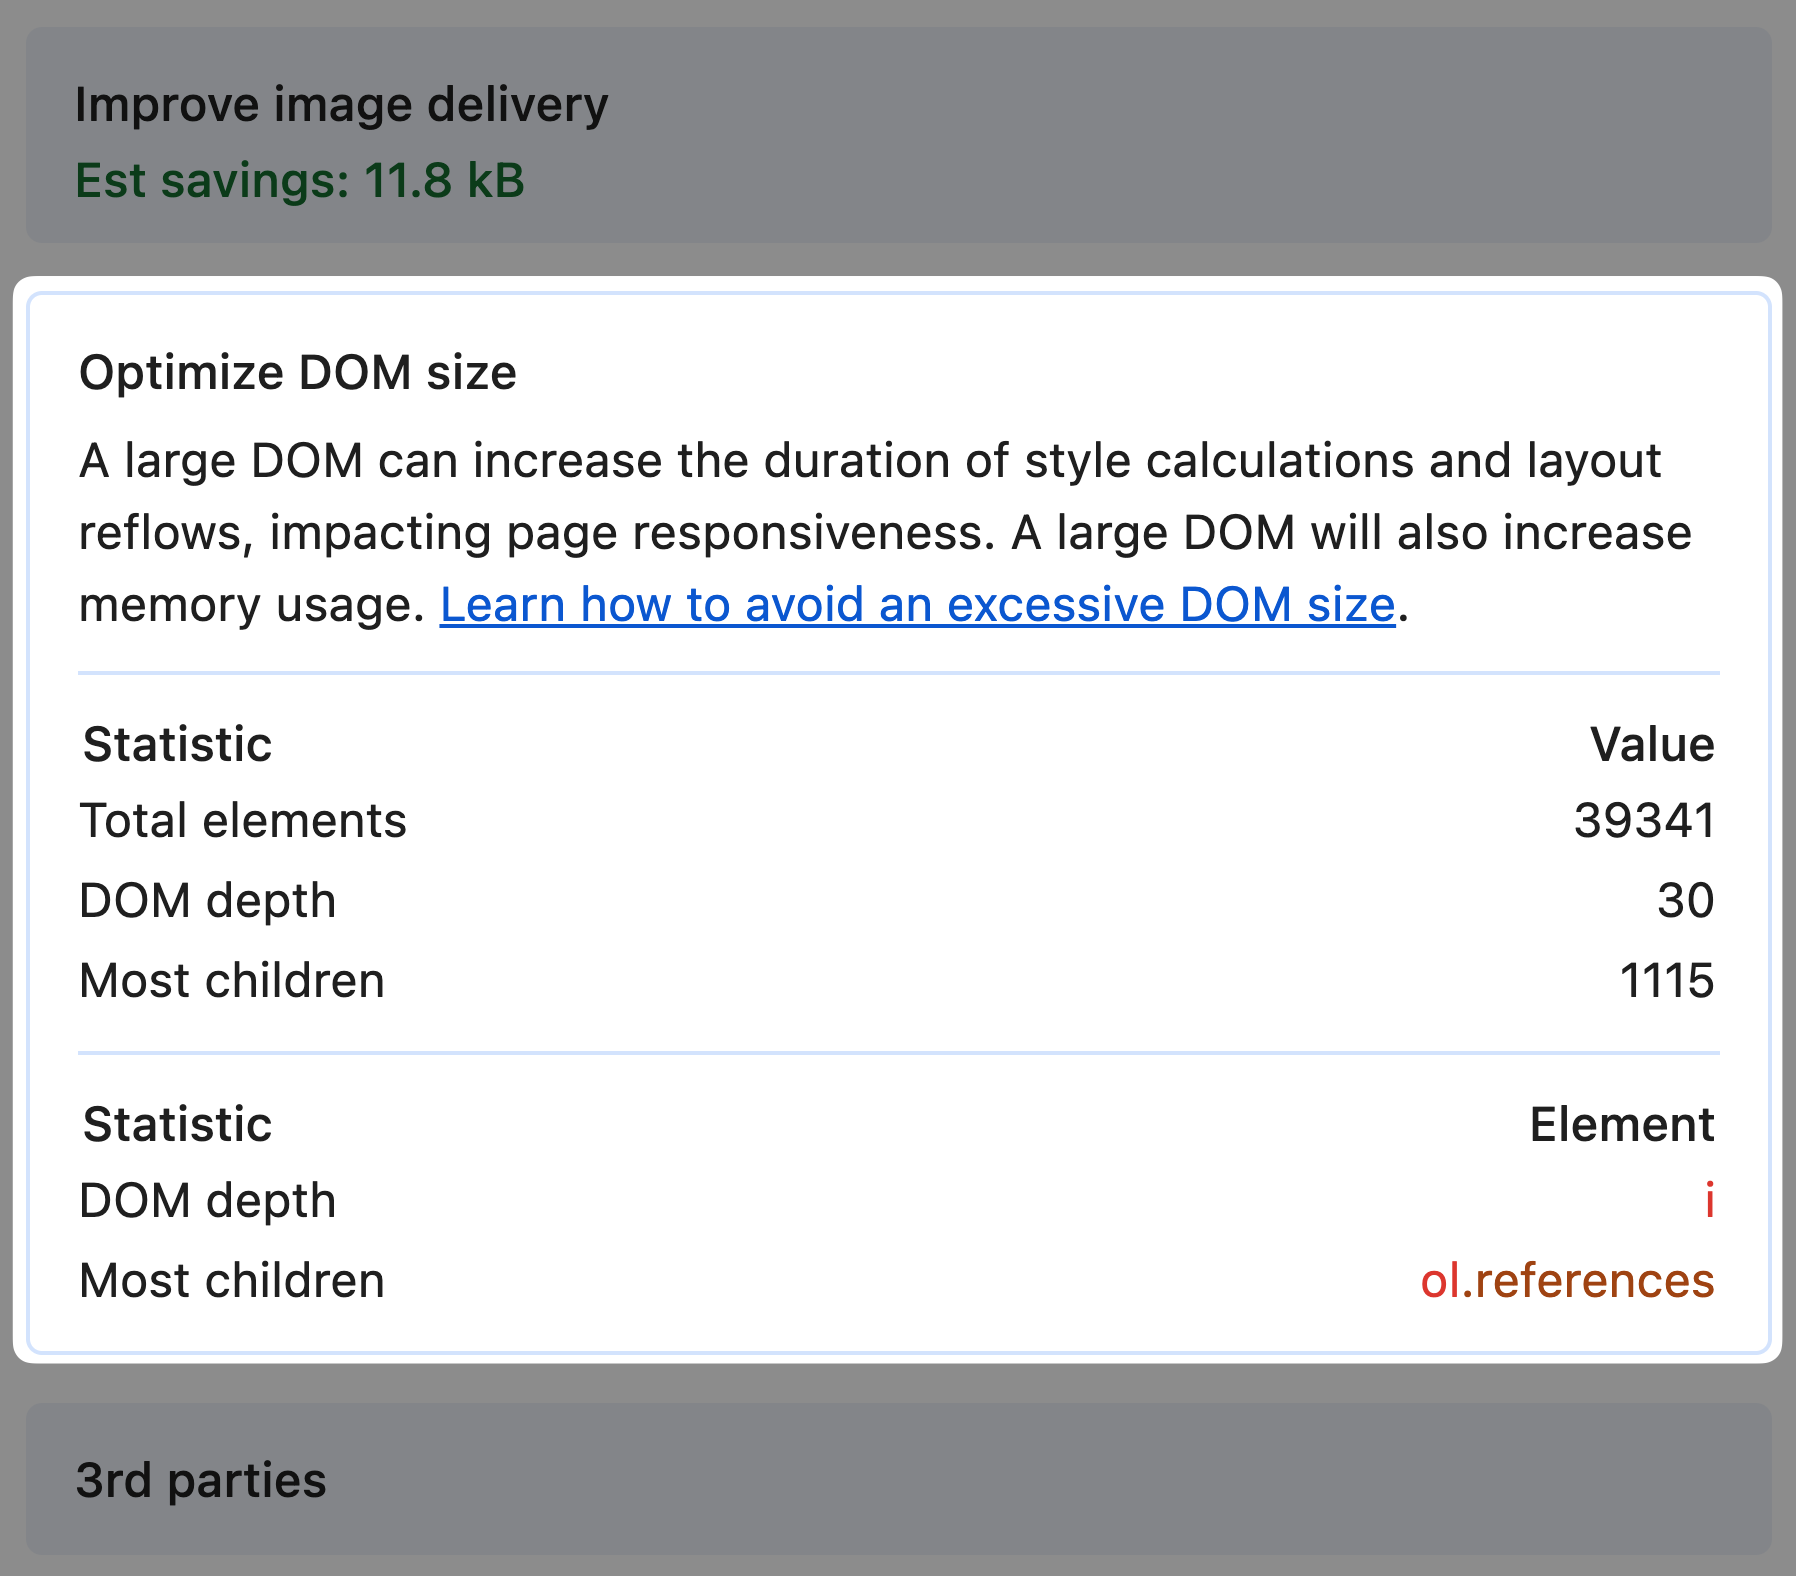
Large DOM trees can impact your page's performance, causing sluggish interactions and poor user experience. The new Optimize DOM size insight recommendation helps you quickly identify when your page has too many elements.
Why is this useful
Large DOM trees force browsers to process more elements than necessary, causing slow page rendering. Finding and fixing these problems can speed up your site.
How to use it
- Make a page load recording in the DevTools Performance panel for this Wikipedia page
- Open the Insights tab and look for the "Optimize DOM size" insight
- Review the highlighted information about total elements, DOM depth, and other statistics
Lighthouse also includes a similar DOM size audit.
Why we like this
We're big fans of this feature because it pinpoints specific DOM nodes, for example the node with the most children, and gives you a clickable link to jump to that node in the Elements panel.
Instead of guessing which parts of your DOM are causing problems, you get clear data showing exactly where to focus your optimization efforts.
Focus on Your Code by Filtering Out Third-Party Scripts
Finding performance issues in your own code can be challenging when third-party scripts clutter your performance recordings. The new first-party/third-party filtering makes it much easier to focus on what matters.
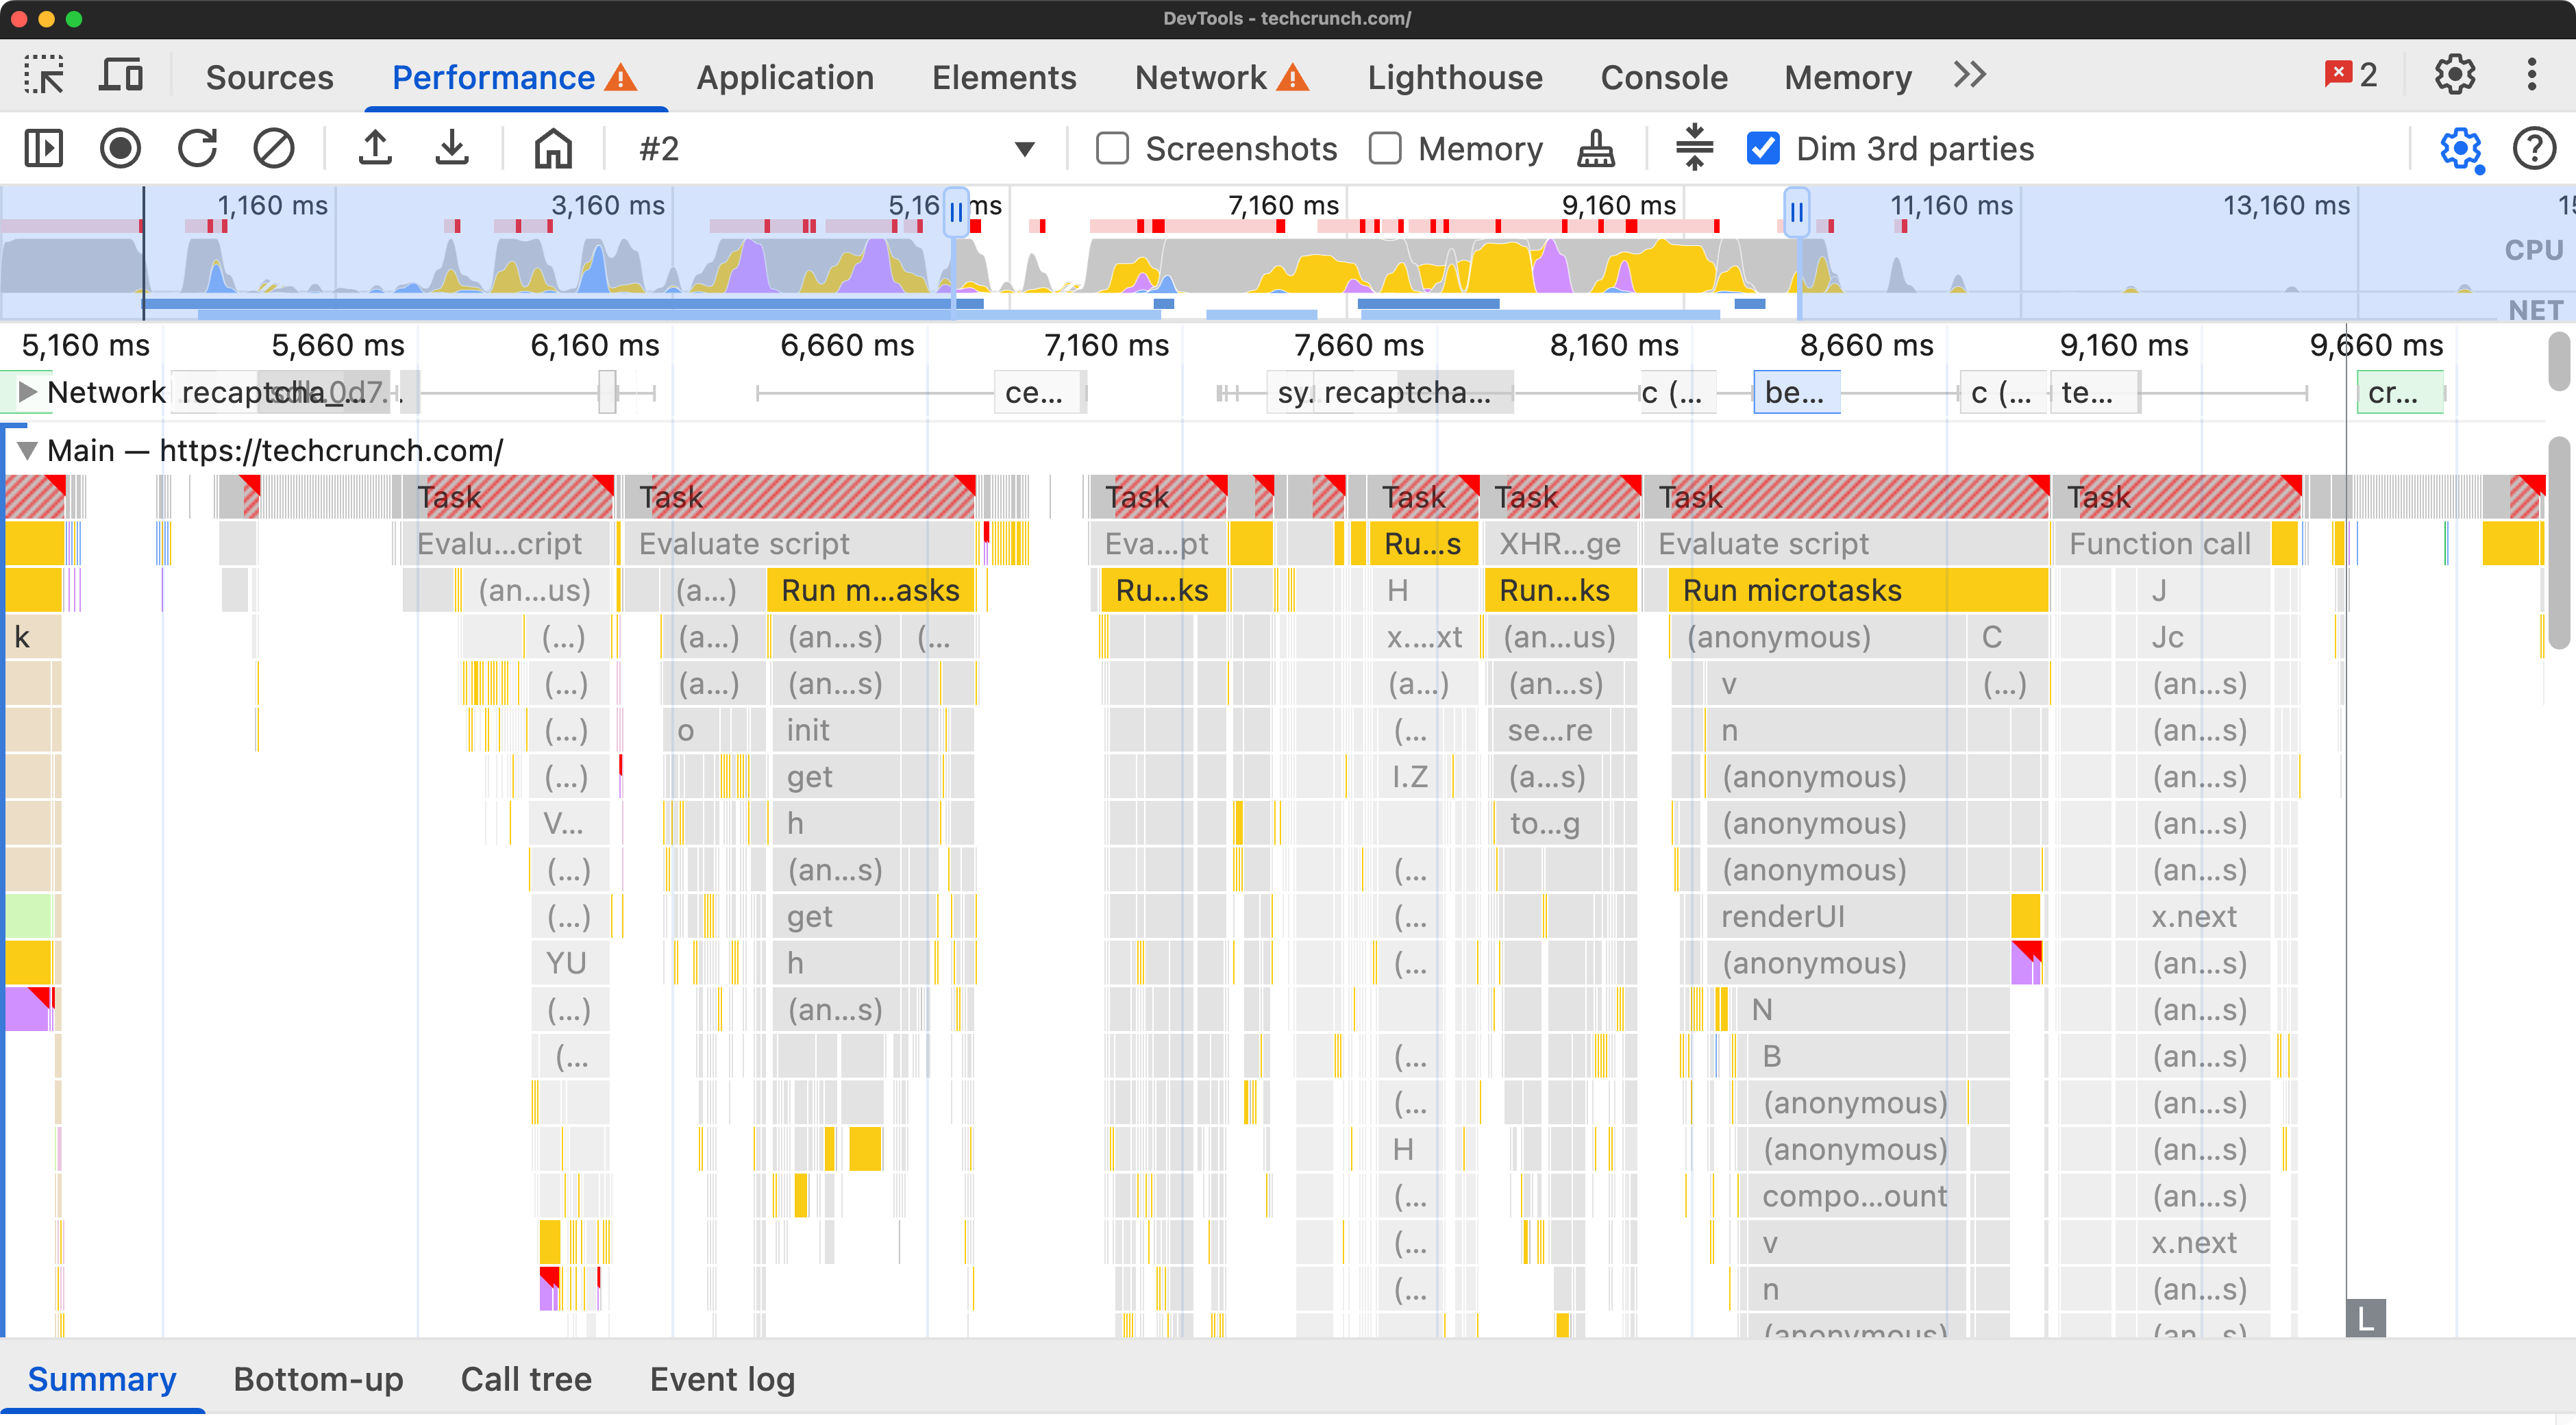
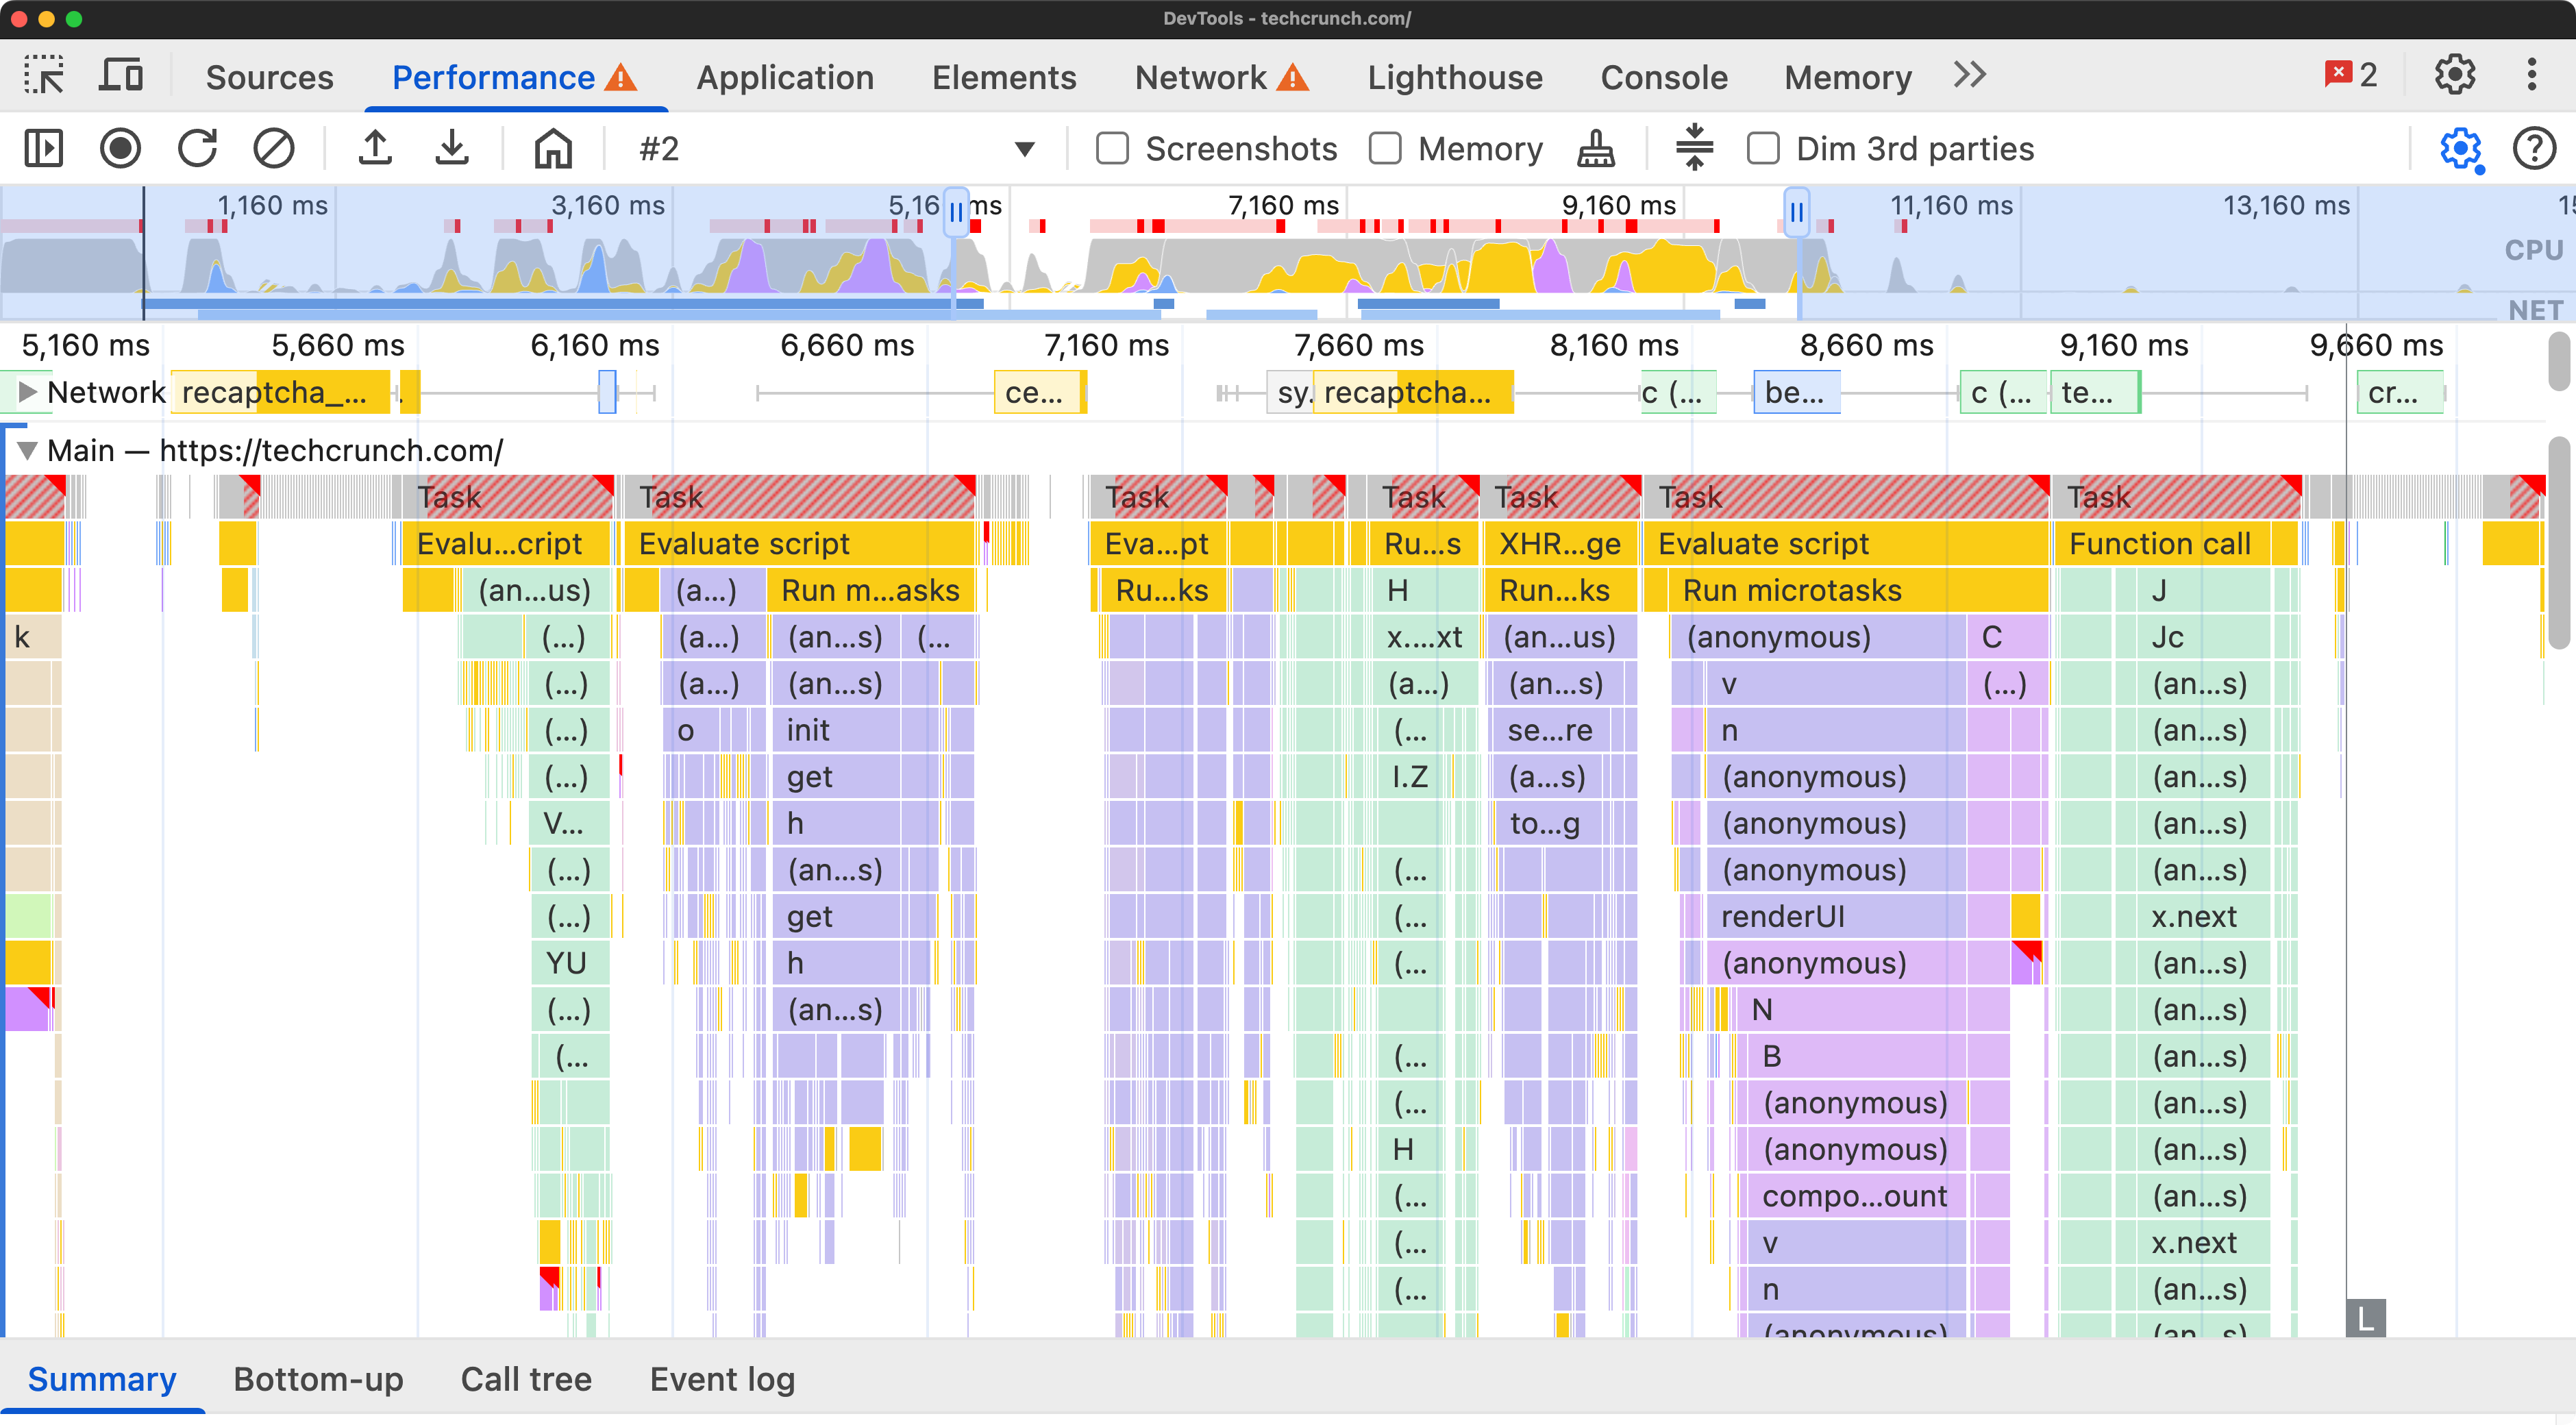
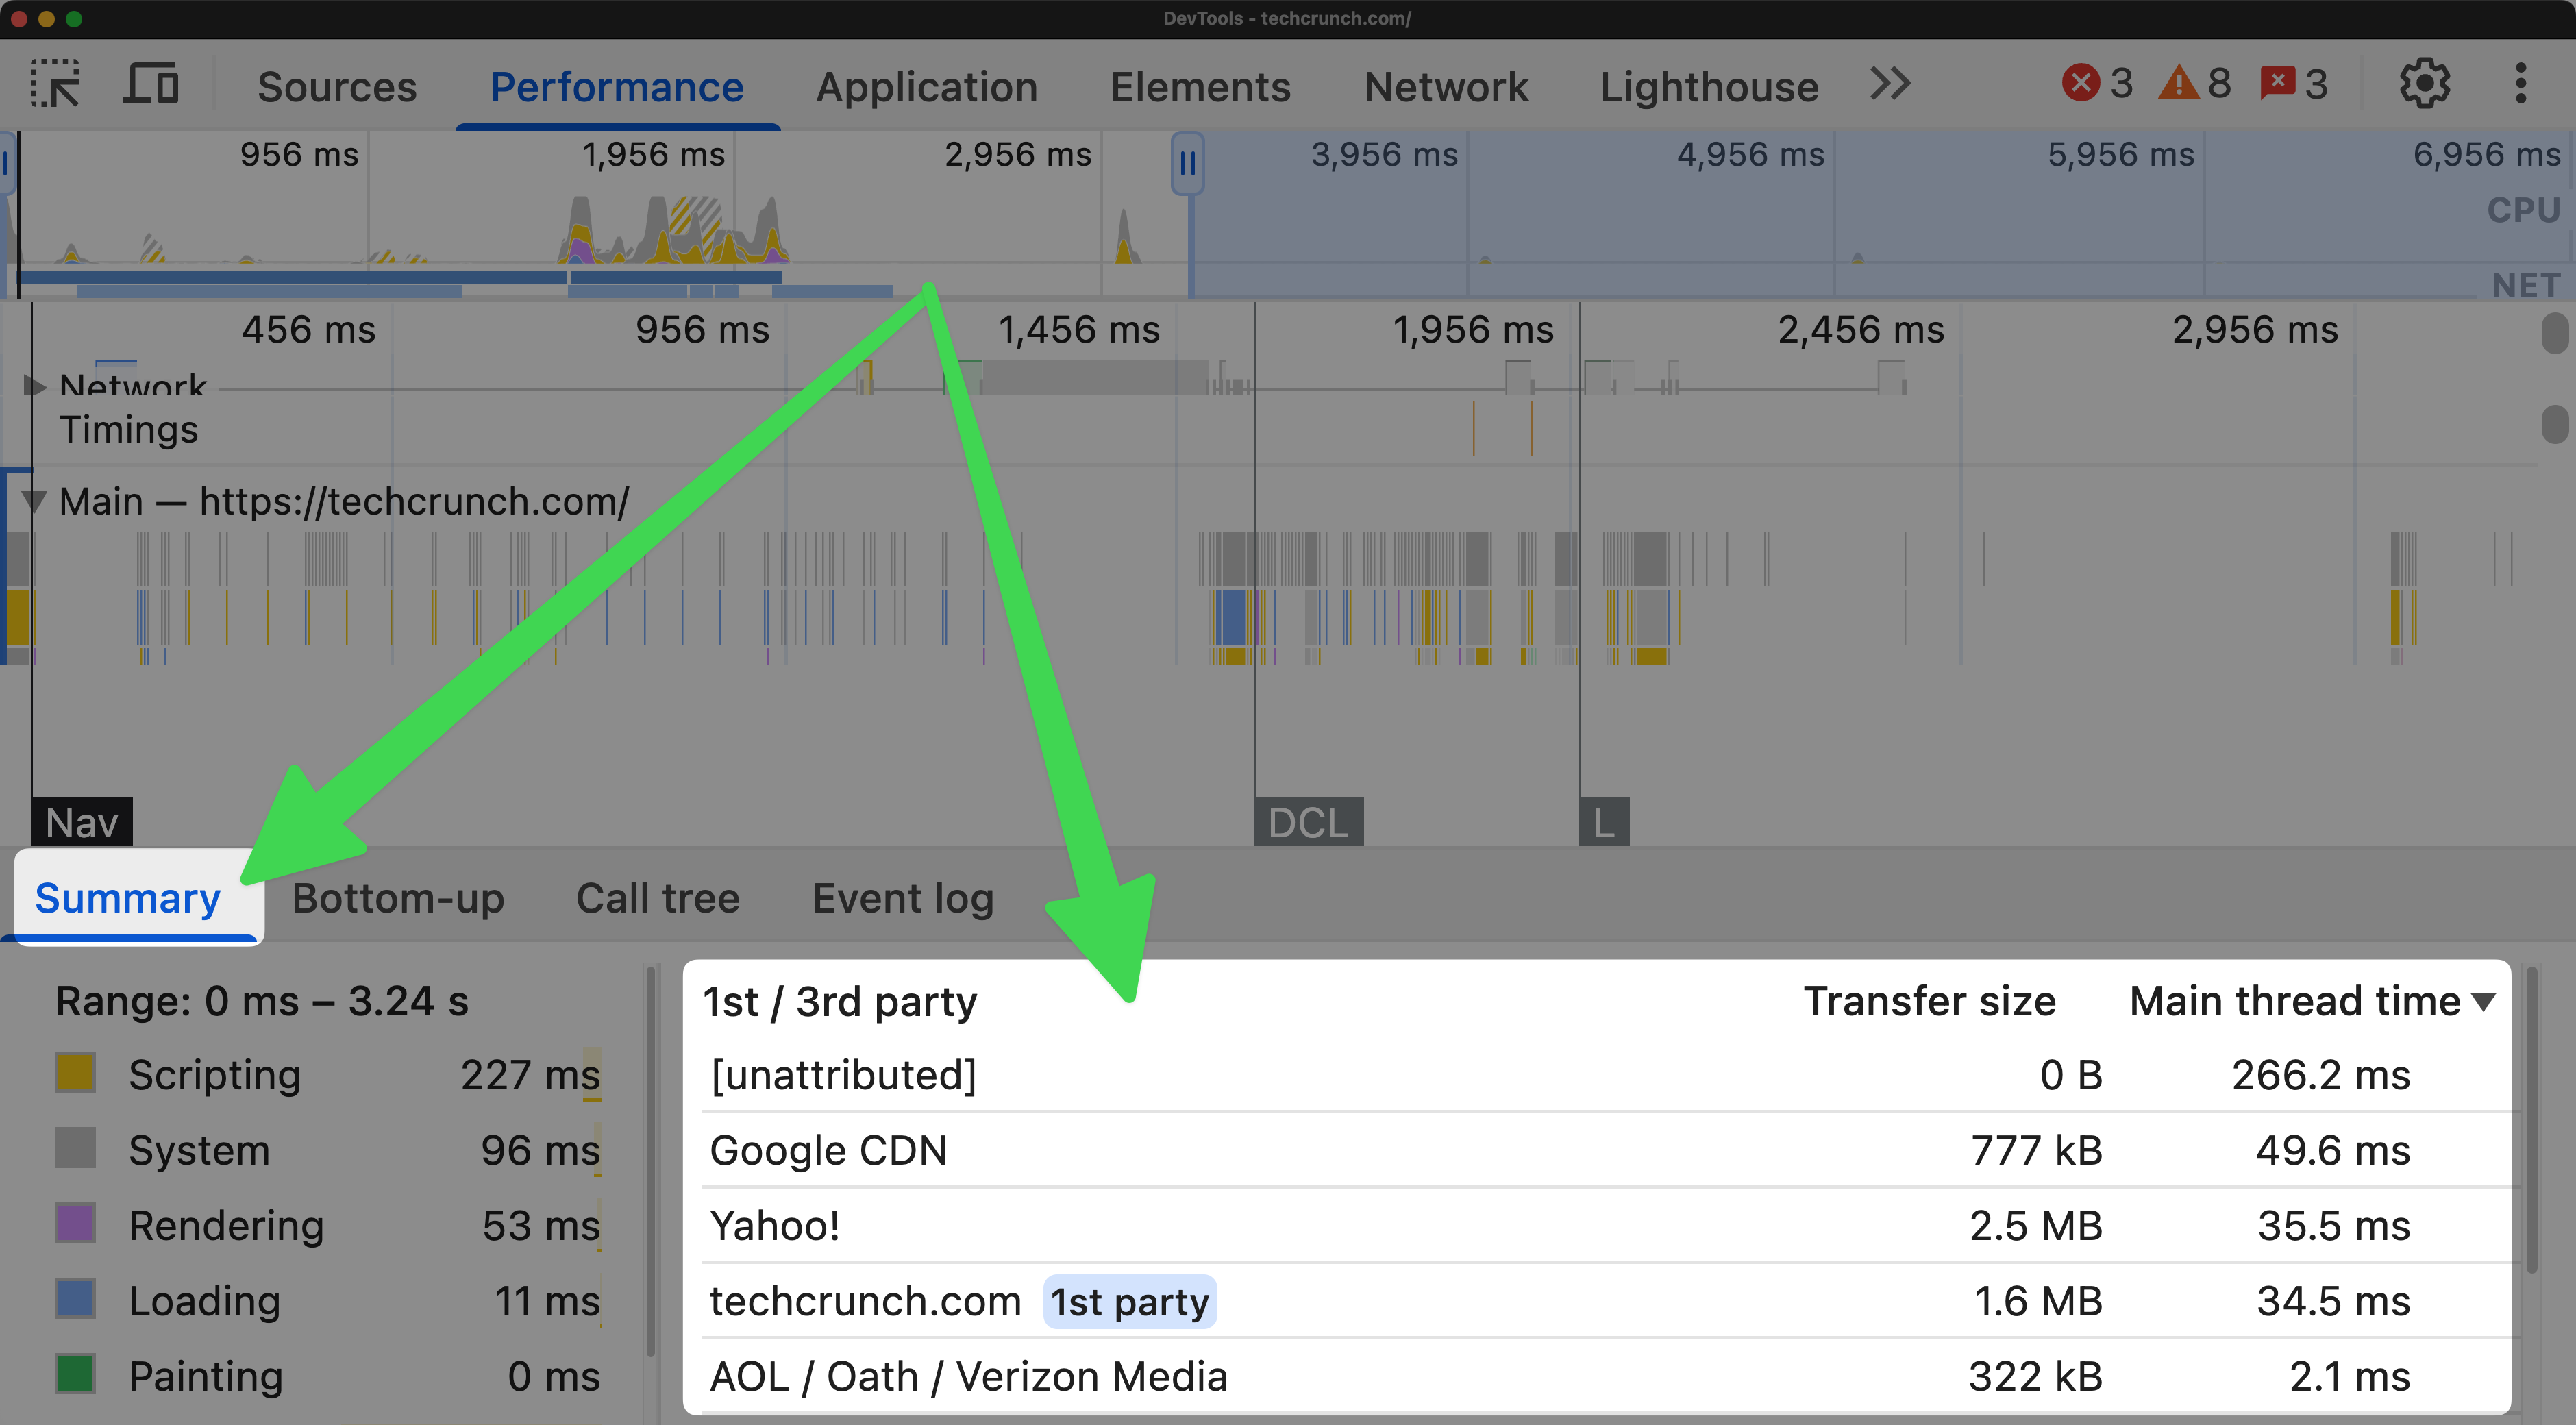
The Dim 3rd parties option in the Performance panel settings lets you hide third-party activity, so you can focus on your own code.
See the before and after of this feature by dragging the slider below:
Why is this useful
When debugging performance issues, you need to distinguish between problems in your code versus those caused by third-party scripts like analytics or ad providers. This feature lets you separate these concerns.
How to use it
-
Record a performance trace of the techcrunch.com home page, from within the Performance panel
tipGood performance testing workflows mean throttling your network and CPU but also going into an incognito browsing window to ensure that browser extensions aren't adding noise to your performance recordings.
-
Find the new first-party/third-party breakdown table in the Summary pane
-
Hover over different groups (e.g. Yahoo, Google CDN, Hubspot) to see relevant events highlighted in the flame chart
-
Check "Dim 3rd parties" in the Settings section within the Performance Panel to focus only on your code
Why we like this
We spend a lot of time distinguishing between first-party and third-party code issues. This feature saves us time by automatically categorizing performance data, helping us to quickly identify whether optimizations are needed in our customers' code or in their third-party scripts.
Test Your Site Without Third-Party Cookies
With privacy changes affecting the web, it's important to test how your site functions when third-party cookies are blocked. The new Privacy and Security panel lets you simulate these scenarios without changing Chrome's settings.
From within the Privacy and Security panel, you can also:
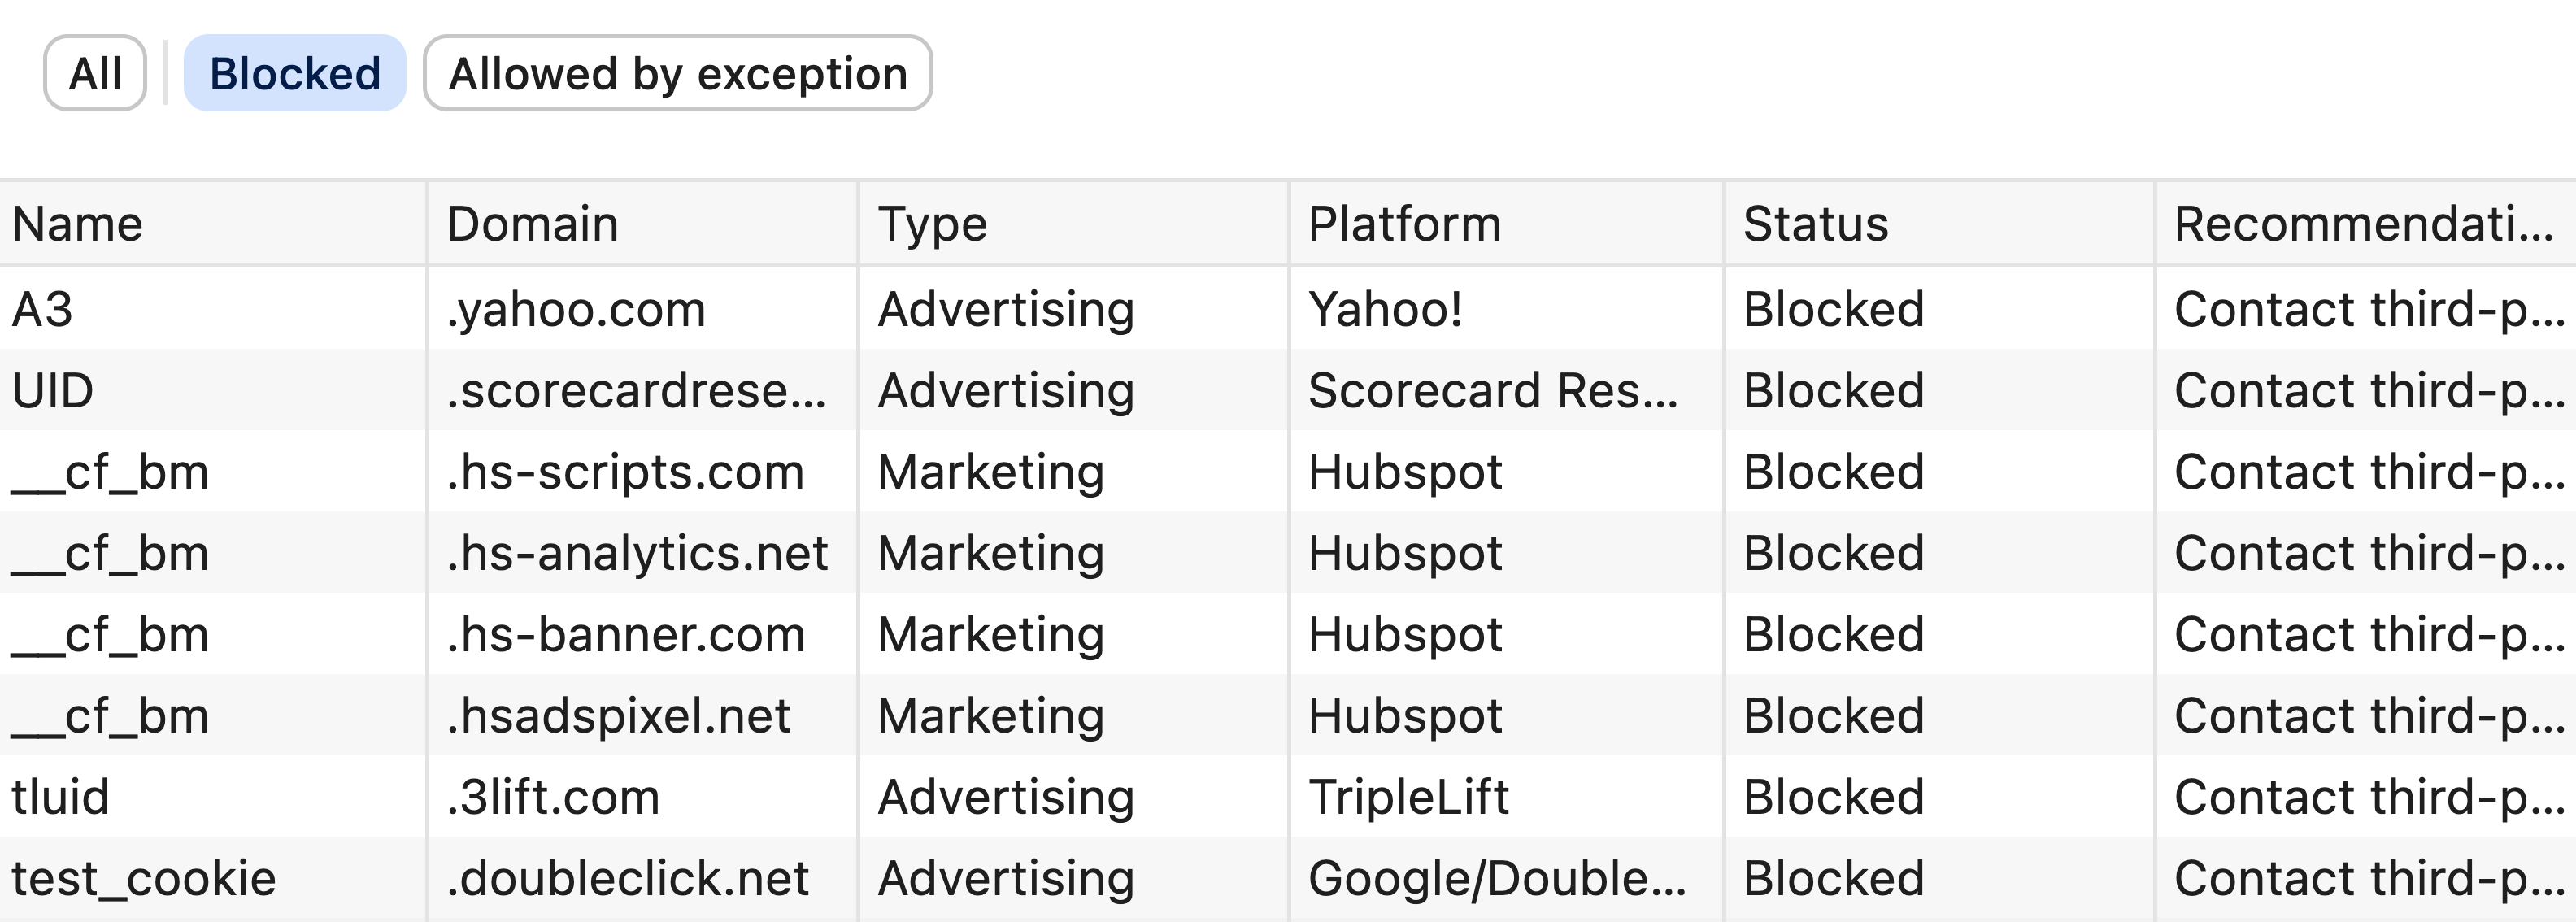
- View the third-party cookies blocked or allowed by the browser
- View security information about the current page, like information about the SSL certificate
Why is this useful
Significant privacy changes are happening in the web ecosystem. This feature helps you identify issues before they affect real users, letting you validate that your site continues to function correctly when third-party cookies are blocked.
How to use it
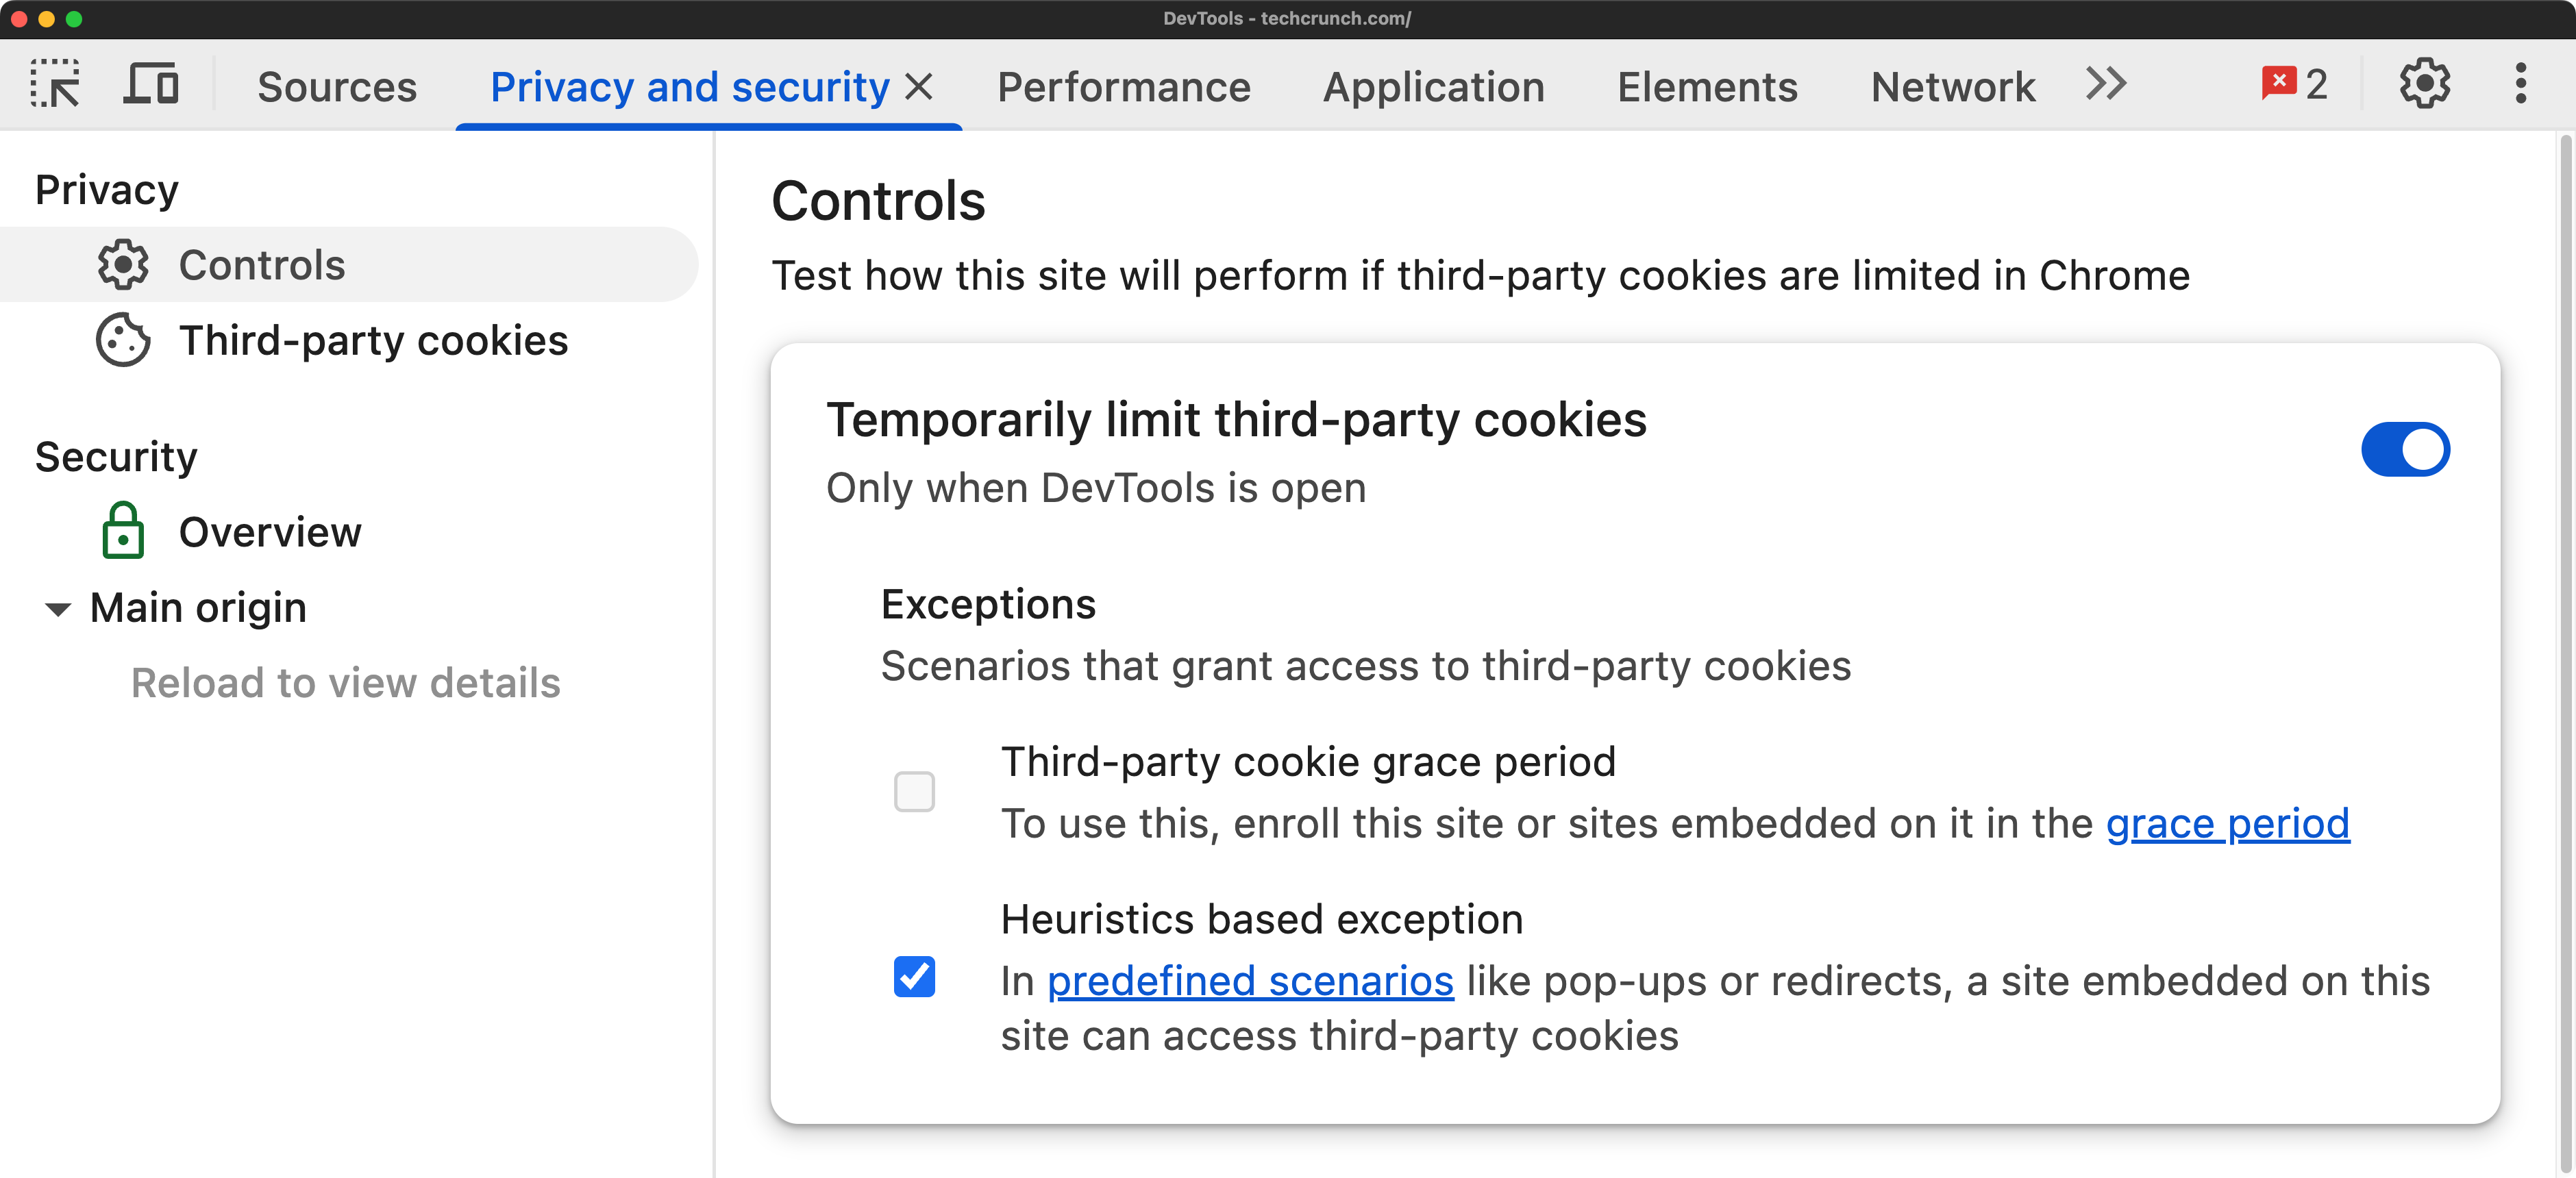
- Navigate to the Privacy and Security panel in DevTools
- From the Controls tab, toggle the option to limit third-party cookies
- Reload the page to test behavior
- Review the table showing which cookies were blocked or exempted, from the third-party cookies tab
Why we like this
We think this feature simplifies testing without requiring you to change global browser settings. But the real value for us is in monitoring how third-party cookies (and code) affect web page performance. Especially during page load when third-party scripts initialize, scan for cookies, make network requests, and do other operations.
Simulate Real-World Devices with Custom Performance Settings
Performance testing can be highly variable depending on your development machine. The new calibrated CPU throttling feature creates more realistic device simulations tailored to the capabilities of your computer.
Why is this useful
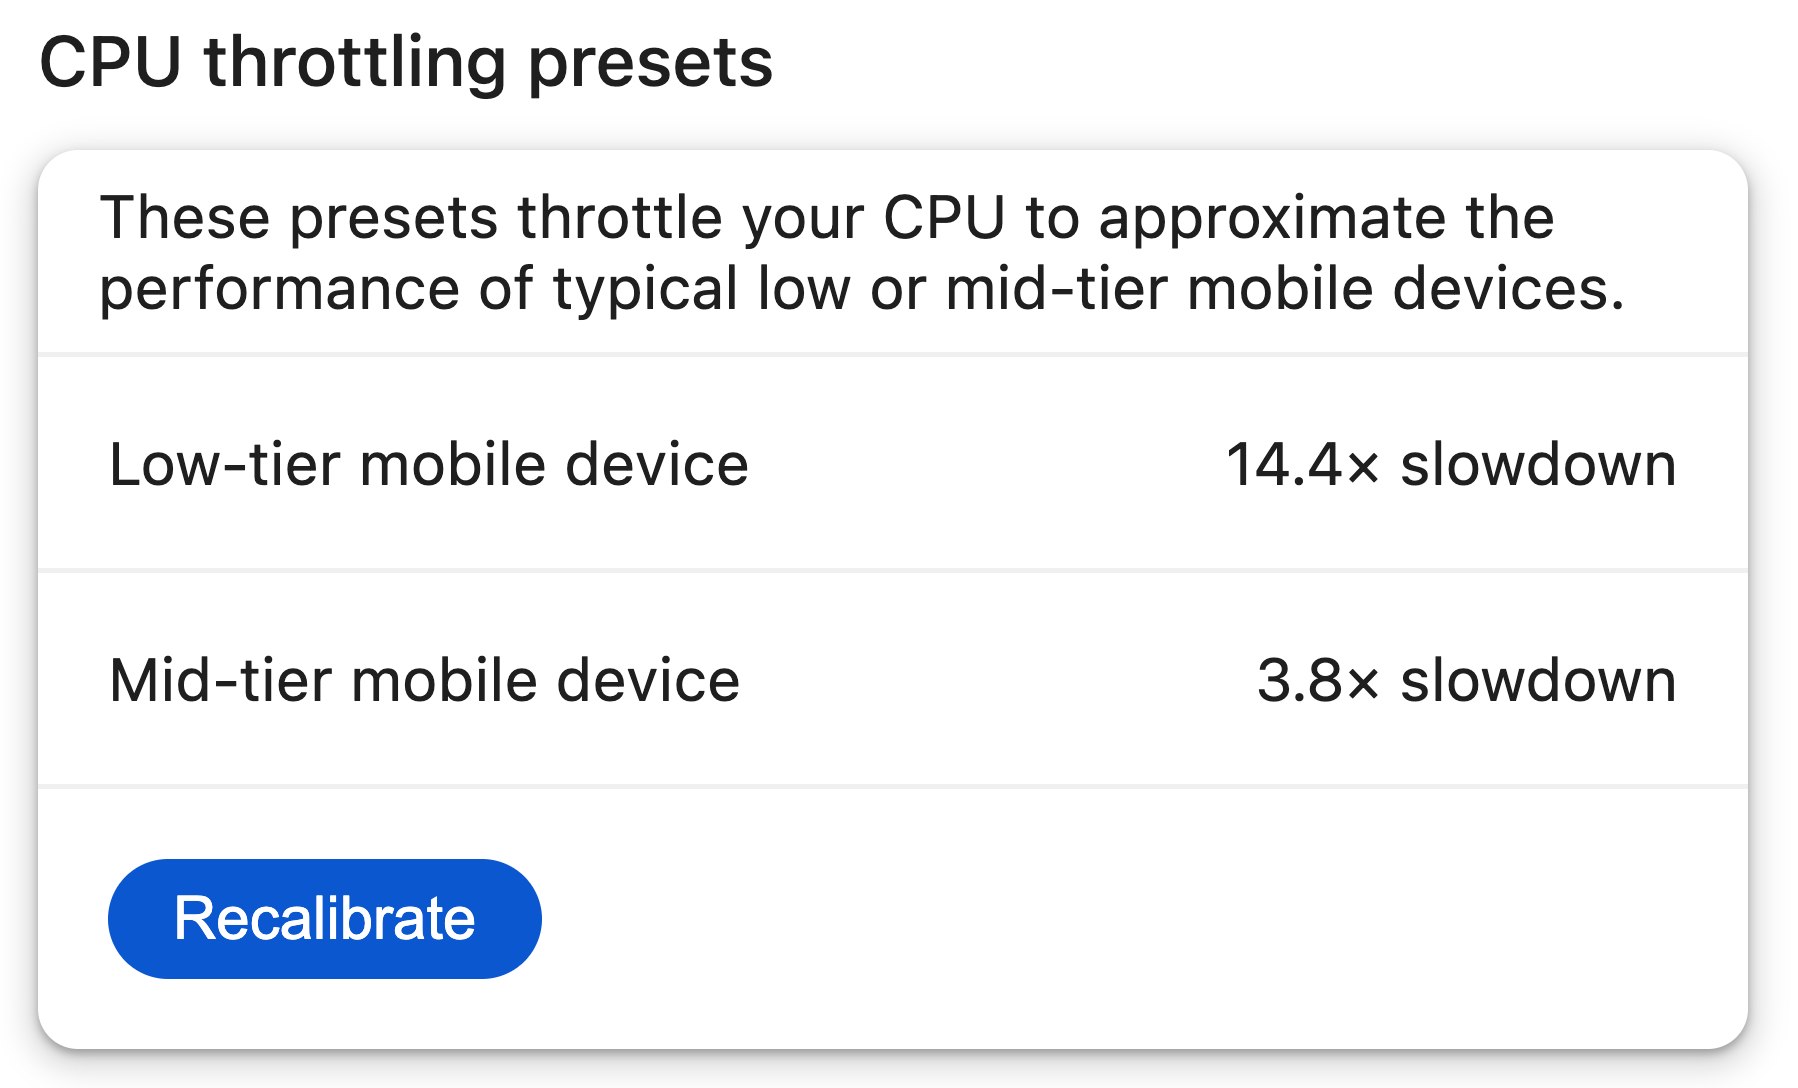
Generic performance throttling doesn't accurately represent real-world conditions. Calibrated throttling generates settings specific to your development machine, creating more realistic simulations of how your site will perform on actual low and mid-tier devices.
How to use it
-
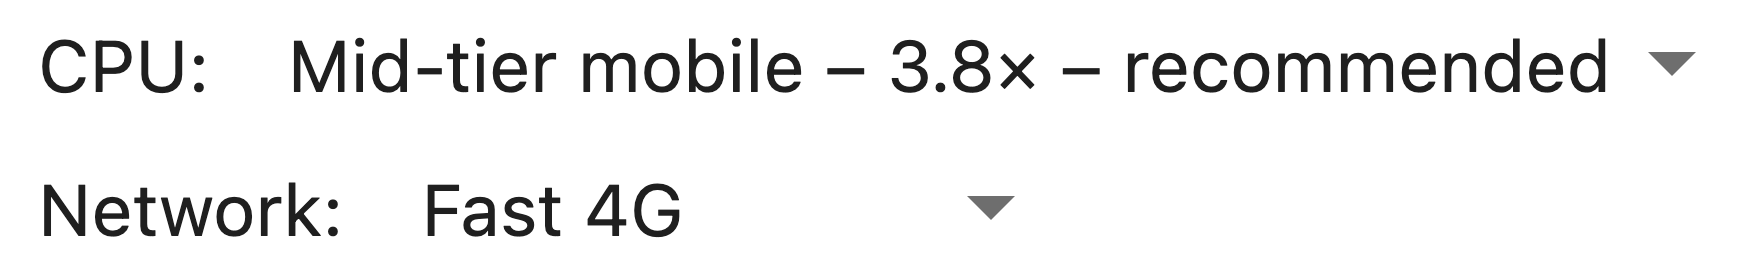
Click the Settings cog in the Performance panel within DevTools
-
Select "Calibrate" or "Recalibrate" from the CPU Throttling dropdown
-
Continue with the calibration process and wait for DevTools to calculate appropriate slowdown rates
-
Return to the Performance panel to use your new calibrated throttling options
Why we like this
As performance engineers, we were never certain about the usual 4x, 6x, and 20x presets. Which one should we use, especially when testing on different machines?
This calibrated approach gives us more confidence in performance tests, as they're tailored to create realistic simulations based on our actual hardware. This leads to more reliable performance audits and optimization recommendations.
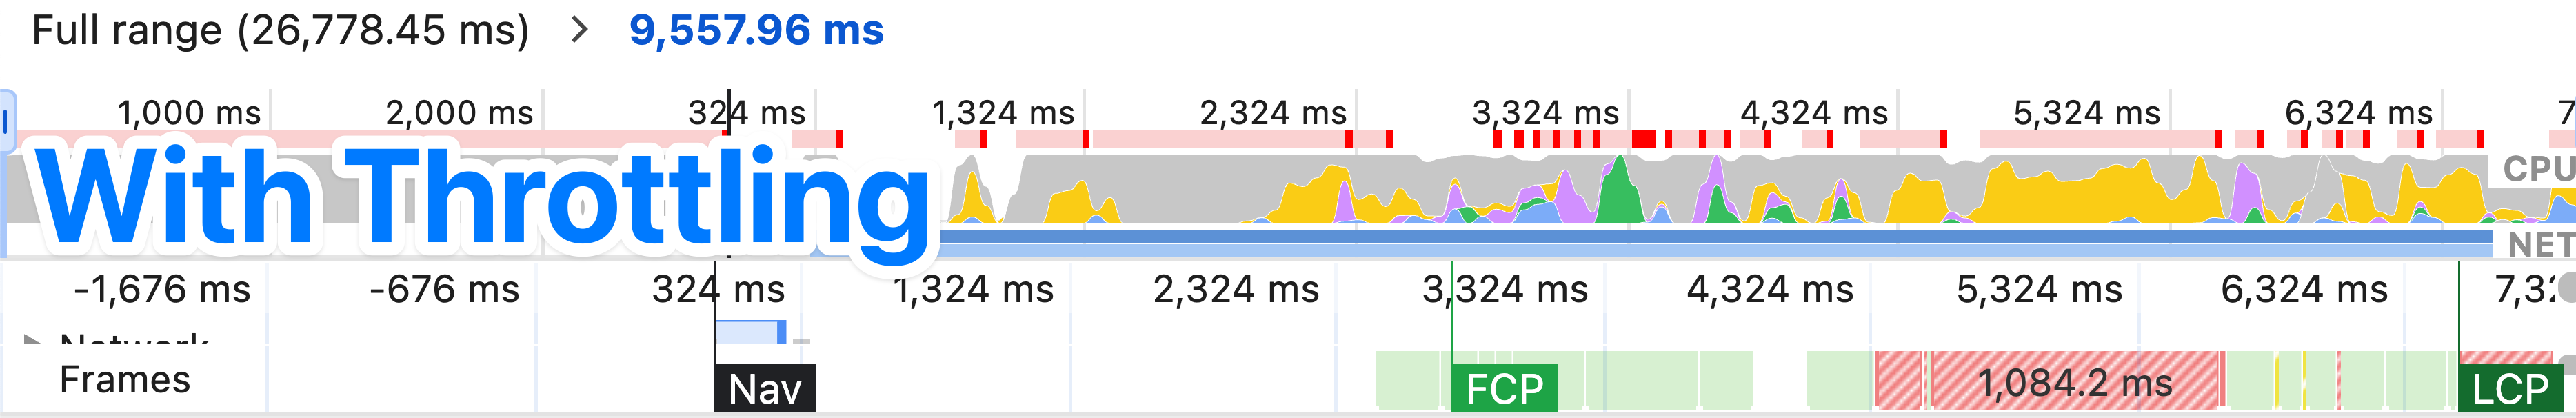
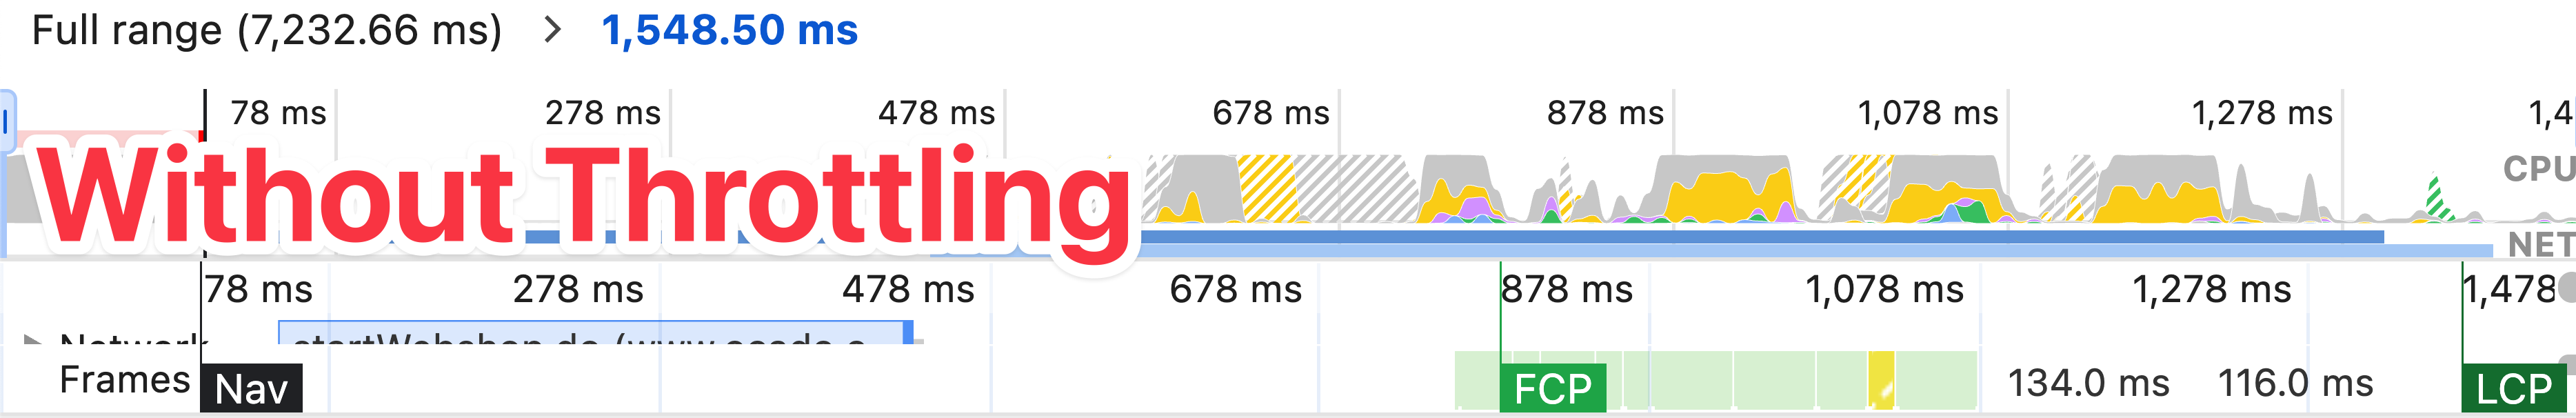
During development of your website, it's important to enable CPU throttling and network throttling to simulate real-world conditions. You likely have a fast development machine, but your users might not.
Consider this before and after comparison. Without any throttling (left), the page reaches LCP in just 1.5 seconds. But when we enable throttling (right) to simulate real-world conditions, the same page takes 6.5 seconds to reach LCP! This huge difference shows why testing with throttling is critical - your actual users may experience your site much slower than you do during development.
Get AI-Powered Insights for Performance Recordings
AI assistance now helps analyze performance recordings, providing intelligent suggestions and allowing you to have conversations about different performance events in a single chat session.
Why is this useful
The flame chart contains huge amounts of data that can be overwhelming to investigate. AI assistance helps interpret this data, identify patterns, and suggest optimizations you might have missed.
How to use it
- Record a performance trace from the DevTools Performance panel
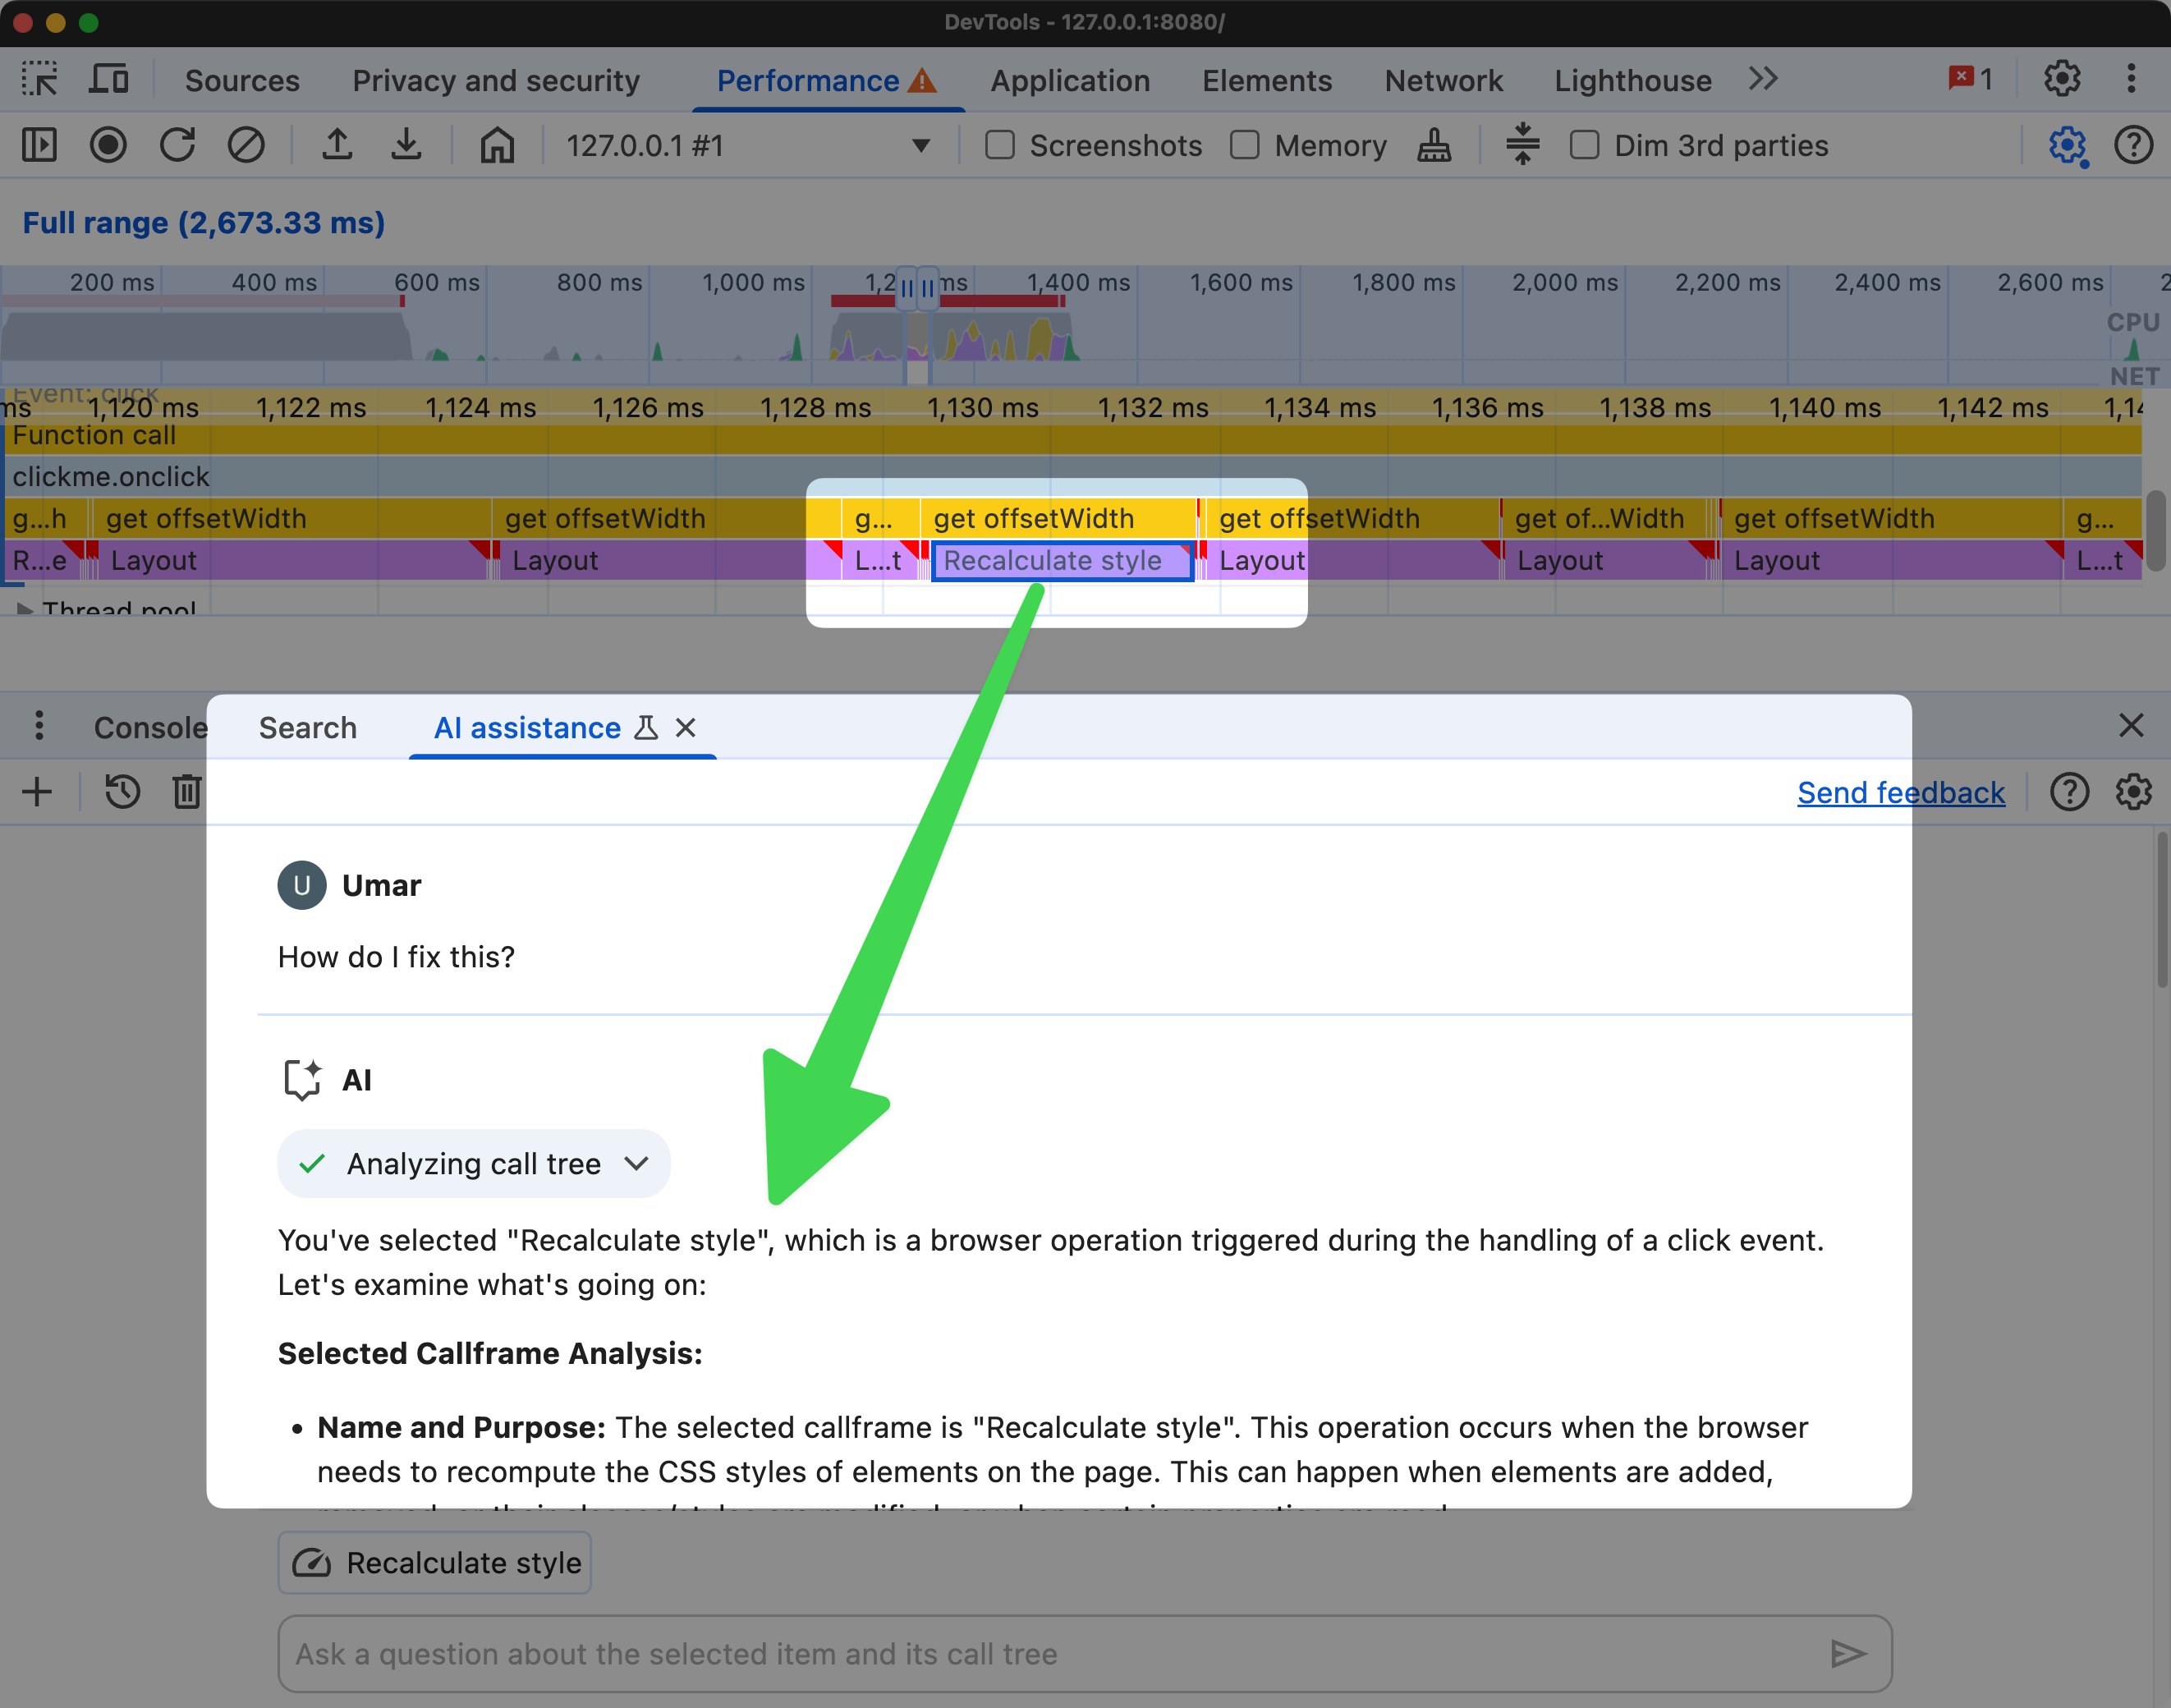
- Right click on an event in the flame chart and select "Ask AI" to start a chat session
- Ask a question from the "AI Assistance" panel to get insights about the selected event
- (Optional) Without starting a new chat, you can select different events to analyze them in the same conversation
Why we like this
Not everyone on a team may have deep performance knowledge, but with AI assistance, more developers can identify and fix performance issues.
Detect Layout Thrashing That's Slowing Your Page
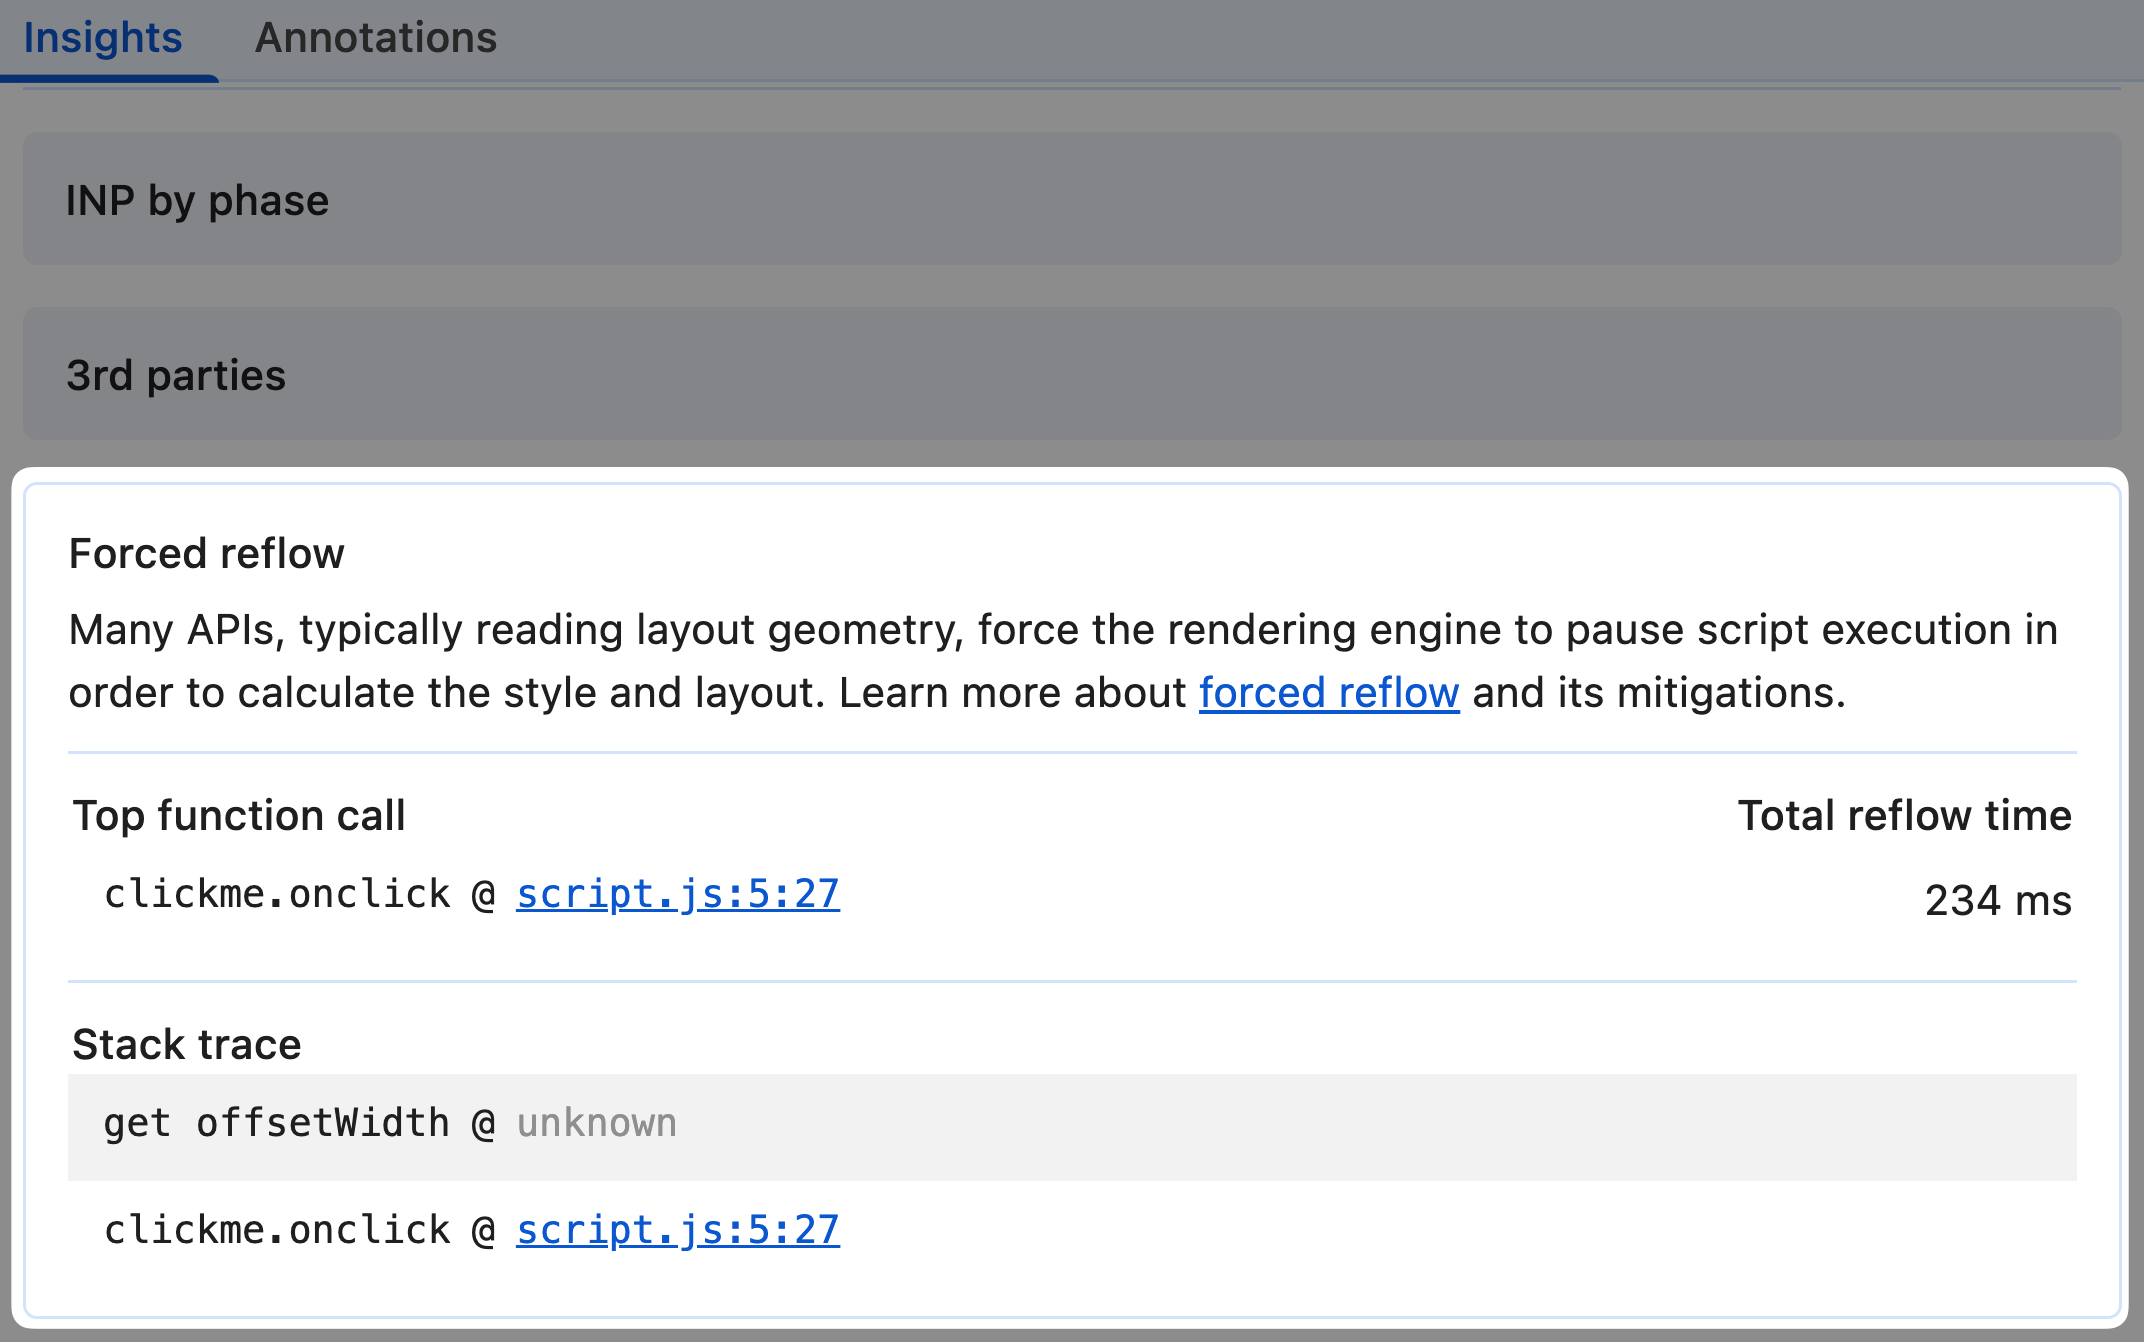
Layout thrashing (forced reflow) is a common performance problem that happens when JavaScript repeatedly forces the browser to recalculate styles and layout. The new forced reflow insight makes these issues easy to spot.
Why is this useful
Layout thrashing impacts render performance, and can affect your Interaction to Next Paint (INP) score. Finding these issues used to require careful inspection of performance recordings, but now they're automatically highlighted.
How to use it
-
Navigate to this Codepen demo
-
Throttle your CPU to 20x slowdown (or 6x) in the Performance panel
-
Record a performance trace in the Performance panel while you click the "Click me" button, then stop the recording
-
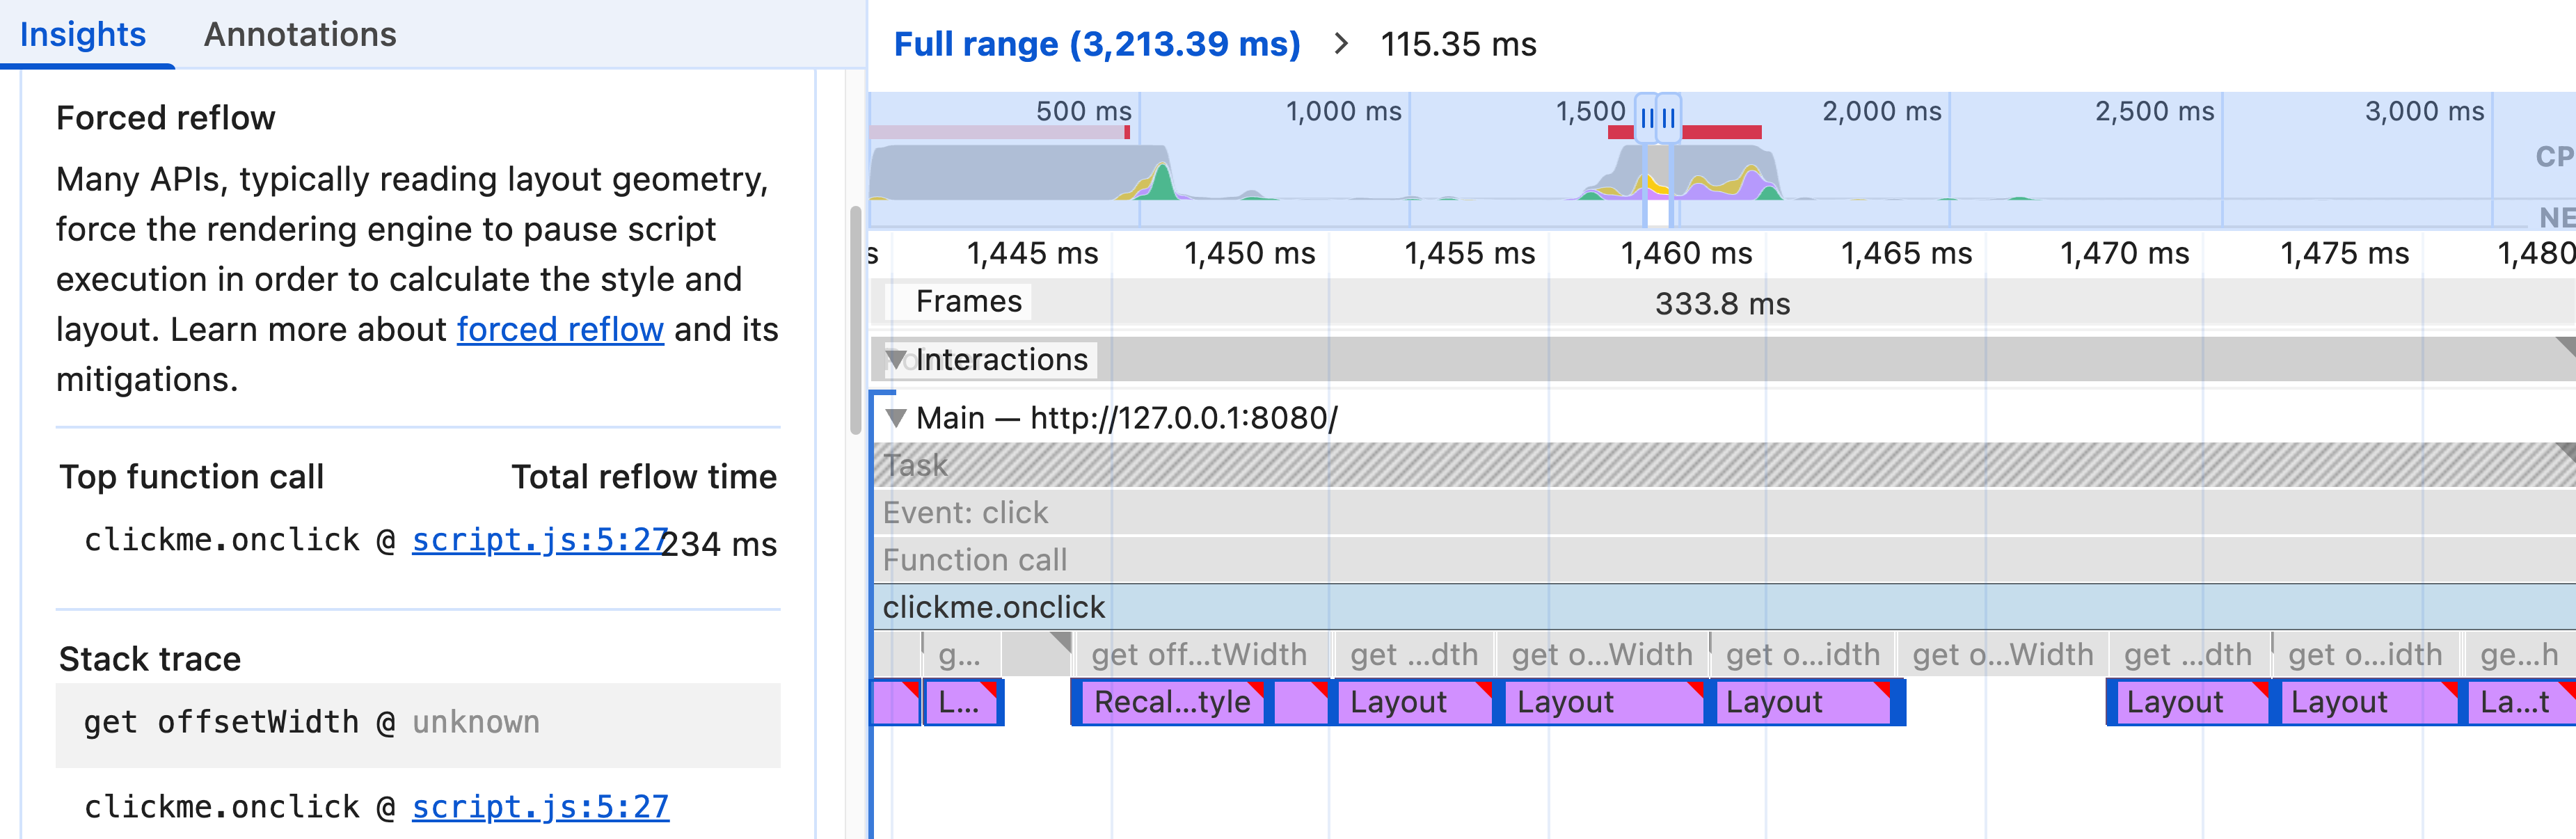
Open the "Forced Reflow" insight in the Performance panel sidebar
-
Hover over the stack trace to understand which events, as shown with the flame chart, lead to layout thrashing
Why we like this
This feature makes these previously hard-to-find issues immediately visible. It's particularly valuable when working with React applications where layout thrashing can be hidden in component lifecycle methods.
Add Custom Tracks to Performance Recordings
Custom tracks make it easier to track specific events and timings in your performance recordings, helping you correlate application events with performance data.
Why is this useful
When analyzing complex web applications, it's difficult to connect what you see in performance recordings with specific events in your code. Custom tracks help you understand what was happening in your application at different points in the recording.
How to use it
You can create separate tracks in the Performance panel by adding custom timing markers to your code:
- Add this sample JavaScript code to your application. Have it run in a response to a user interaction, like a click on a button:
function block() {
const start = Date.now();
while (Date.now() < start + 500) {}
}
console.timeStamp("start");
block();
console.timeStamp("end");
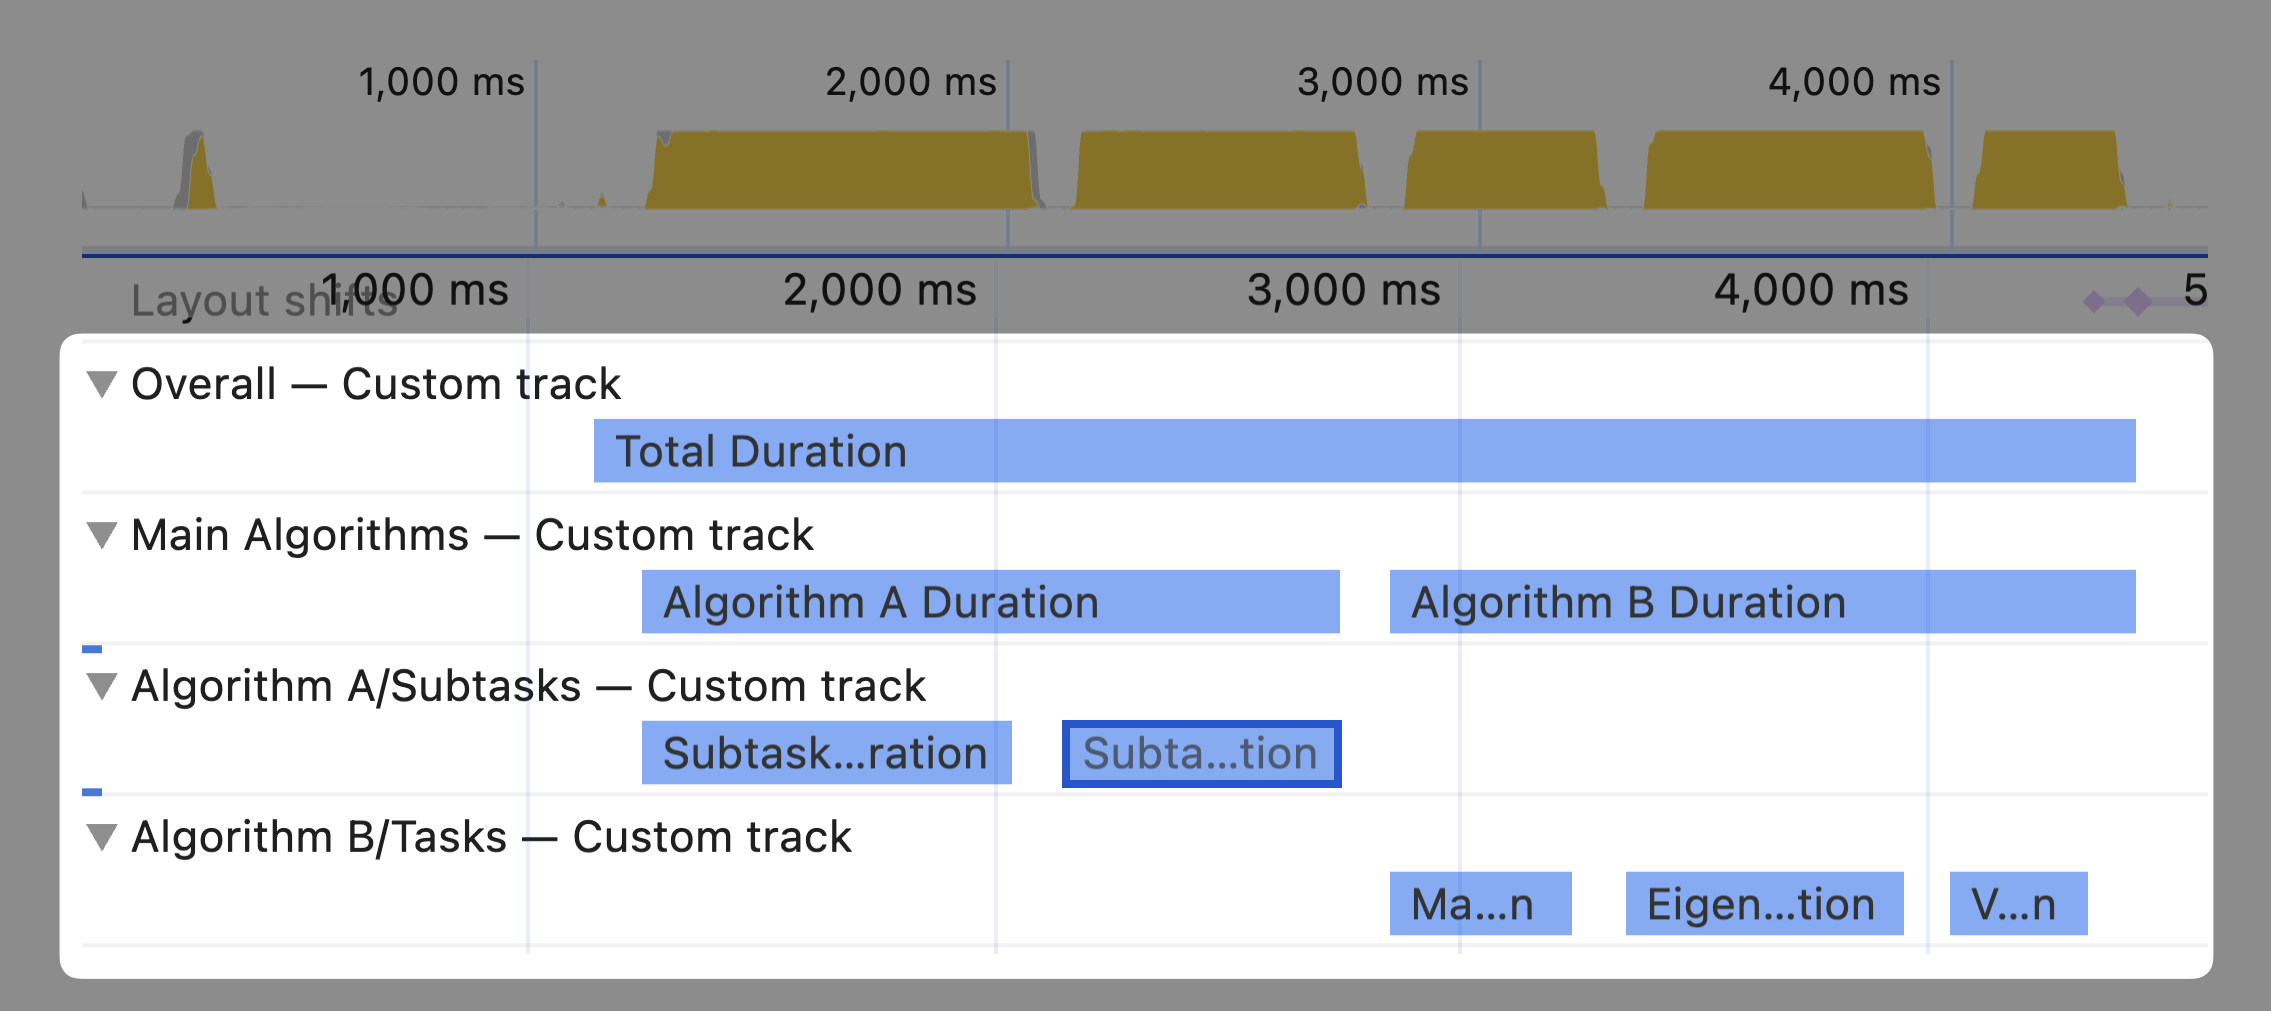
console.timeStamp("My Operation", "start", "end", "MyTrack");
- Record a performance trace in the Performance panel, while clicking the button you configured in step 1
- Open up the "MyTrack" section in the Performance panel to see the custom marker
Why we like this
These custom markers aid debugging sessions by creating clear visual references in performance recordings. This is especially helpful when working with frameworks that have complex rendering lifecycles.
Easily Spot Scrollable Areas with Helpful Visual Indicators
Why is this useful
Ever been frustrated by hidden scrollbars or unexpected scroll areas? They can create confusing user experiences and tricky layout bugs. This new feature helps you spot elements with overflow: auto or overflow: scroll that contain content spilling outside their bounds.
How to use it
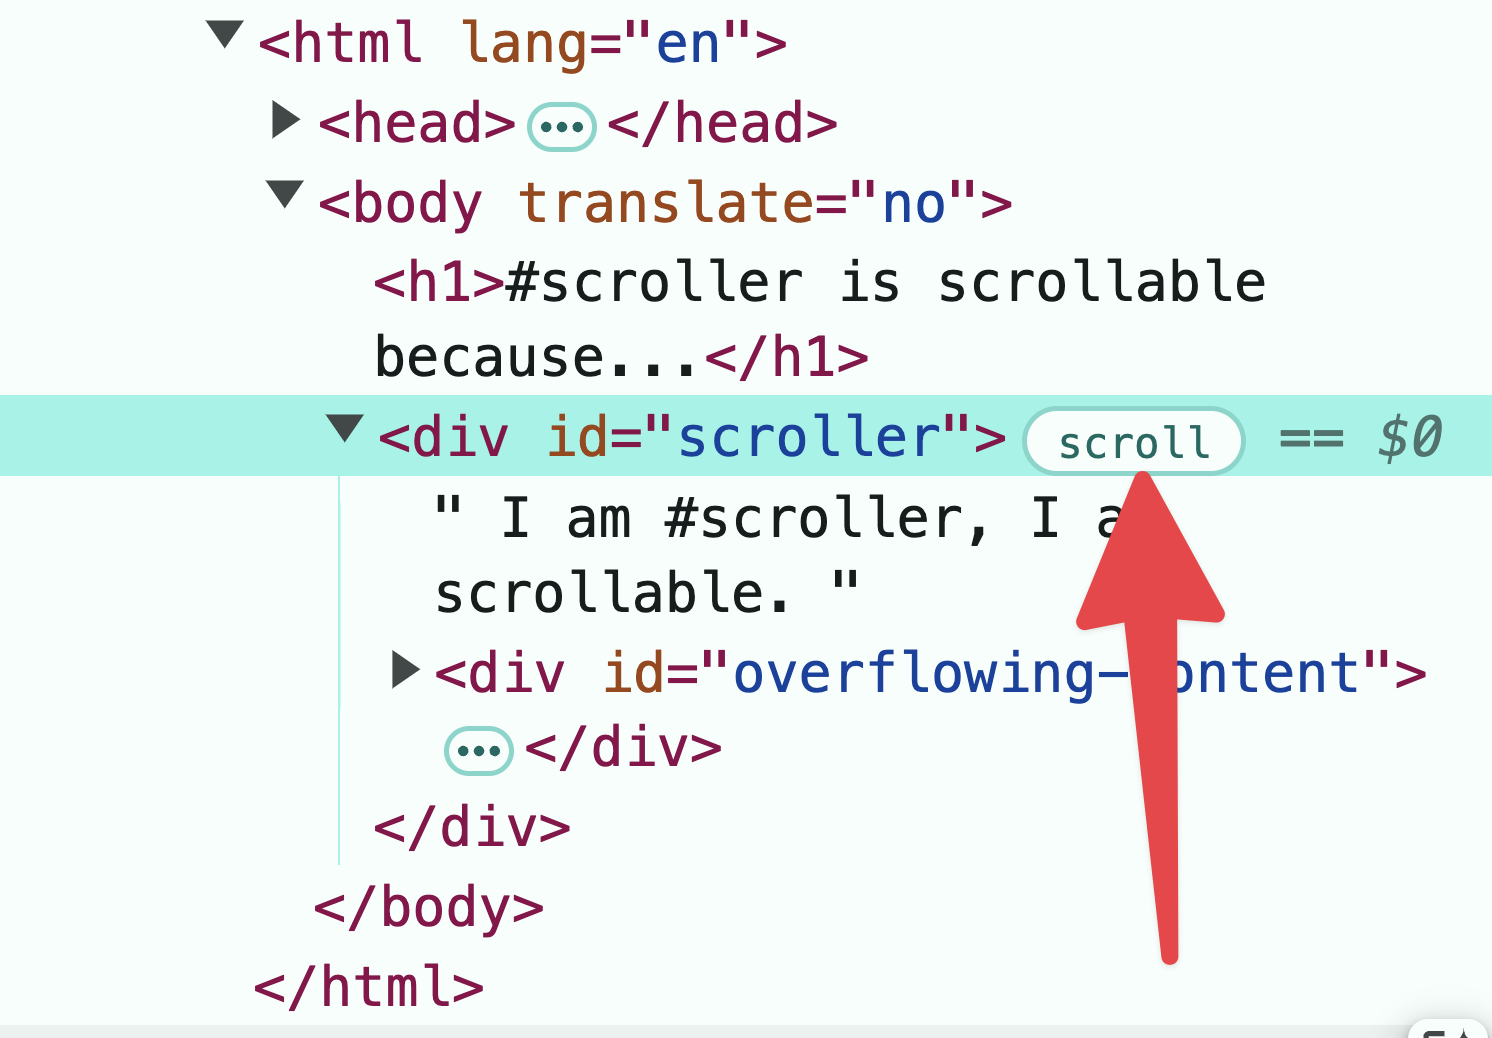
- Right Click > Inspect the
#scrollerelement in this CodePen demo - Notice that the element is marked with the "scroll" badge
Why we like this
We've spent hours debugging mysterious scrollbars and overflow issues. This simple visual indicator saves time during debugging.
Pro tip: There are a number of interesting badges you can enable:
- Right click on the DOM tree in the Elements panel
- Enable the "Badges" from the Badge settings menu
Conclusion
These new features in Chrome DevTools represent a step forward for web developers.
In this post, you learnt about new features that help you:
- Identify and fix performance bottlenecks: For example, by optimizing large DOM trees.
- Focus on first-party code: By filtering out third-party scripts.
- Test your site without third-party cookies: To ensure your site functions correctly in a privacy-first world.
- Simulate real-world devices: With calibrated CPU throttling.
- And more.
We've got some other useful posts on DevTools: