Performance budgets help your business stay on top of web performance, ensure a good user experience, and optimize SEO.
This article explains how performance budgets work and how you can implement them in practice.

What are performance budgets?
Budgets place limits on the the amount of resources used by your website, and define minimums on how quickly it has to load.
Here are some examples of site speed budget that your team could set:
- The Largest Contentful Paint should be below 2 seconds
- The Lighthouse Performance score should be over 90
- The download size of images on the page should be below 1 MB
Why use performance budgets?
Having agreed on these limits allows you to think about how you want to spend your resources. Do you want to include an A/B testing script, or is it more important to load a web font that matches your company brand?
Budgets make performance a priority early on and ensure that the trade-offs of new functionality are considered throughout the lifetime of the project. They protect you against regressions as your website changes over time.
Catching regressions with performance budgets
Performance regressions are often gradual or unexpected.
Gradual regressions happen slowly over time. You add a small tracking script, or include another 5 kilobyte JavaScript library in your app. If you monitor your site speed you won't see a big jump in your metrics, but over time these changes add up and it will be difficult to pinpoint the cause.
Unexpected regressions happen when people make changes without being aware of the site speed impact. For example, when your marketing team uploads a 5 megabyte background image they might assume that your server will compress it before serving it to a user. If you don't consistently check your site performance this could go undetected for months.
Performance budgets establish clear thresholds that automated tools can use to decide whether a change is ok or whether it exceeds the resource limits you've set.
What happens when a performance budget is exceeded?
Your team notices, takes a closer look, and decides what to do next. Performance budgets aren't meant to create annoying roadblocks, but instead ensure that your team works with performance in mind.
For example, when running into a performance issues you might:
- fix the issue, for example by compressing an image before uploading it
- revert a change once you know how costly it is, for example a new third-party script that isn't essential
- go ahead with the change as planned, but schedule future work to optimize elsewhere and get back under your budget
- decide that the change is important enough to accept slightly worse performance and bump your budgets
How to select performance metrics
What metrics should you look at when evaluating your website, and which ones are a good fit for budgeting?
Core Web Vitals
The Core Web Vitals are a set of modern performance metrics defined by Google.
They are a great starting point for a performance budget because:
- they focus on user experience
- your SEO team is already looking at them
- there are established metric values to aim for
- Google is pushing them, and accordingly Web Vitals are well-supported by Lighthouse and other tools
However, these metrics can also vary a lot between tests, making it hard to say for sure if performance has become worse.
Resource sizes and counts
A more technical way to define a performance budget is to set limits on the network requests made by the page.
Some examples:
- the page should not load more than 200 kilobytes of JavaScript
- the page should not make more than 10 image requests
These metrics are extremely easy to measure consistently. While it might sometimes take 1.24 seconds to render your site and sometimes 1.31 seconds, your site will usually make a consistent number of network requests of a certain type.
The flip side is that they don't necessarily mean a lot to your users. Your budget will fail whether you add 200 kilobytes of render-blocking JavaScript, or whether you initialize ("hydrate") a calculator app after the whole page has already rendered.
Custom metrics
The Core Web Vitals can be measured for every web page. However, they sometimes don't capture what's really important to your users.
For example, on an article page loading the web font for the h1 tag will be more important than that a background image has fully finished fading in.
In these cases you can use the User Timing API to mark the time when the most important page element on your website has been rendered.
One downside of custom metrics is that fewer tools support them.
How to select metric thresholds
Now that you know what metrics you care about, how do you decide where to set the budget thresholds?
If you already have a site in production, start where the metrics are right now and focus on preventing regressions.
You can define performance goals for the future separately, and after you implement optimizations you can lower the budgets further.
An exception to this might be if you run into particularly large performance issues and are willing to consider larger architectural changes. Then it might make more sense to take the approach for new websites described below.
When starting a new website, start by thinking about who your users are and how important it is that your website loads quickly.
- What's the purpose of your website? Are you building a content website where users come in via search and want to quickly skim your articles? Or are you building an app that users will use for 15 minutes at a time?
- What kind of devices do your users use, and what does their network connection look like? What do network bandwidth and latency look like on the low-end?
- How fast are your competitors?
Starting by looking at similar sites is the easiest way to find ambitious yet realistic performance goals for a new website.
However, you can also start by identifying a high-level goal, break it down into lower-level metric thresholds, and finally implement your solution with these goals in mind.
Example: working out concrete budgets from scratch
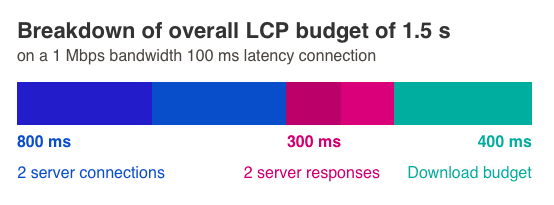
Let's say you're building a website with pages about different locations along a specific hiking route. Visitors will find the website via search. It is likely to be accessed from rural locations with and should load quickly even for users with 1 Mbps (125 kilobytes per seconds) of bandwidth and 100 milliseconds of network latency.
When collecting your performance data you can use the same network settings as for the user you're targeting. Then, for example, set the Largest Contentful Paint threshold to 1.5 seconds.

Now that we have this starting point we can work our way to more specific budgets. Let's say to show the page we need to load the HTML document and an image that's hosted on a different server.
That means we need to create 2 server connections. If each server connection requires 4 network round trips then this alone will take 800 milliseconds. Given this tight budget, we can say that we want our servers to respond to incoming requests within 150 milliseconds. Based on this we can set a budget for the Time to First Byte metric.
After creating the connections and waiting for the backend response we are left with 300 milliseconds to download the data. At 125 kilobytes per second that means we need to squeeze all content into, or 50 kilobytes. Based on this we could set an HTML budget of 10 kilobytes and an image budget of 40 kilobytes.
Having worked this out will inform technical decisions from the start.
Using Lighthouse for performance budgets
If you're using Google Lighthouse to test your website you can integrate performance budgets into your Lighthouse tests using the LightWallet feature.
To do this, you need to use Lighthouse via the command-line interface and pass in the --budget-path parameter.
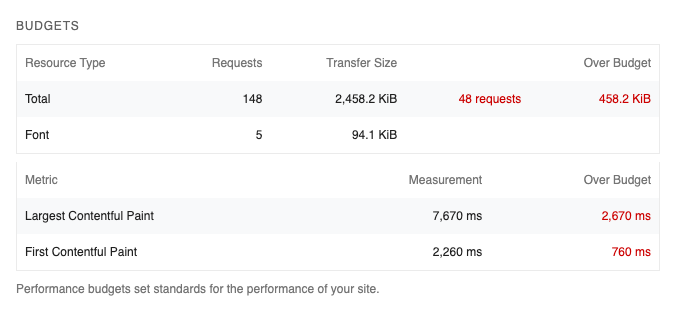
The budget is a JSON file with thresholds for different metrics. For example, we could save this as our budget.json file:
[
  {
    "timings": [
      {
        "metric": "first-contentful-paint",
        "budget": 1500
      },
      {
        "metric": "largest-contentful-paint",
        "budget": 5000
      }
    ],
    "resourceSizes": [
      {
        "resourceType": "total",
        "budget": 2000
      }
    ],
    "resourceCounts": [
      {
        "resourceType": "font",
        "budget": 5
      },
      {
        "resourceType": "total",
        "budget": 100
      }
    ]
  }
]
Then run Lighthouse and pass in the budget.
lighthouse --budget-path=./budget.json https://www.airbnb.co.uk --view
At the bottom of the Lighthouse Performance section you can now see the values for each of the metrics you've set a budget for, as well as information about any budgets that have been exceeded.
