RUM error monitoring, LCP optimization, better lab data exports, and more.
Here's what's new in DebugBear for October 2024.
RUM error monitoring
DebugBear now supports error monitoring for real user monitoring (RUM) customers. We're not just tracking performance metrics, but also JavaScript errors that occur on your website.
Error monitoring is disabled by default, but you can enable it as shown in the documentation.
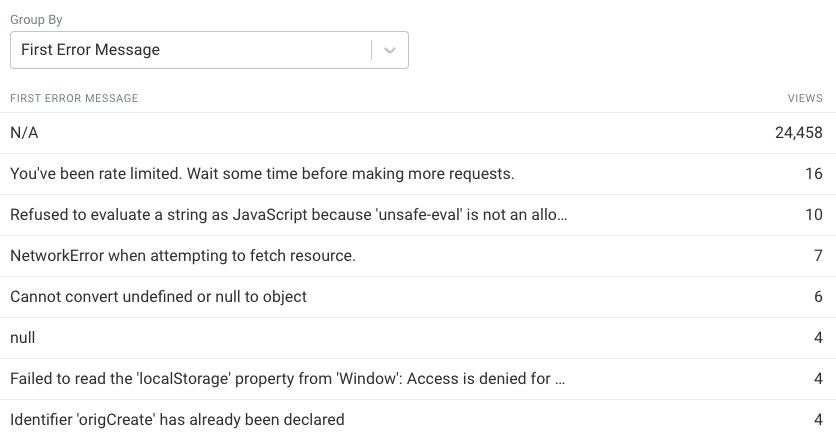
Error message grouping makes it easy to identify the most common errors on your website:
LCP Optimize Tab
We've added a new tab to the LCP section of Real User Monitoring. You can try it out here on our public demo website.
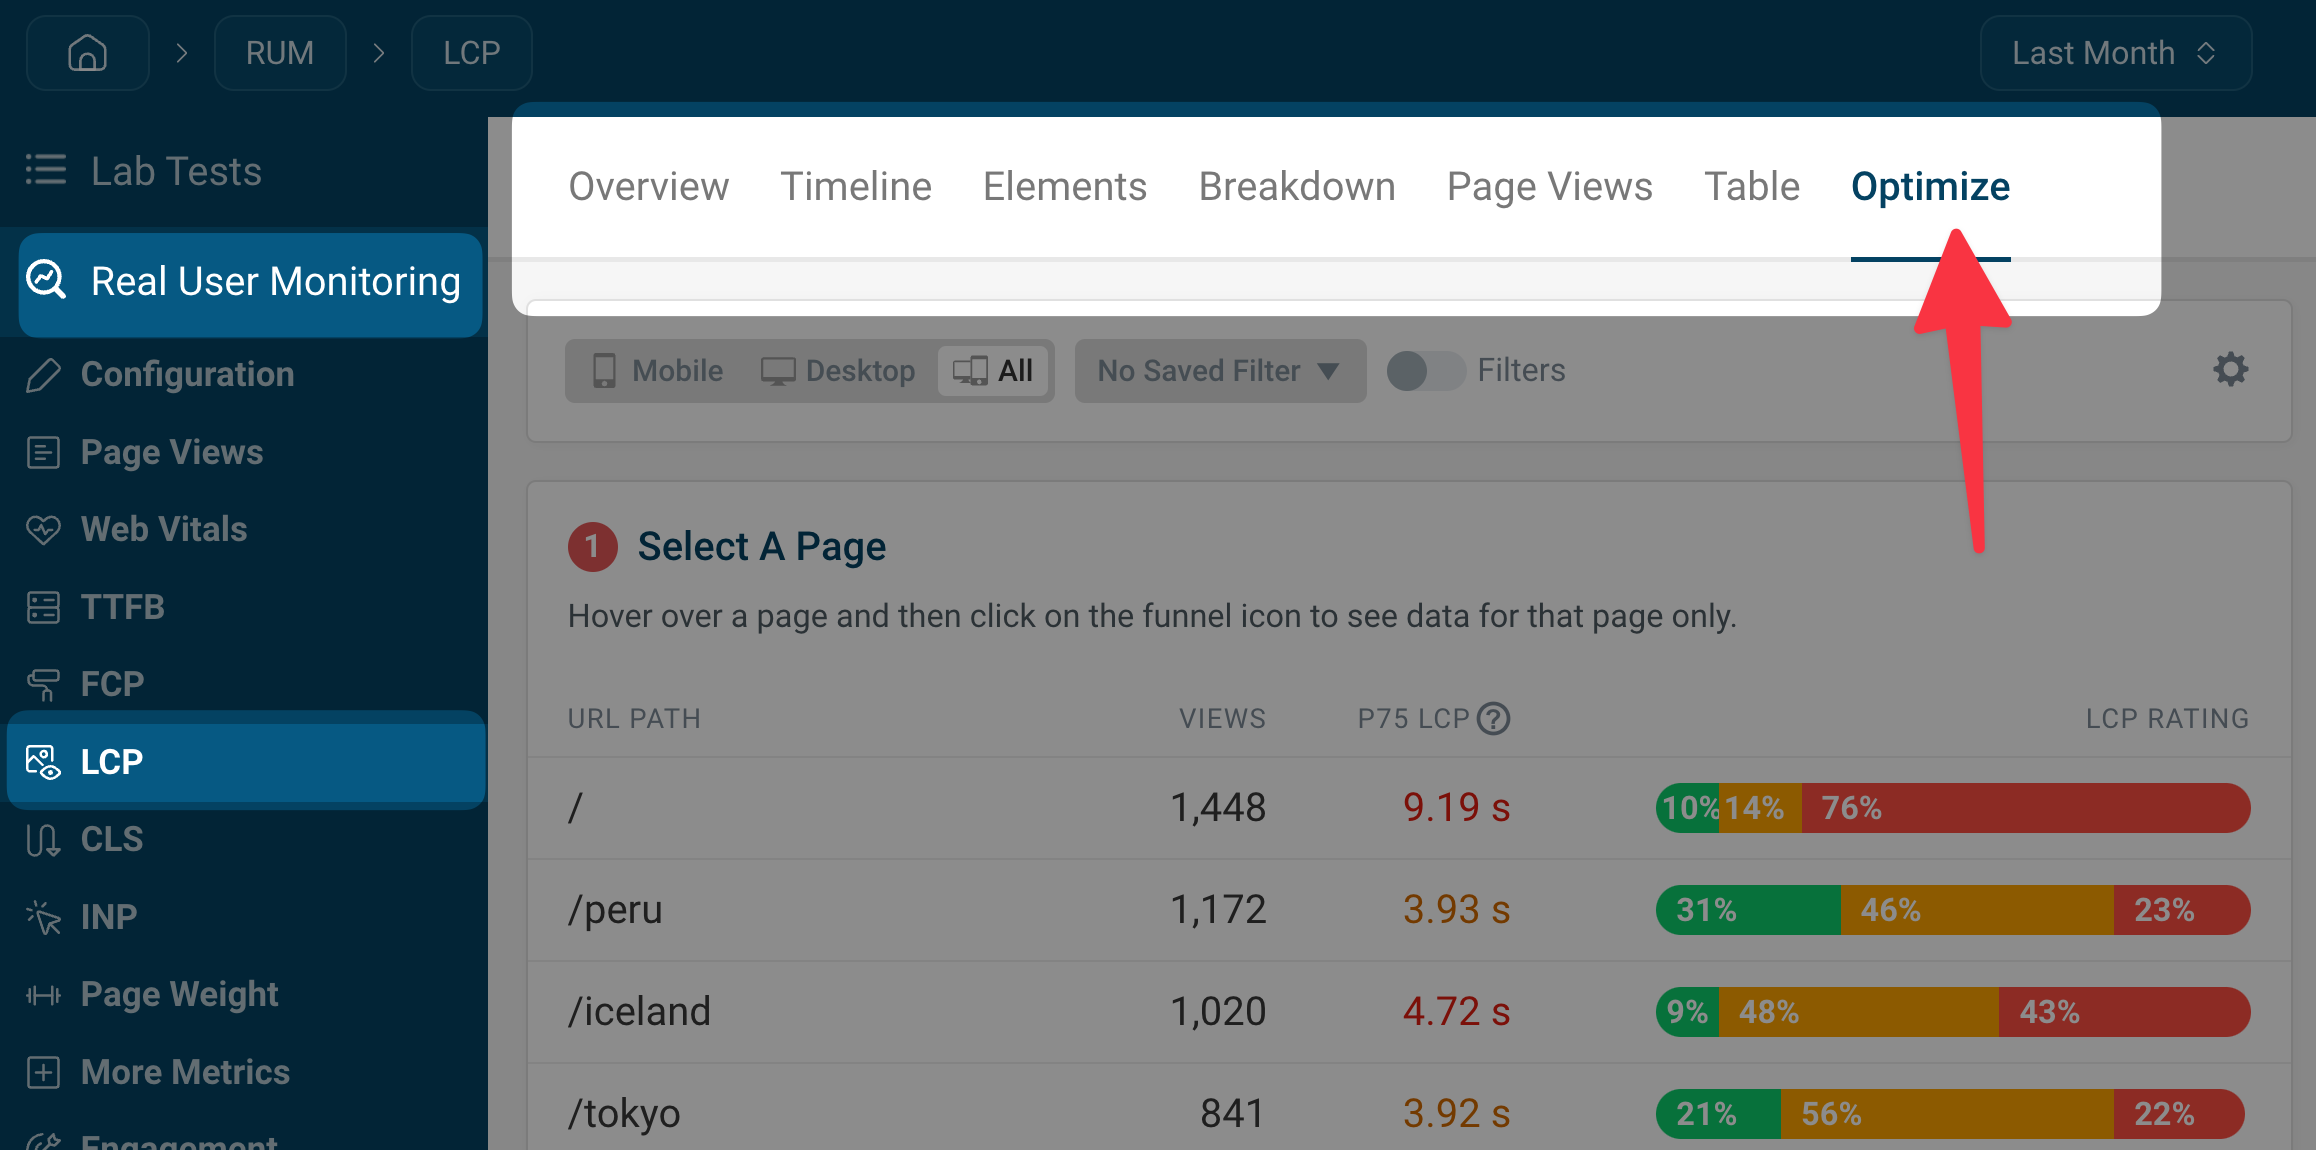
The Optimize tab guides you through the process of finding and fixing issues that affect your LCP score. The steps offered are:
- Select a page: Choose a page to drill down into.
- Check what's causing poor LCP: Identify the significant LCP sub-parts that are affecting your score.
- Check what content is counted as the LCP element: Understand what content is being counted as the LCP element.
- Review specific visitor experiences: Inspect individual visitor experiences to understand their journey, device, and network conditions.
An Optimize tab is also available for the First Contentful Paint (FCP), Time to First Byte (TTFB), and Interaction to Next Paint (INP) metrics.
Chrome and Lighthouse upgrades
Chrome has been upgraded from version 127 to 130, and Lighthouse has been upgraded from version 12.2.0 to 12.2.1 bringing performance improvements and bug fixes. DebugBear users do not need to take any action to benefit from these upgrades.
Better lab data exports
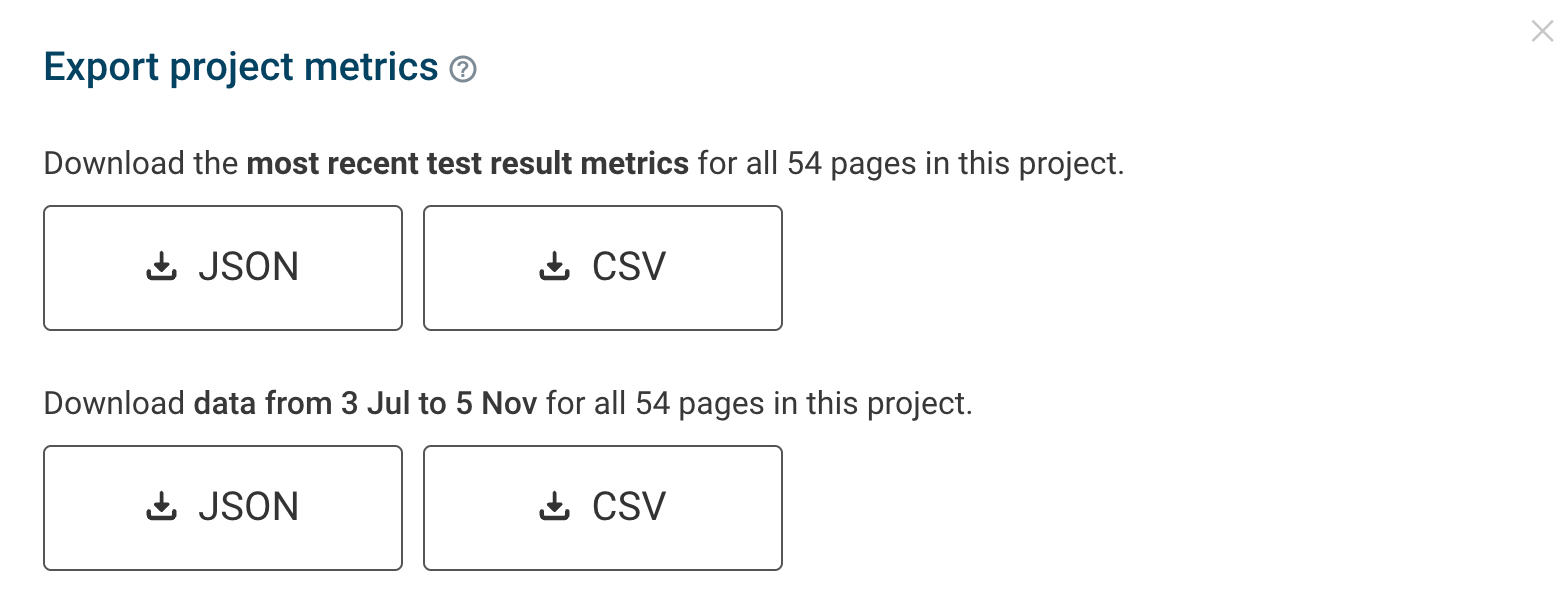
When you export project lab data from the DebugBear dashboard, the date range is now taken from the date selector instead of hard-coded to last 8 weeks. Longer time ranges are also supported now.
New articles and resources
We've published seven new articles, go and check them out!
-
Google's New CrUX Vis Tool: Explore Core Web Vitals Data Google has launched a new tool to explore historical Core Web Vitals data.
-
Fix Your LCP Score By Improving Render Delay Learn how Render Delay can impact the LCP score for a page and optimization examples to improve the LCP sub-part.
-
An Introduction to Shared Compression Dictionaries Shared compression dictionaries introduce a new way to improve HTTP file compression by providing a collection of common string patterns.
-
How To Test Your Website With JavaScript Disabled Checking how your website looks without JavaScript can help you deliver a better user experience.
-
How To Speed Up Your Vue App With Server Side Rendering Vue is a framework built for client-side applications. Learn how to optimize page load performance with server side rendering.
-
Avoid Chaining Critical Requests To Improve Page Load Speed Learn how chaining critical requests can delay a page from rendering.
-
Browser Support For Core Web Vitals And Page Speed Metrics Learn which browsers support Google's Core Web Vitals.
We also wrote a sponsored post on the MDN blog: Fixing your website's JavaScript performance.
