Enhanced RUM custom metrics, a new lazy loading experiment, multiple experiment runs, and more Here's what's new in DebugBear for September 2024.
Improved RUM custom metrics
We've upgraded our Real User Monitoring (RUM) custom metrics feature. You can now do the following:
Add names to your custom metrics

This makes it clear what each metric represents.
Enable auto-collection without changing your website code
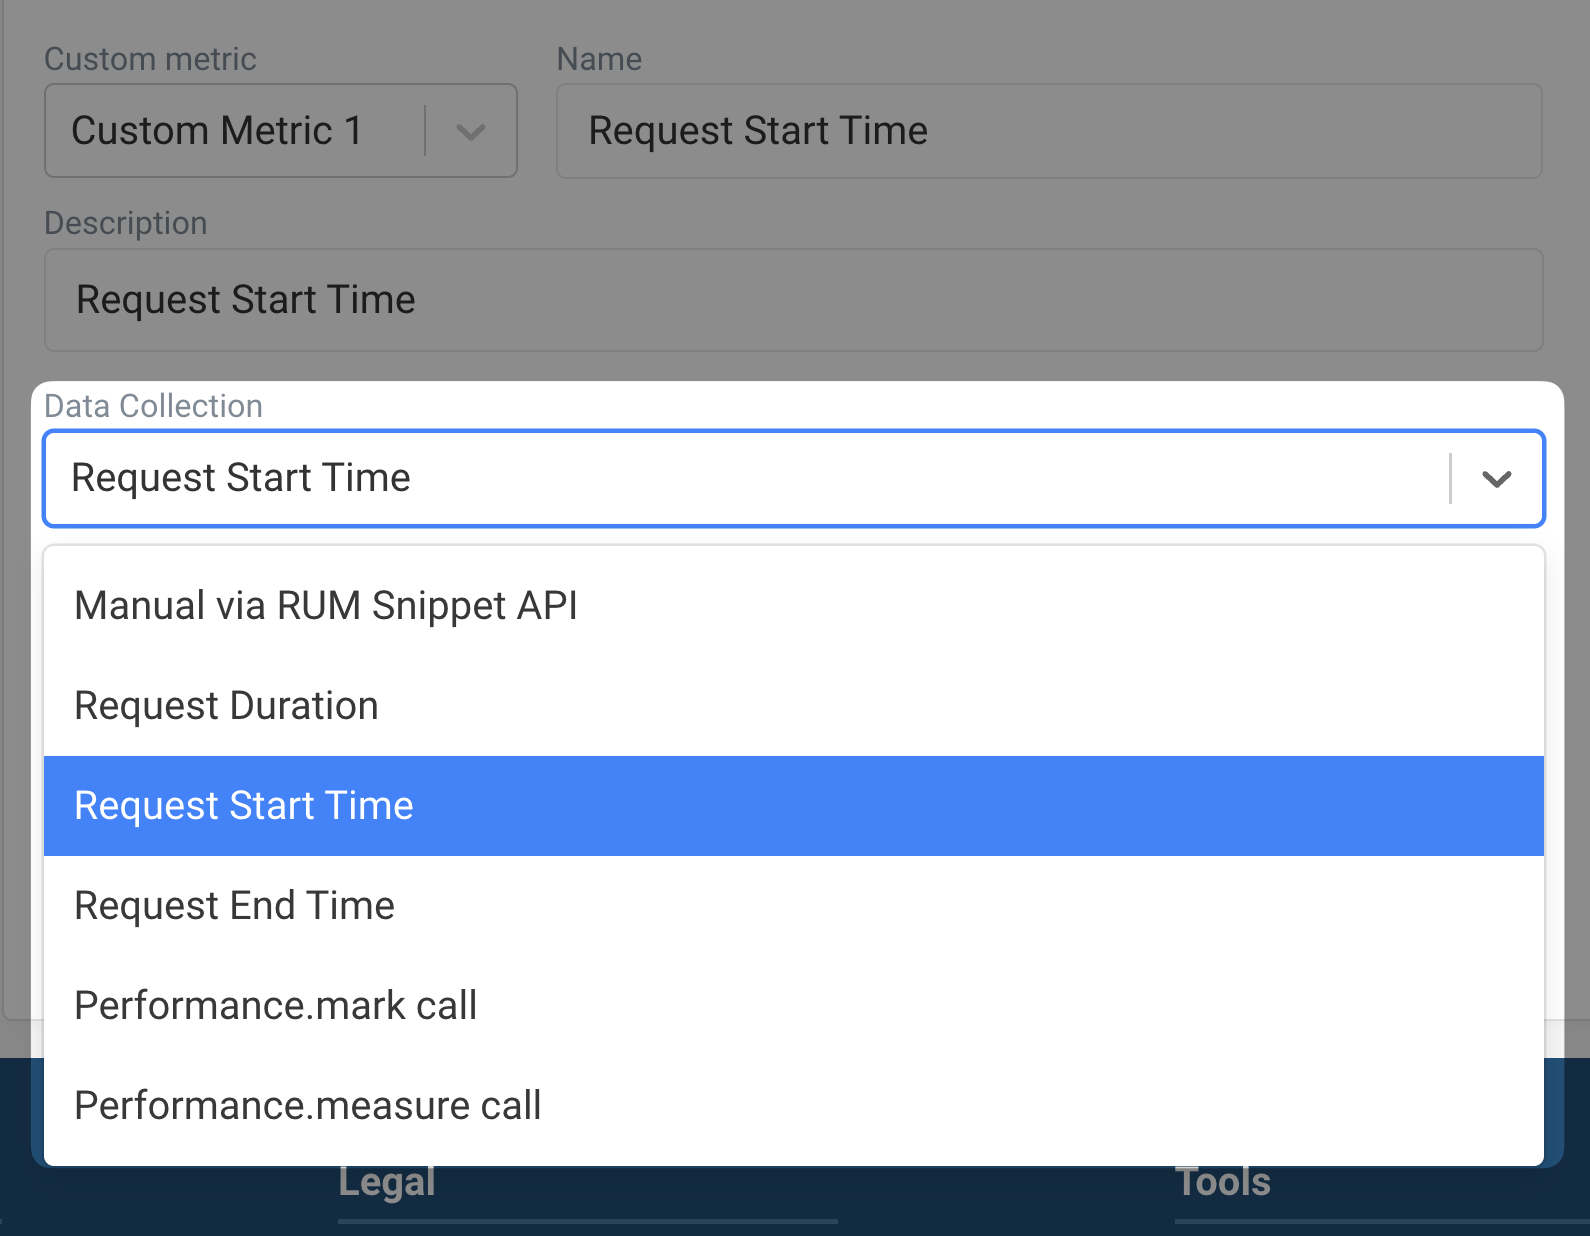
This helps you collect key performance metrics without modifying your website code.
The new auto-collection feature offers the following metrics:
- Request Start Time: Time from navigation to request initiation.
- Request End Time: Time from navigation to request completion.
- Request Duration: Total time for a network request.
- Performance.mark: Custom timing milestone.
- Performance.measure: Custom duration measurement.
To use this feature: Go to RUM > Configuration > Custom Metrics and select Create Metric.
Learn more about custom metrics in RUM.
New automatic experiment for lazy loading
We've added a new automatic experiment for lazy loading offscreen images. This experiment helps improve page load times by focusing on above-the-fold content first.
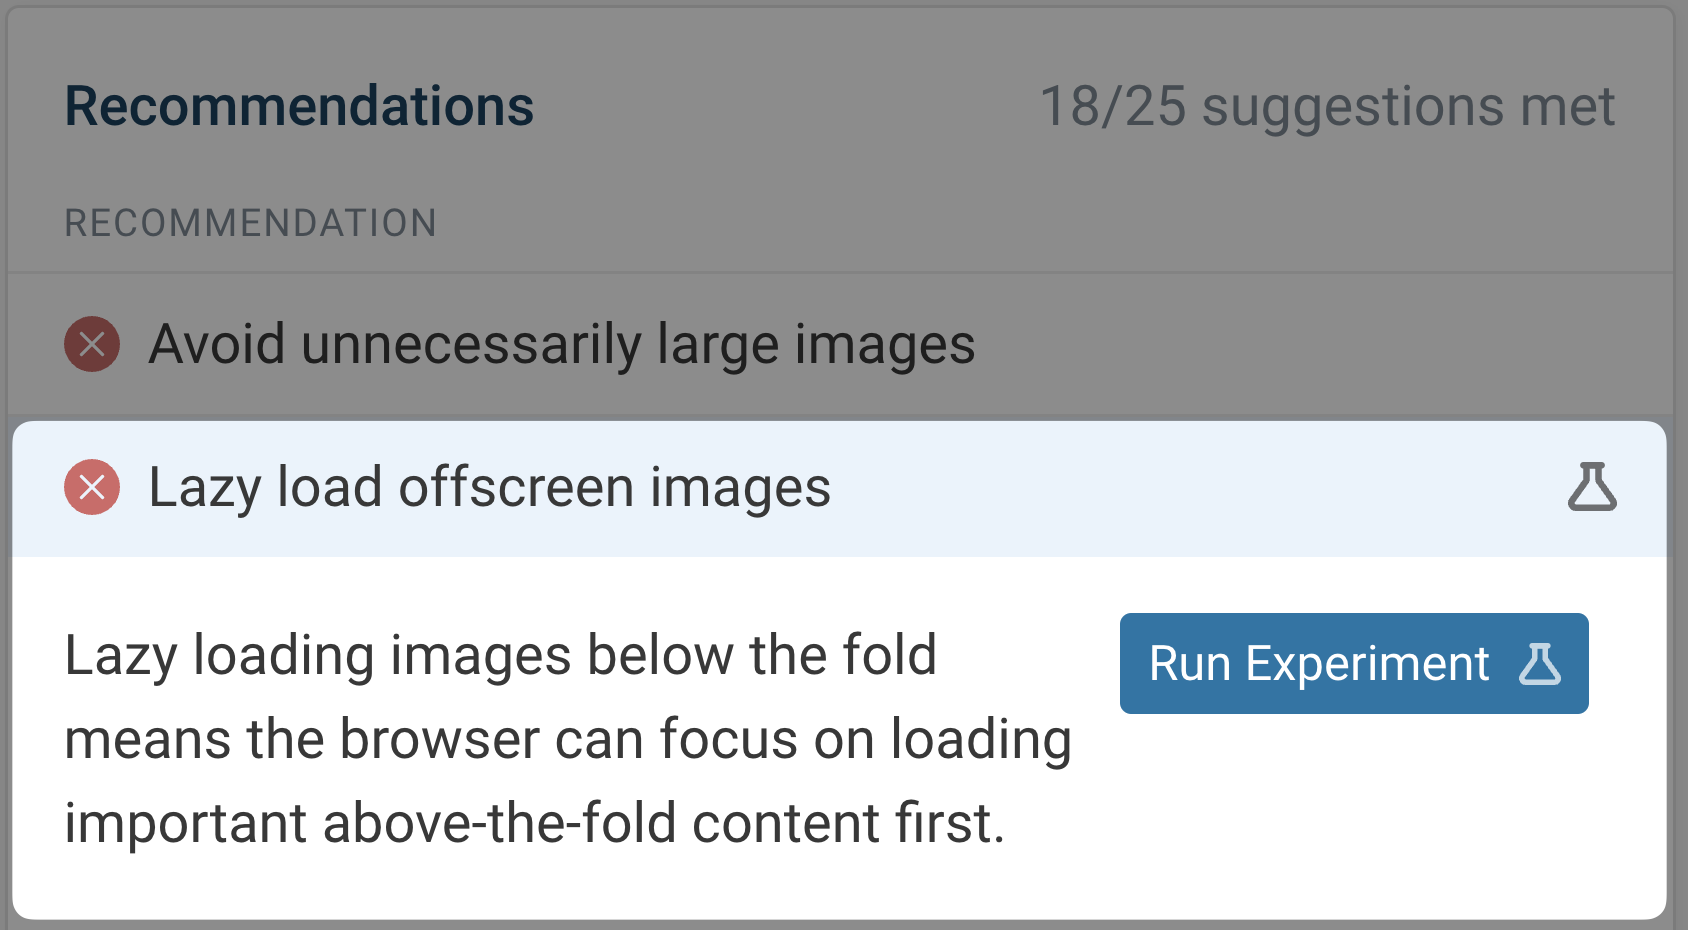
The experiment is called "Lazy load offscreen images". It automatically adds the loading="lazy" attribute to images below the fold which typically improves initial page load times, and helps with request prioritization.
Run experiments multiple times
When you run a one-click experiment in DebugBear, the results are usually based on a single test run.
You can now run Page Speed Experiments multiple times to increase confidence in your results.

When you prepare your experiment, you'll find a new "Run test multiple times" section. Choose to run your experiment 1, 3, 5, or 7 times. You can then view the median result, which is less affected by outliers.
New RUM views table
We've added a new Table view to the RUM > View Count tab. This gives you a more detailed look at your page view count data.
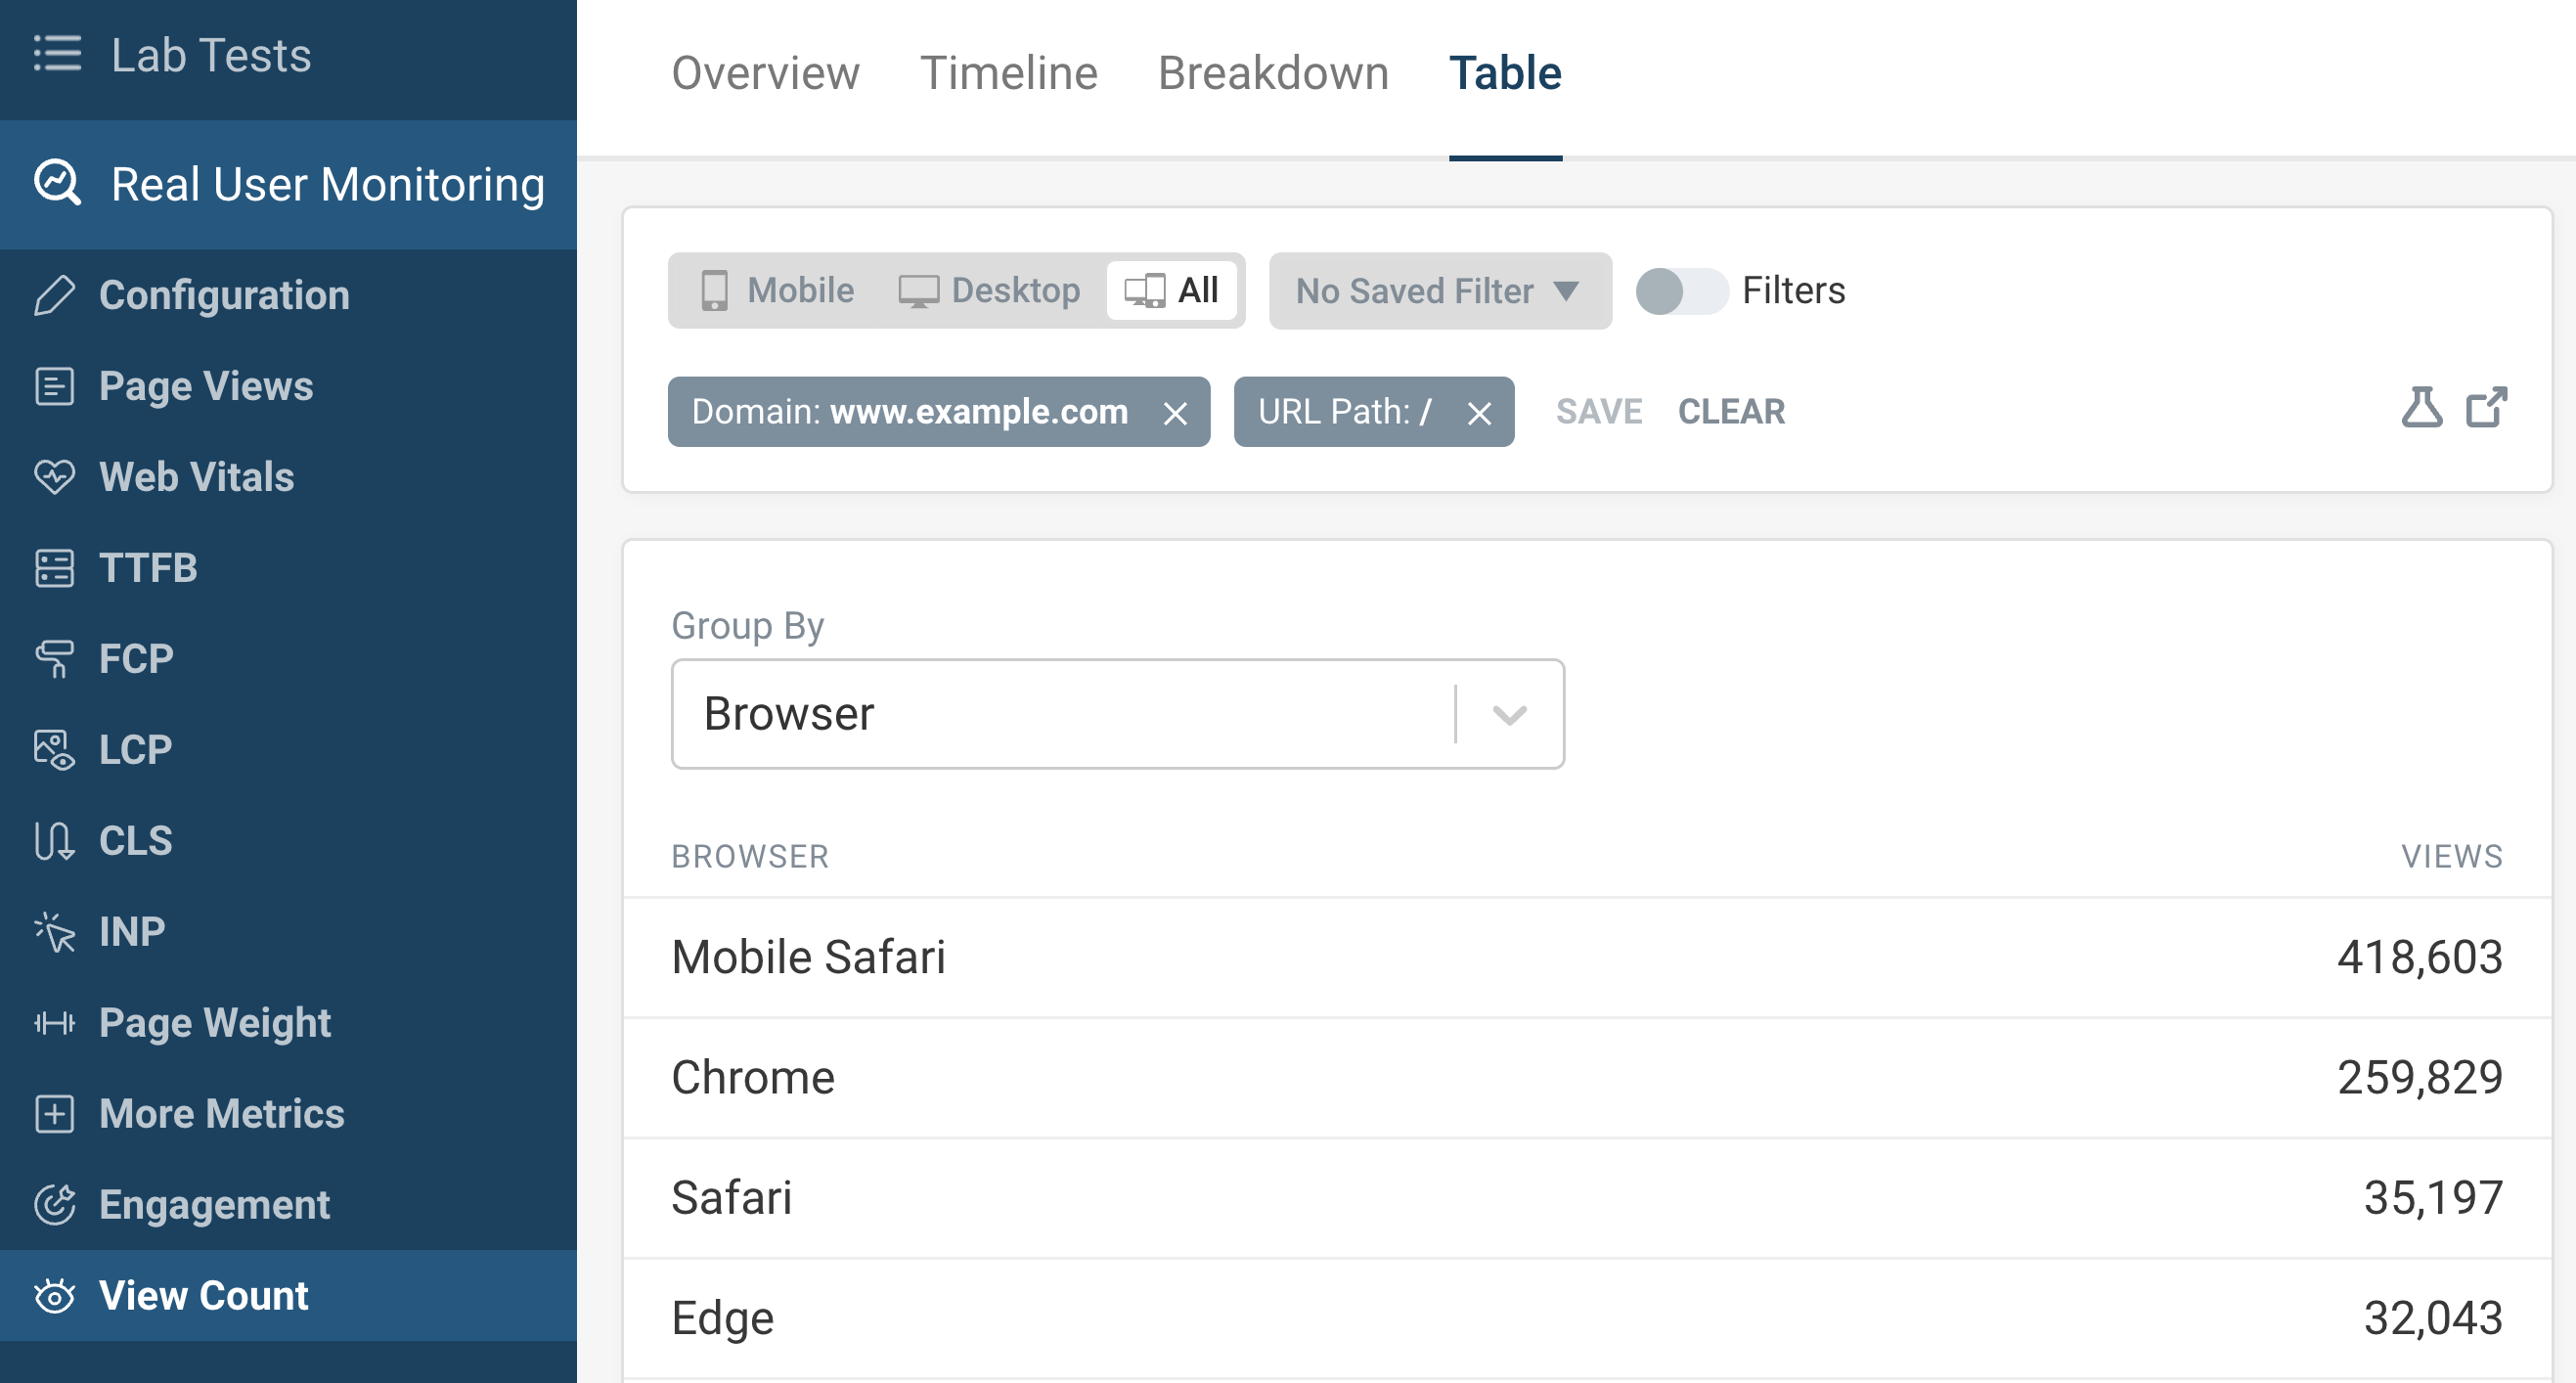
To access this feature, go to RUM > View Count > Table. You can now group your data by various dimensions, including browser, path, origin, tags, Core Web Vitals metrics like INP, CLS, and LCP, and much more.
New articles and resources
We've published seven new articles that we hope you'll find useful:
-
What's The Difference Between CrUX And RUM Data? Explore the differences between CrUX and RUM data, how they're collected, and their respective advantages.
-
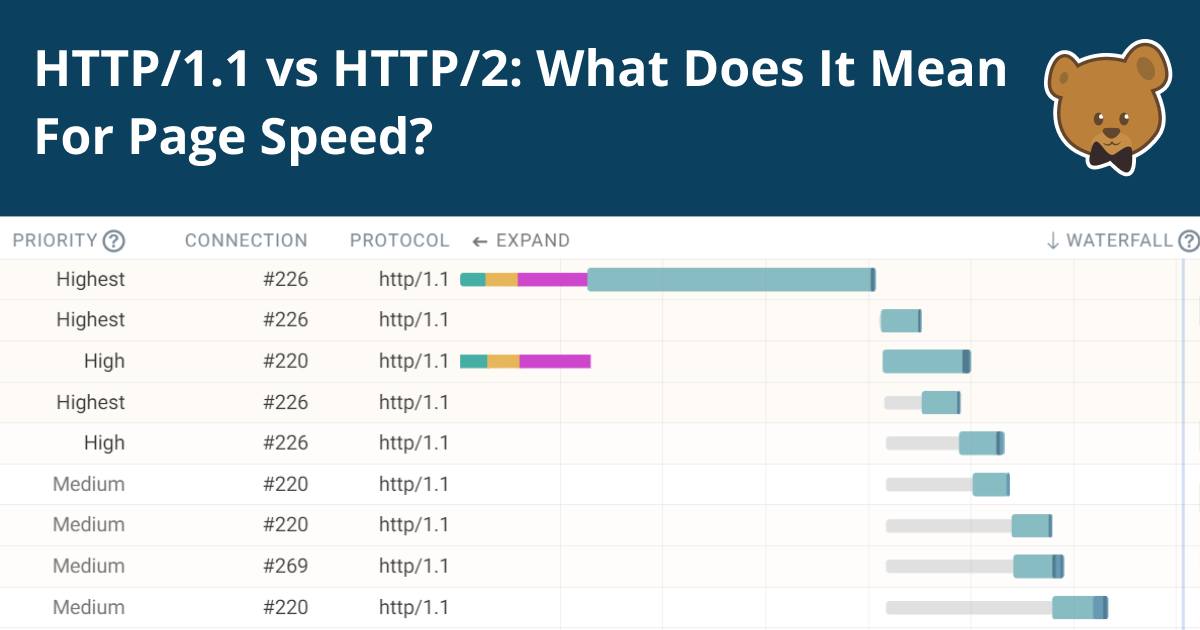
HTTP/1.1 vs HTTP/2: What Does It Mean For Page Speed? Learn about the differences between HTTP/1.1 and HTTP/2, with practical examples of how HTTP/2 can lead to faster websites.
-
How To Optimize Largest Contentful Paint For Video Elements Learn about optimizing Largest Contentful Paint when dealing with video elements on your pages.
-
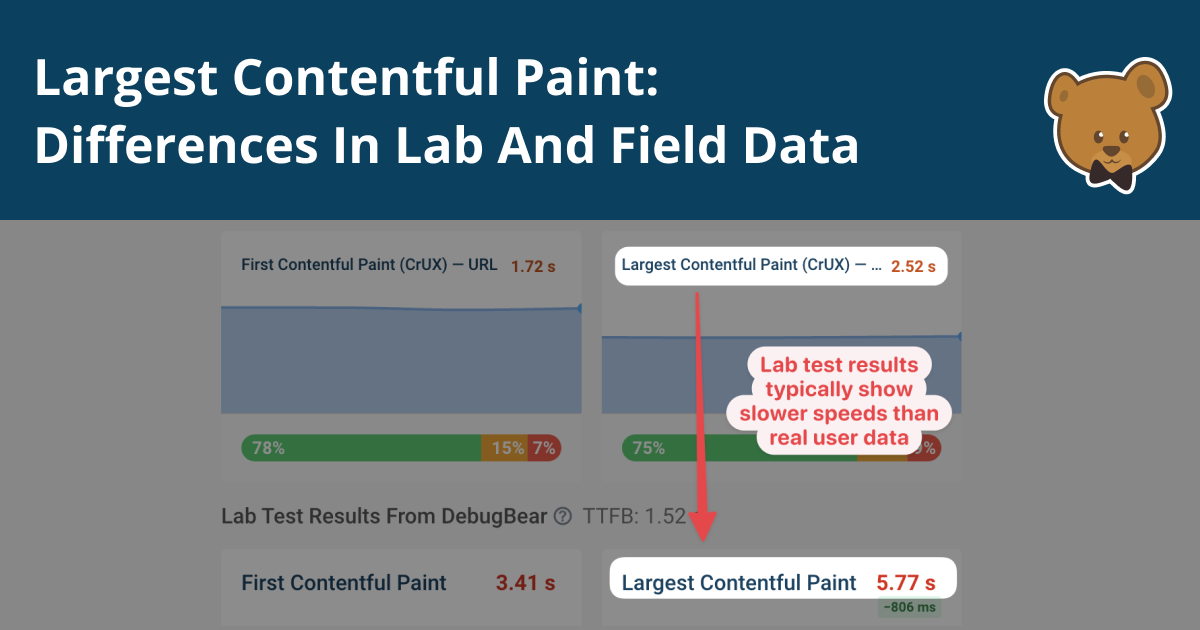
Largest Contentful Paint Differences In Lab And Field Data Understand why LCP data can vary between lab tests and real user data, and how to interpret these differences.
-
What Is JavaScript Hydration For Single Page Applications? Learn about JavaScript hydration and its impact on website performance.
-
How to Defer Offscreen Images and Background Images Explore techniques for deferring offscreen images to improve user experience and Core Web Vitals.
-
Cloudflare Speed Brain: What You Need to Know Discover Cloudflare's new Speed Brain feature, what it does, and how to use it on your website.

We hope you find these features, and educational content, useful. If you want to stay up to date with our latest work, follow us on X, subscribe on YouTube and subscribe to our mailing list below: