RUM Custom Metrics and Tags
DebugBear RUM provides a large number of general website performance metrics and ways to segment page views for analysis.
However, you can also collect custom metrics based on what matters to your users, or tag page views to break down your data.
Manual and automatic custom metrics and tags
There are two ways to collect values for custom metrics and tags:
- Via the RUM Snippet API and code on your website
- Automatically by looking for a specific piece of information
Collecting custom metrics and tags programmatically
You can collect custom tag or metric values on your website and then add them to the RUM data using identifiers like metric1 or tag3.
window.dbbRum = window.dbbRum || [];
const customTimingMark = performance
  .getEntriesByType("measure")
  .find((m) => m.name === "Hydration Duration");
window.dbbRum.push(["metric1", customTimingMark.startTime]);
Automatic custom metrics
There are 5 types of automatic custom metrics. No changes to your website's code are required to collect these values.
The following automatic metric types are available:
- Request Start Time: how soon after a navigation did a request start?
- Request End Time: how long after navigation did a request finish?
- Request Duration: how long did a network request take?
- Performance.mark call: marks a custom timing milestone on the page
- Performance.measure call: marks a custom duration on the page
Only the first 1000 requests or user timing entries are considered for auto collection. This should not impact the majority of users.
Automatic custom tags
The following data can be collected automatically for tagging:
- URL Query Parameters: extract a query parameter for the URL, for example
utm_campaign
Setting up a custom metric
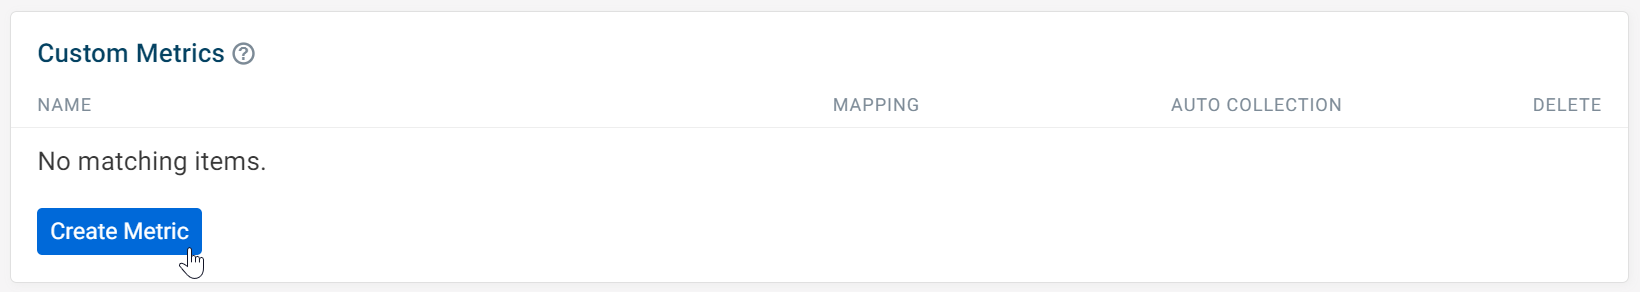
Custom metrics can be set up from the RUM Configuration tab. Find the Custom Metrics section and click Create Metric.
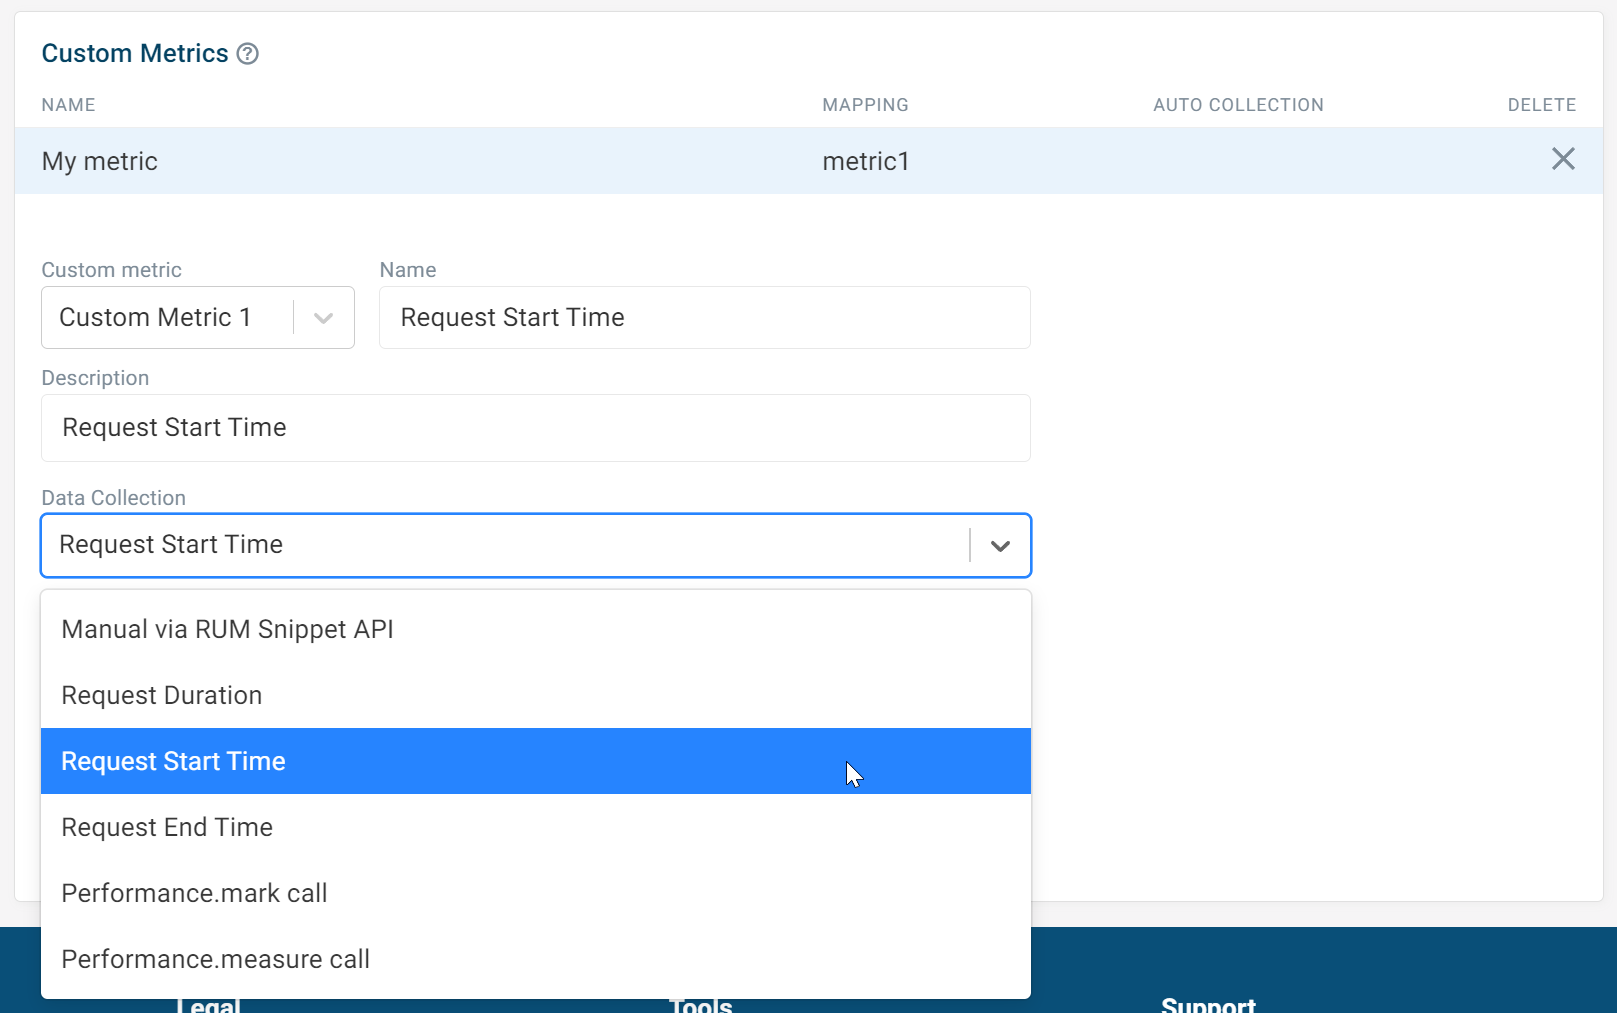
You can provide a name and description for your metric. The description will show up as a tooltip when viewing metric charts.
Then select a data collection option. In this example we are selecting one of the automatic metrics, Request Start Time.
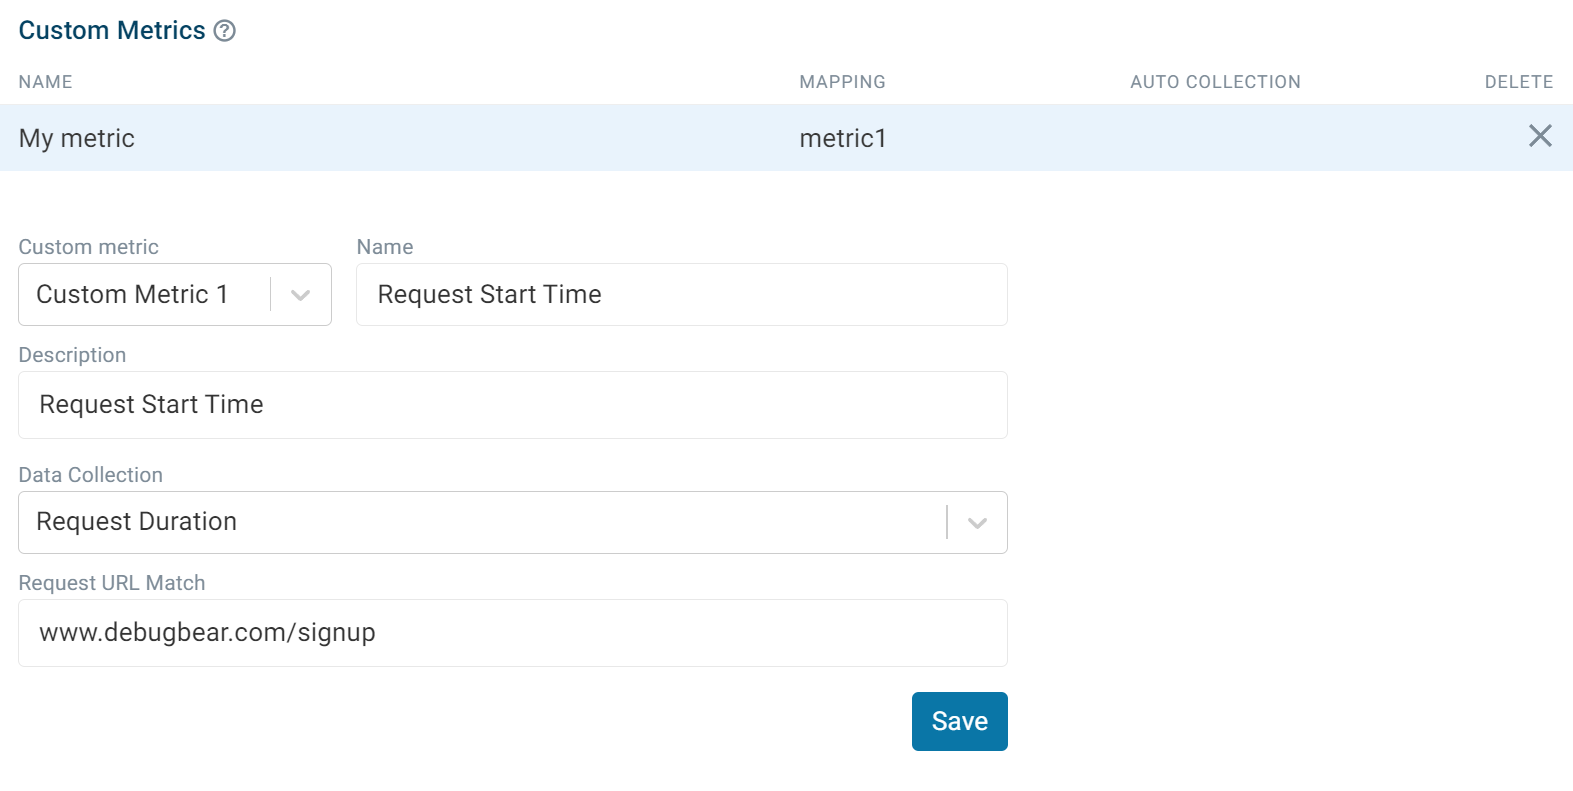
For automatic metrics you need to specify exactly what value should be collected. In this example we want to track a request start time, so we need to specify the URL of the request that we want to measure.
A request is matched if it contains the "Request URL Match" value. For example, /user/ will match www.example.com/user/123/details.
You can also use wildcards, for example /user/*/details.
Then click Save and the custom metric data will gradually start coming in. It may take a few minutes, since visitors might still have the old RUM script cached in their browser.
Viewing Custom Metrics
Custom metric data can be found in the More metrics tab in the Other section.
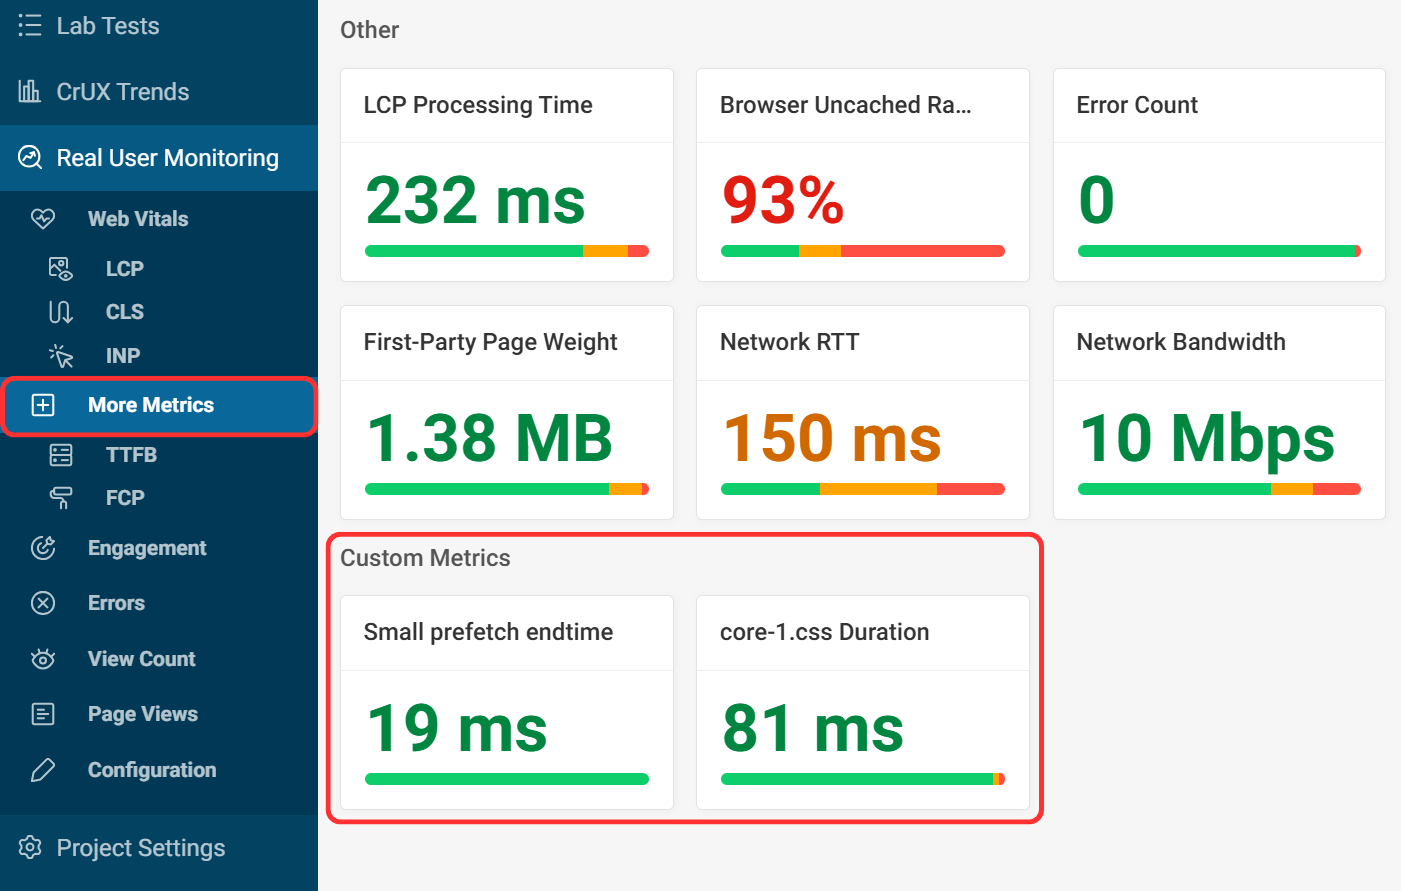
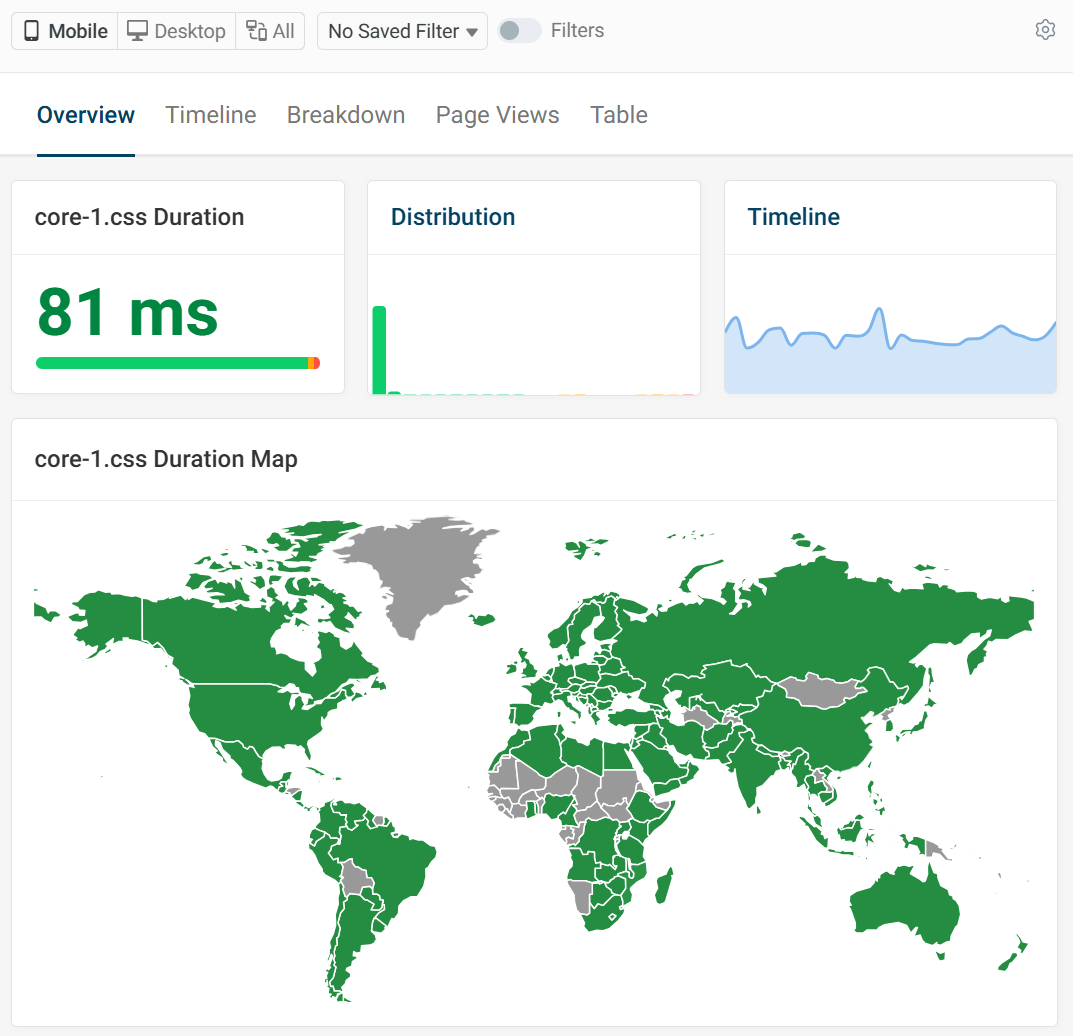
Clicking a custom metric will load a dashboard for that specific metric.
Custom Tags and Metrics can be updated or renamed, but the data tied to each specific metric or tag ID stays the same. Keep this in mind when looking at the data over long periods.
Custom Tags
Up to 5 custom tags are available. These tags are available via the RUM Snippet API or URL Query Parameters which are collected automatically.
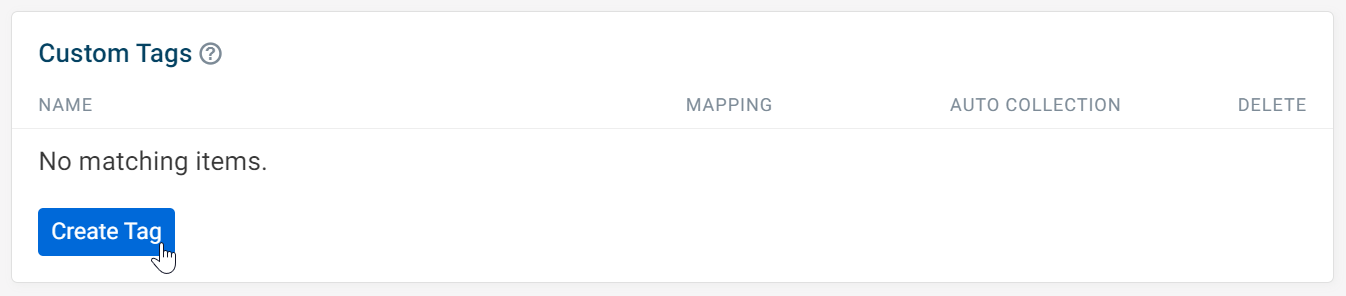
Custom names can be mapped to a tag on the configuration page. Click Create Tag.
Select the desired tag from the drop down menu, then add a name and description. Next select whether the data should be collected via the RUM Snippet API or URL Query Parameters.
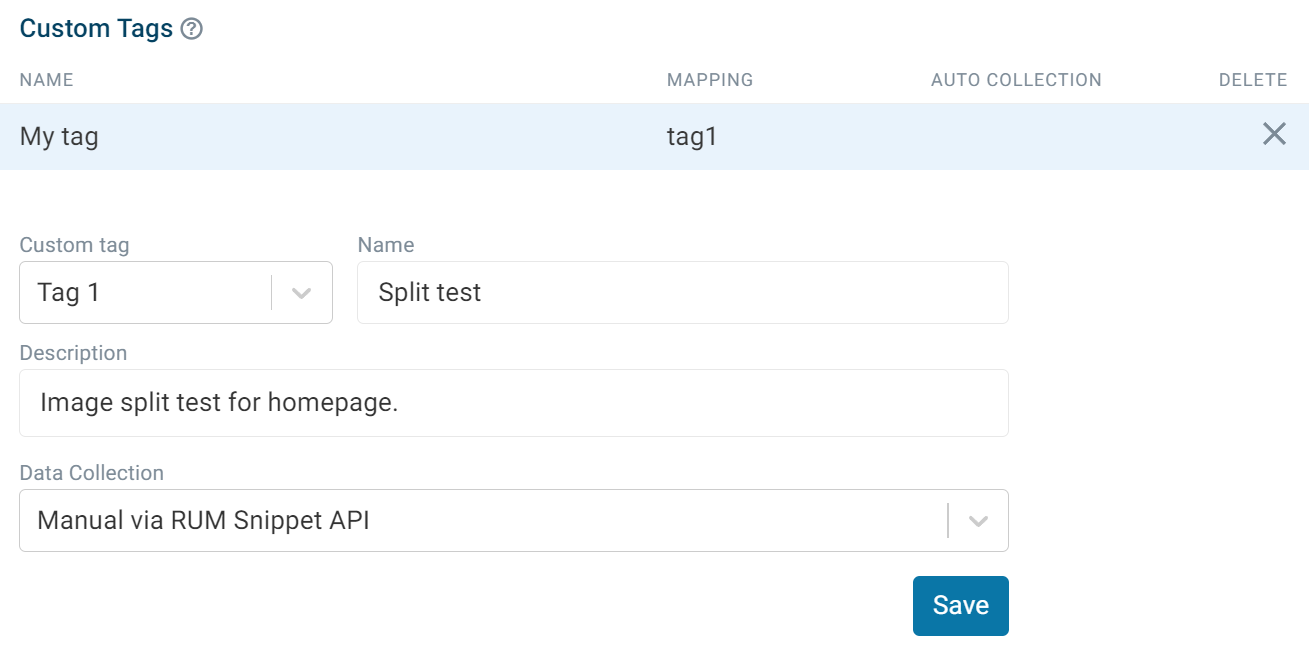
Click Save and the custom settings will then be available in the RUM data for the custom tag.
Viewing Custom Tags
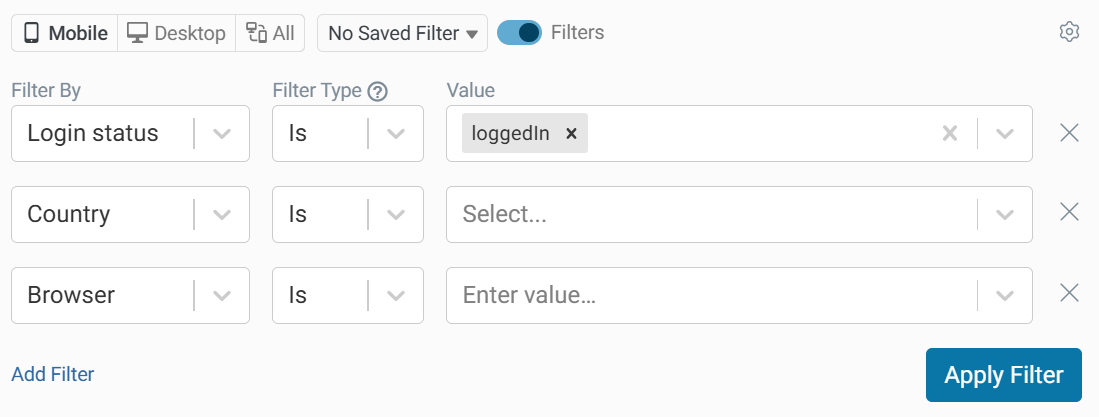
Custom tags can be applied as a filter:
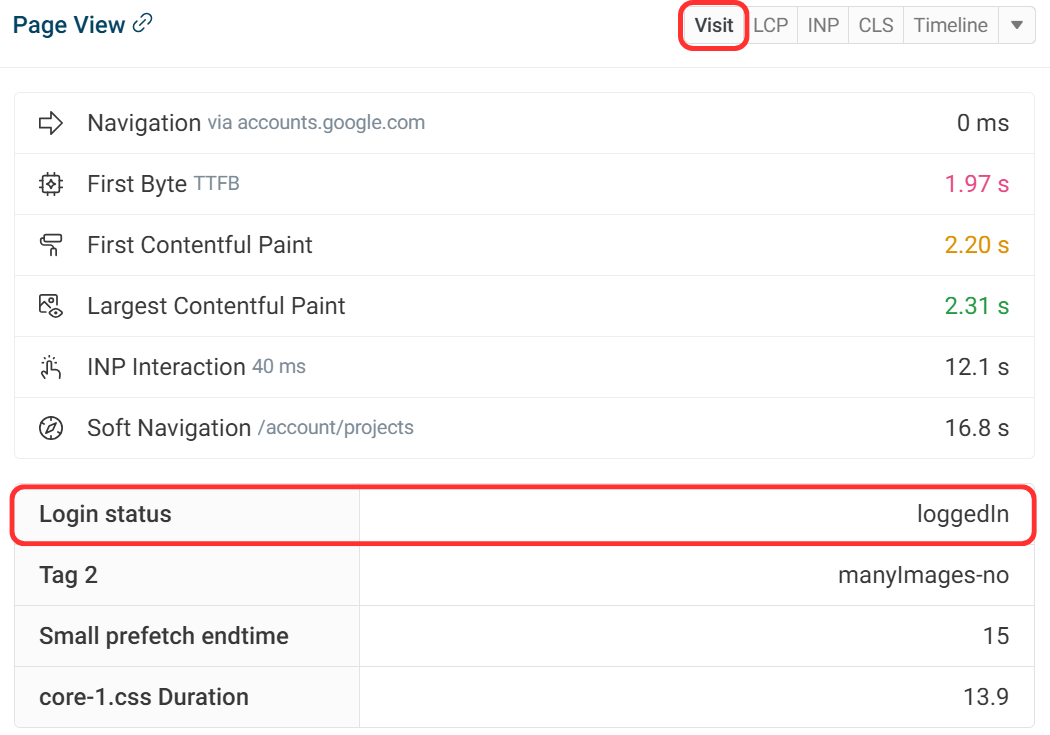
When viewing individual experiences, custom tags will appear in the visit tab.
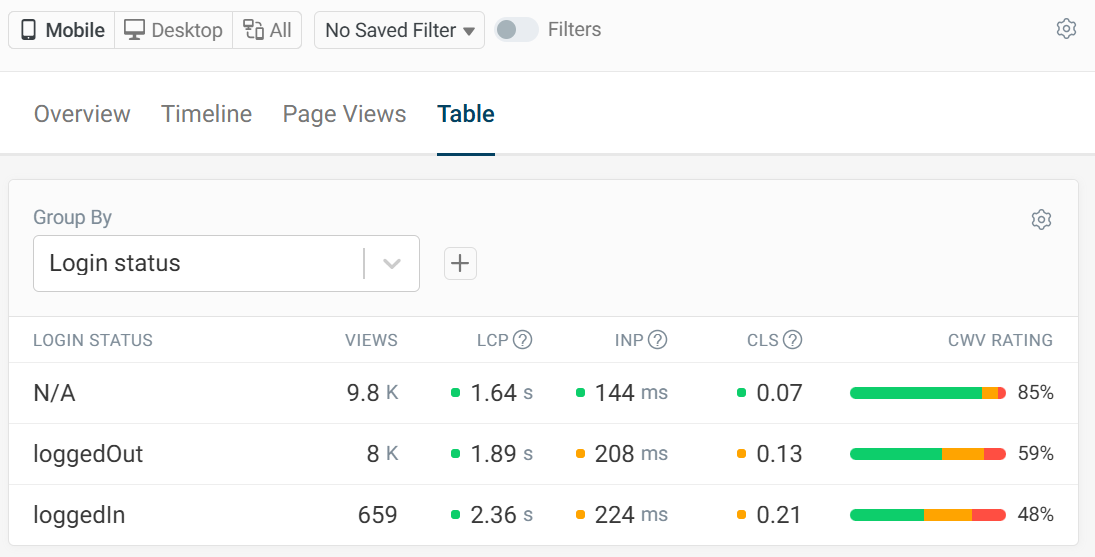
Tags can also be compared using the Group By table. In this example we can compare the performance difference for users that are logged in and users that are logged out.