
The Largest Contentful Paint metric consists of several different components. In this article we'll take a look at the Resource Load Duration subpart and explore different ways to reduce it.
What is LCP Load Duration?
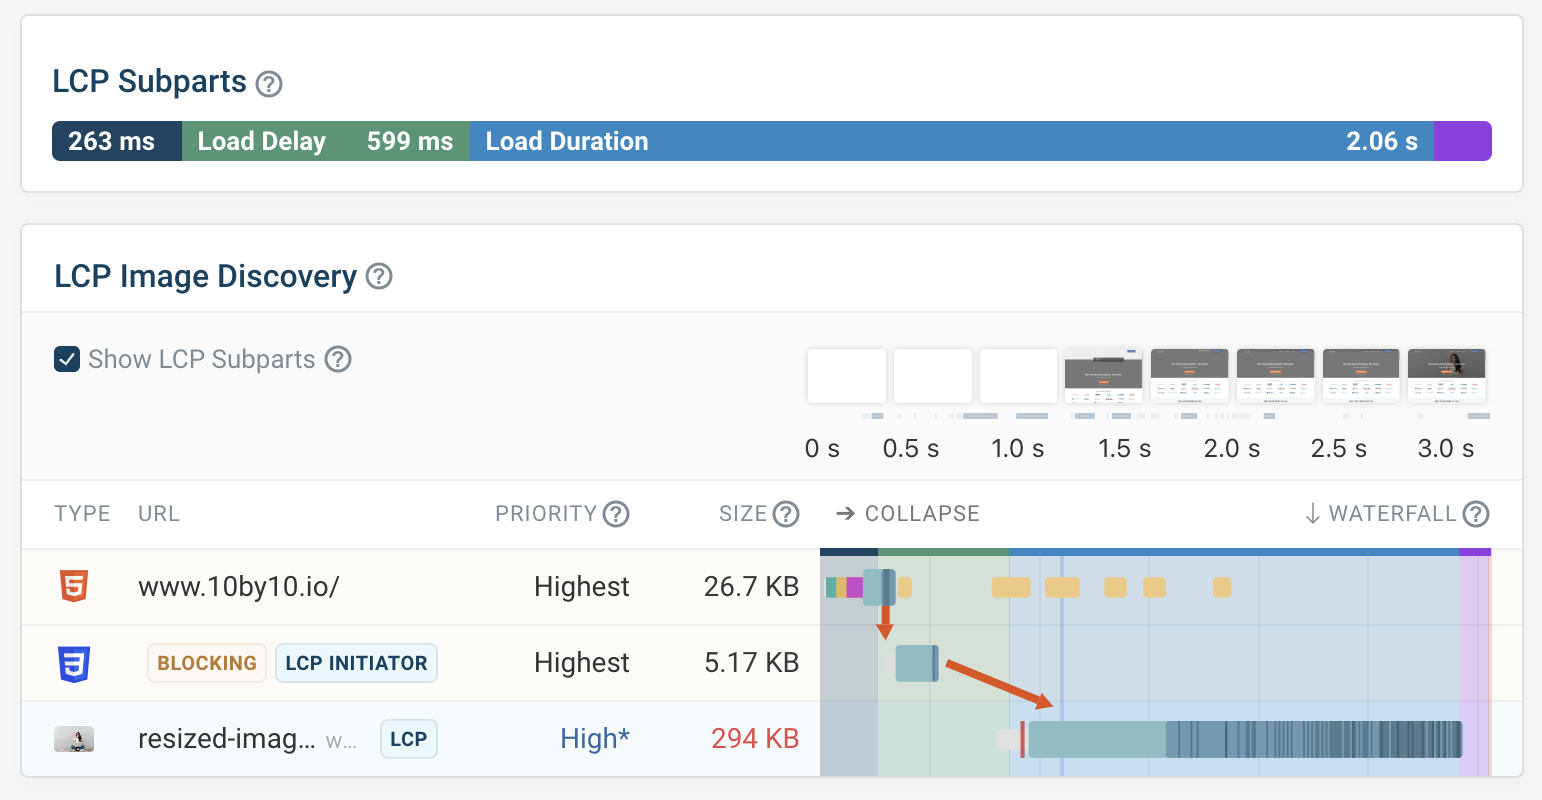
If the LCP element is an image, Load Delay measures how long it takes for the image resource to download. It is one of the four LCP subparts that make up the overall Largest Contentful Paint score.
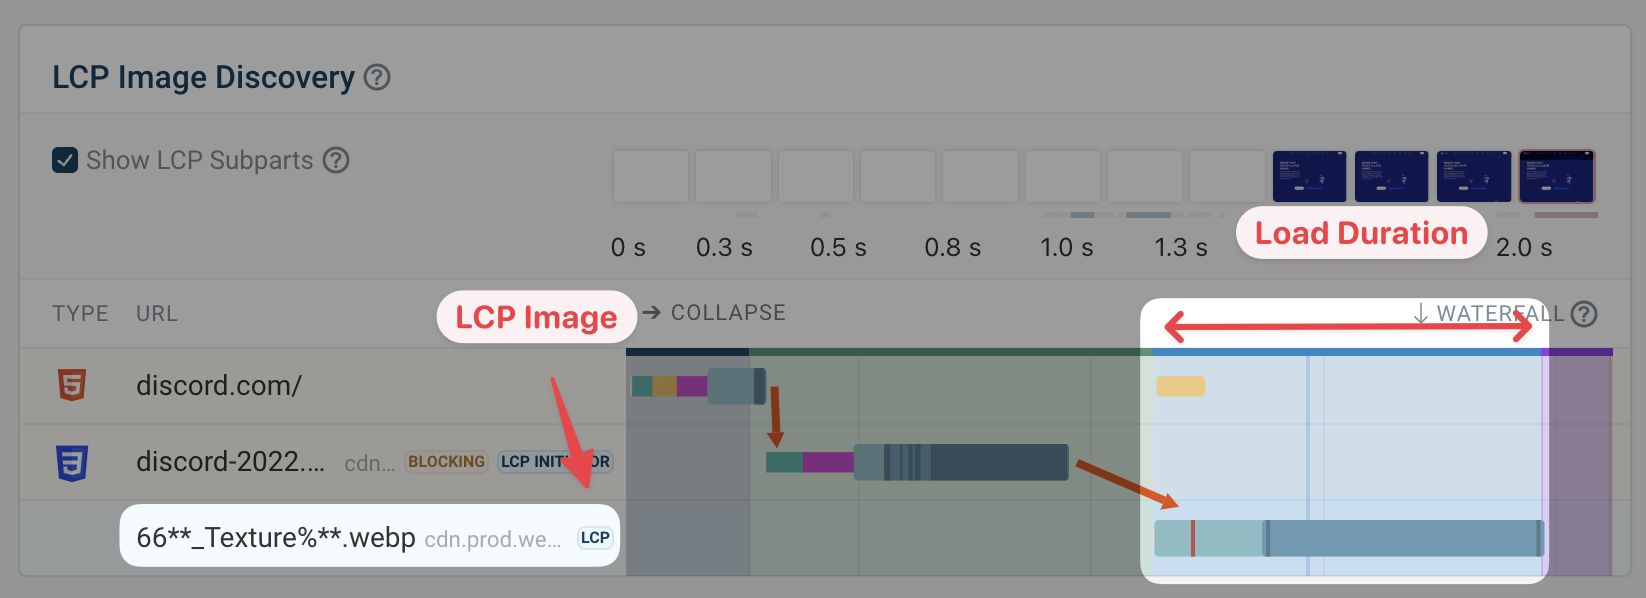
The request waterfall below shows a WebP file that's required to display the largest content element on the page. After loading it there's a short render delay time, before the content finally appears.
What causes resource load duration?
The duration of an image request usually mostly depends on the image size and the bandwidth available on the network. Server response time usually isn't an issue for static assets.
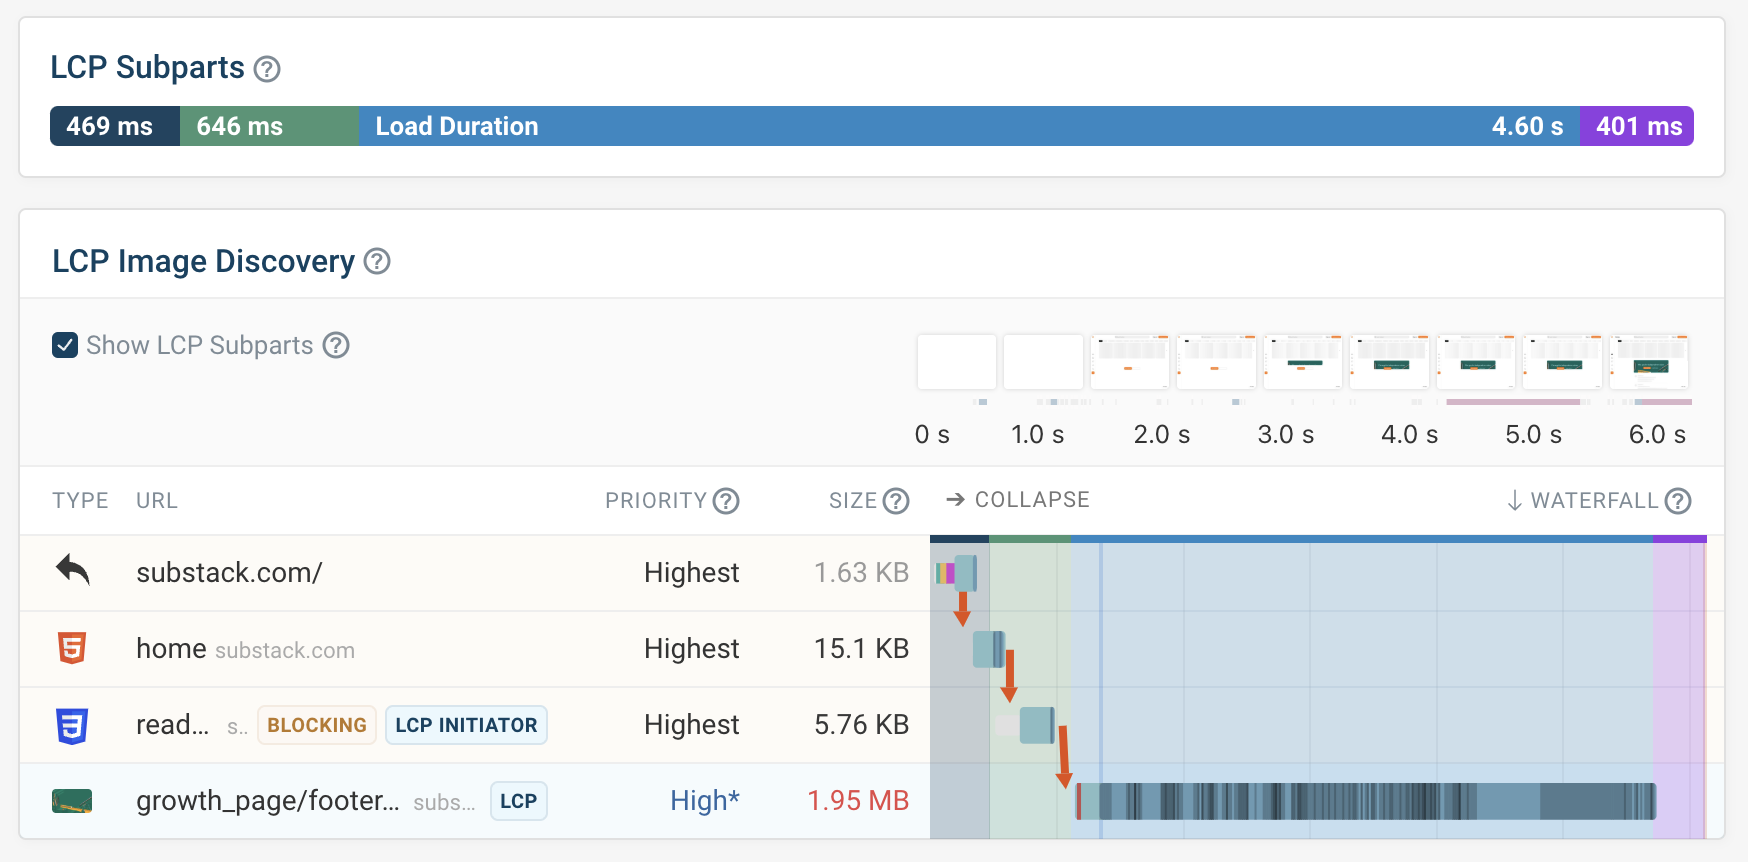
This example shows a large amount of Load Delay because the image is almost 2 megabytes large. That means downloading it takes a long time, delaying the Largest Contentful Paint.
LCP Resource load duration for videos
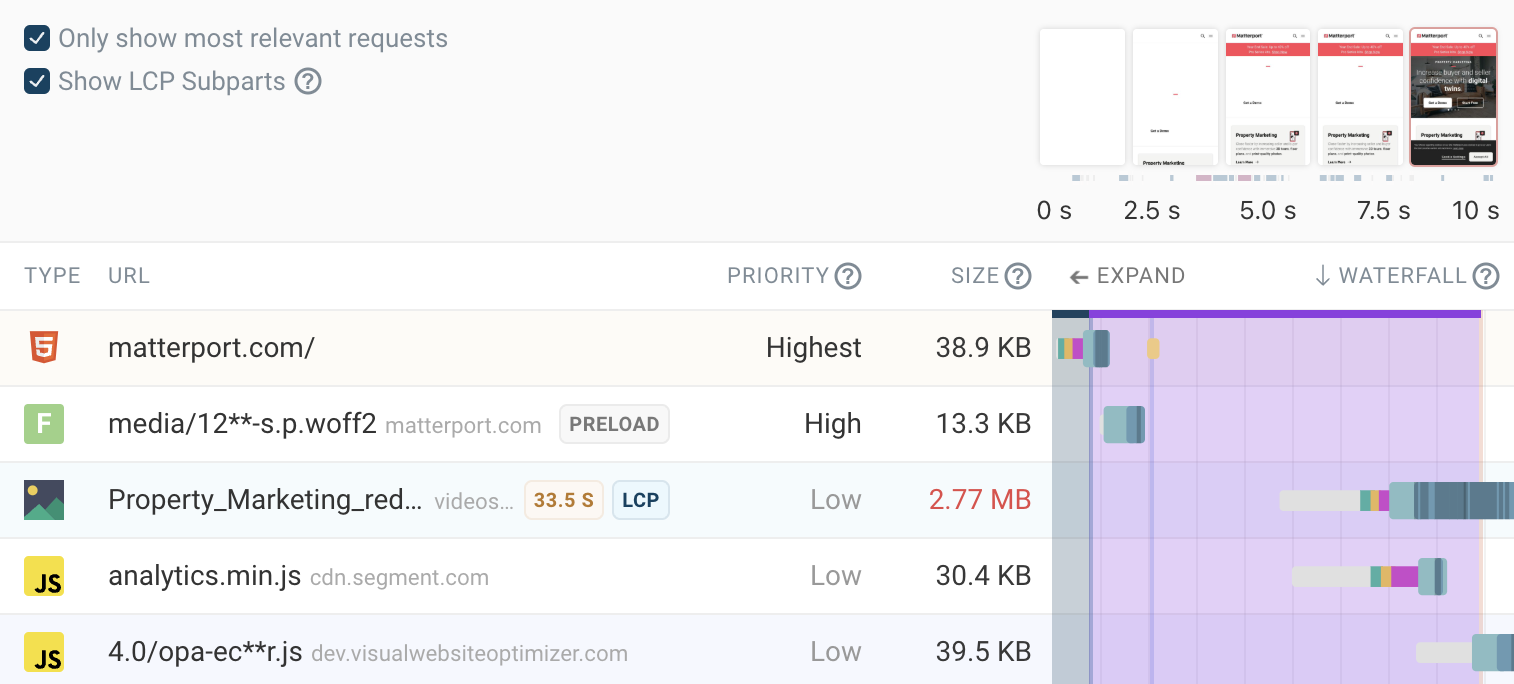
Currently Google's Lighthouse tool does not support measuring load duration for videos.
Instead, time spent waiting for the first video frame to arrive will be attributed as render delay.
How to measure LCP Load Duration
You can measure LCP Load Duration using a number of performance tools, for example:
- PageSpeed Insights
- DebugBear
- Chrome DevTools
LCP Load Duration on PageSpeed Insights and Lighthouse
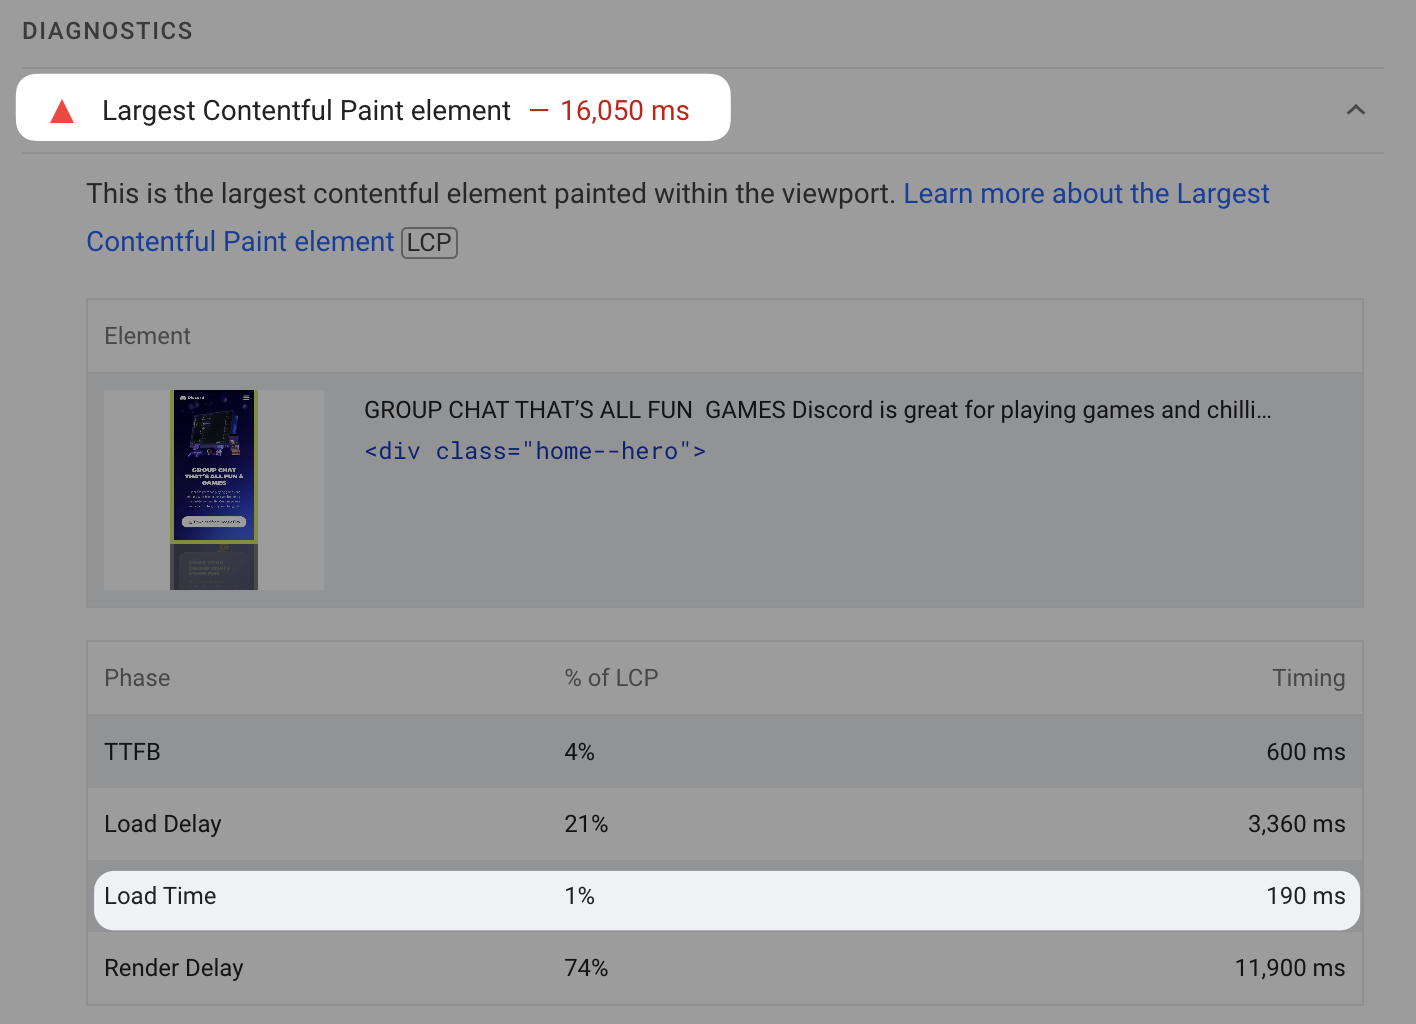
Google's PageSpeed Insights service is built on top of the free Lighthouse tool, which can report LCP load duration under the Largest Contentful Paint element audit.
The audit shows what element was detected as the largest content element and the breakdown into the four LCP subparts.
LCP Load Duration in DebugBear
You can measure Load Duration in DebugBear using synthetic monitoring and real user monitoring. Try the free website speed test to get started.
To view the LCP subpart breakdown, click on the Largest Contentful Paint metric title. You get a numeric breakdown as well as a request waterfall that's annotated with the subpart timings.
Check Load Duration in Chrome DevTools
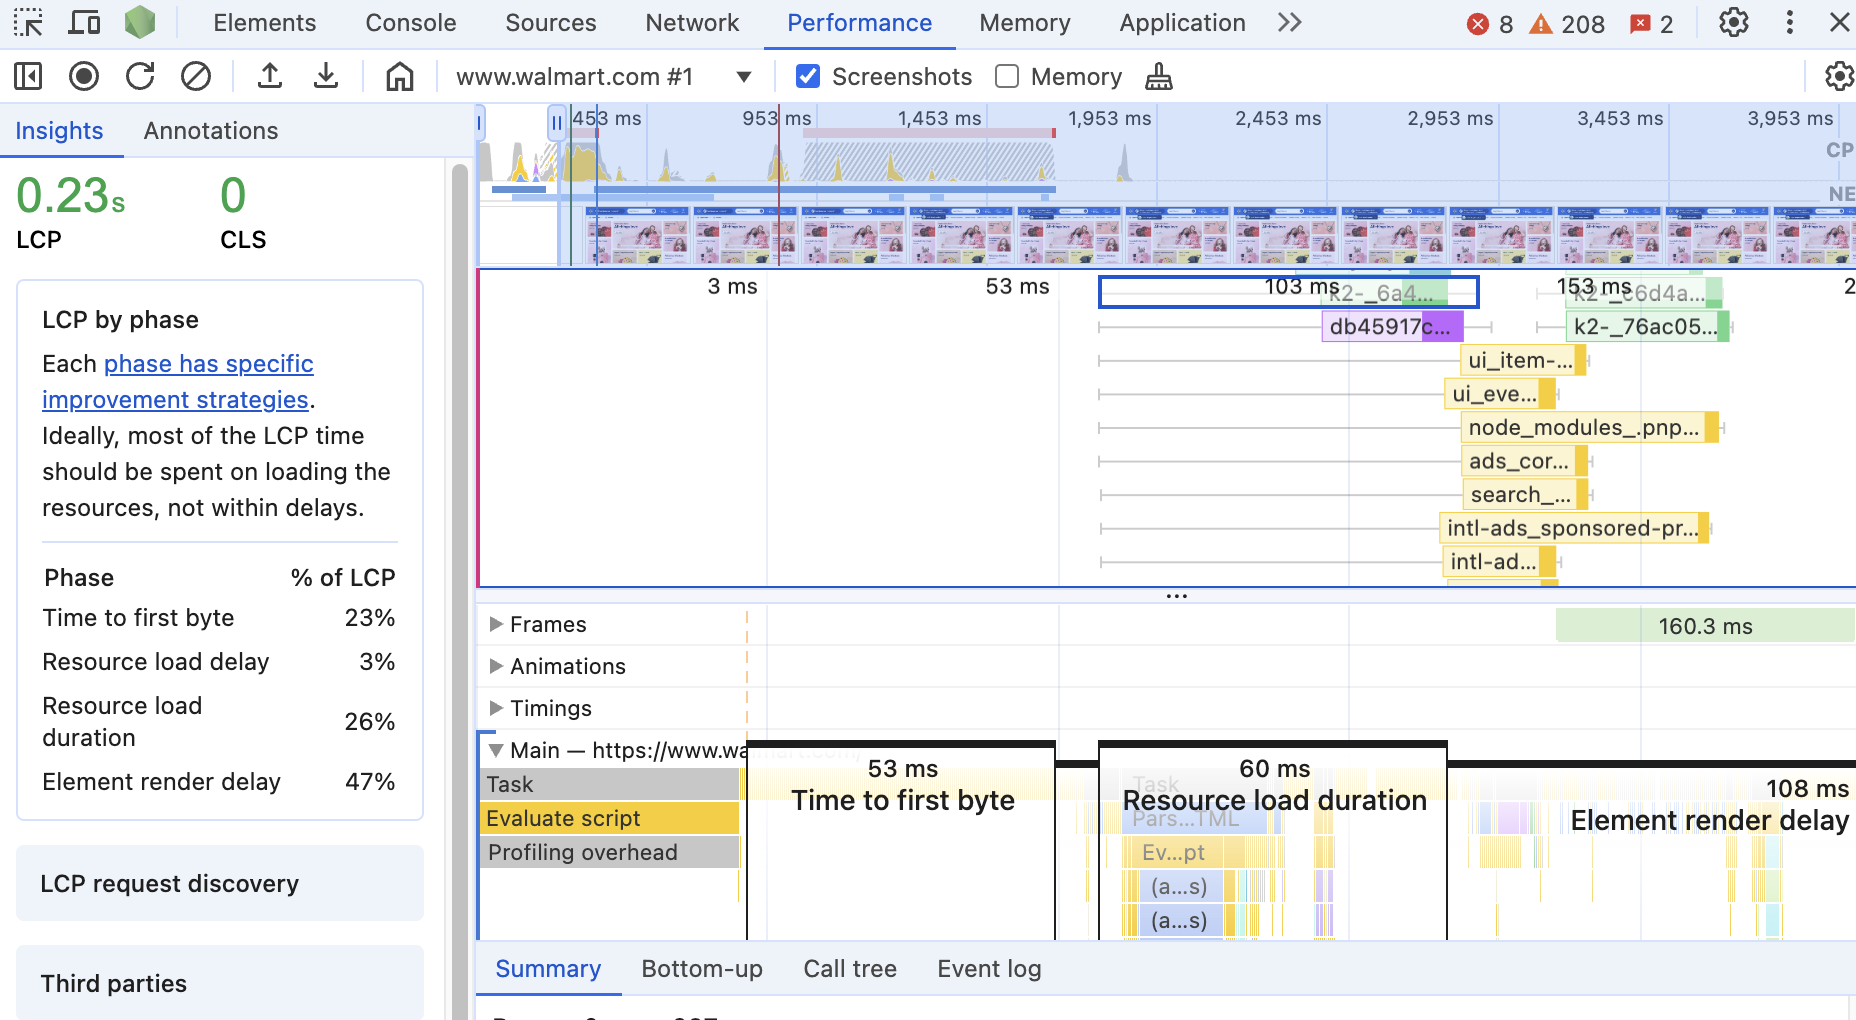
Chrome's developer tools let you check LCP load duration in the Performance tab.
Record a page load profile, expand the sidebar, and then open the LCP by phase breakdown. You can then see the different subparts both in the sidebar and in a trace annotation.
How to fix high LCP Load Duration
You can follow these tips in order to reduce load duration for LCP elements:
- Serve images in modern formats
- Use responsive images
- Avoid bandwidth competition from other resources
Serve images in modern formats
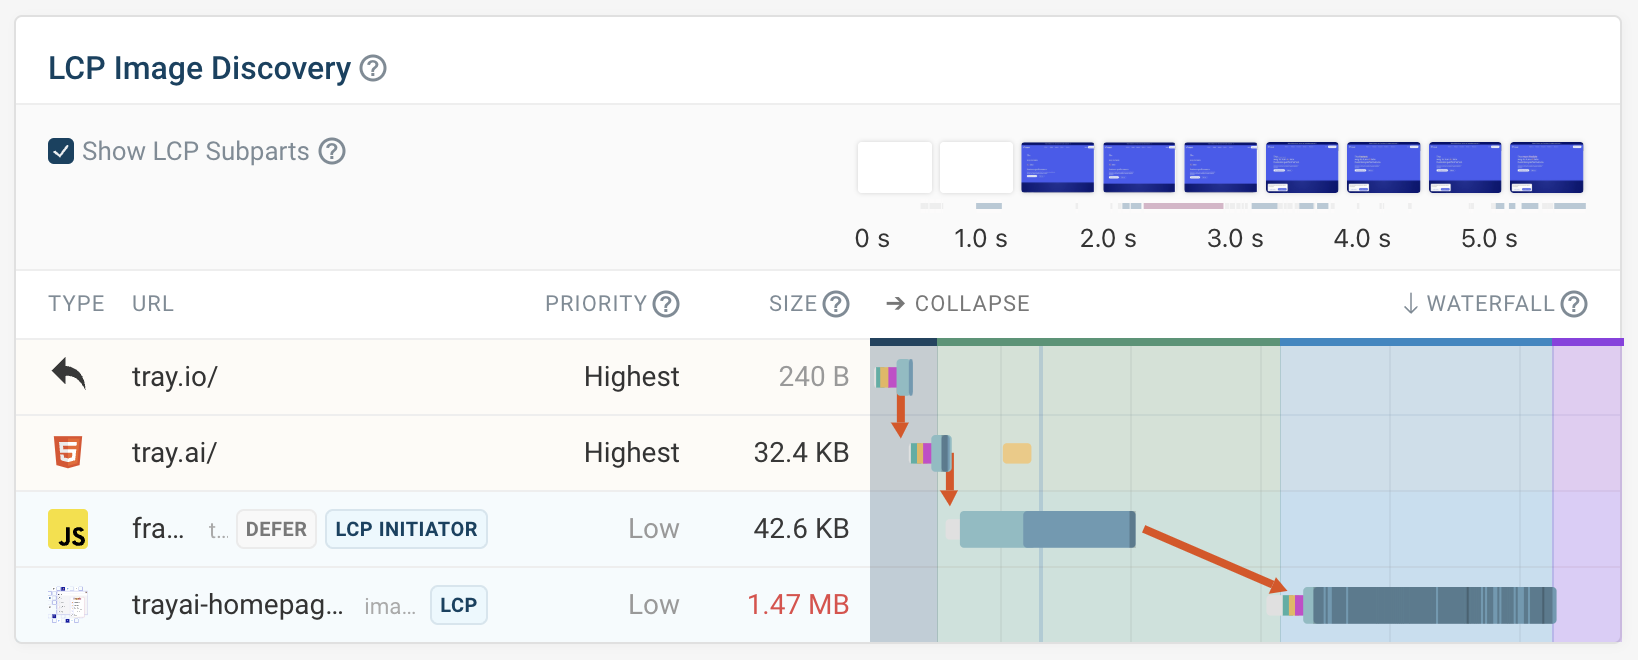
Next-gen image formats like WebP and AVIF reduce file size and therefore achieve faster image downloads.
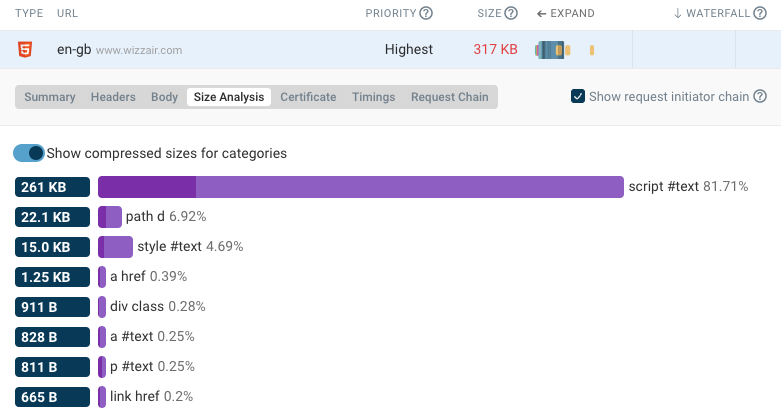
Large images increase resource load duration, as you can see in the example below. The LCP image is a 1.5 megabyte PNG file that takes over 2 seconds to load.
Use responsive images
Responsive images are another way to reduce image file size. Many websites serve images at only one size, which means even a low-resolution phone will end up loading a large high-resolution image.
The srcset attribute allows you to instead specify URLs that point to different versions of an image, each one sized appropriately for the relevant screen dimensions.
Avoid bandwidth competition from other resources
Network bandwidth is important for LCP load duration, as images can often require large downloads. To speed these up you should avoid loading other large resources at the same time.
In the example below we can see that a large HTML document is downloading slowly, and taking away bandwidth from the LCP image. There are also a large number of preloaded web fonts that are loading at the same time.
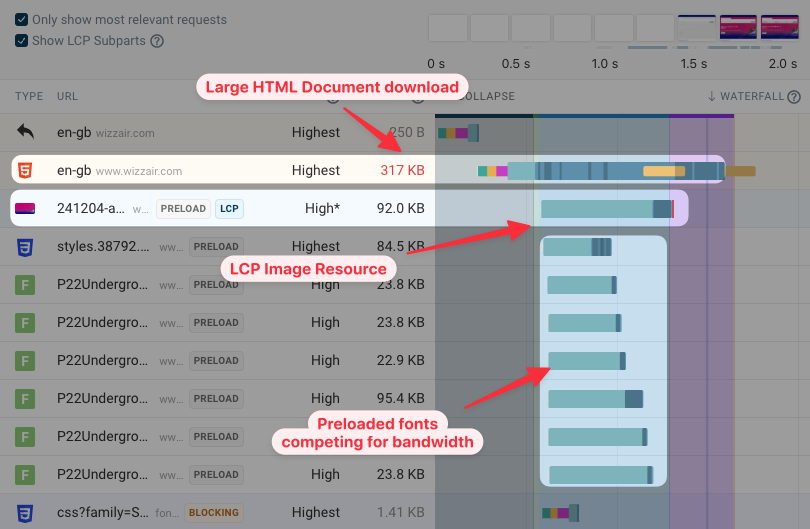
You can reduce the number of preloaded fonts and analyze the HTML size to see how you can reduce it.
Monitor LCP load duration for real users
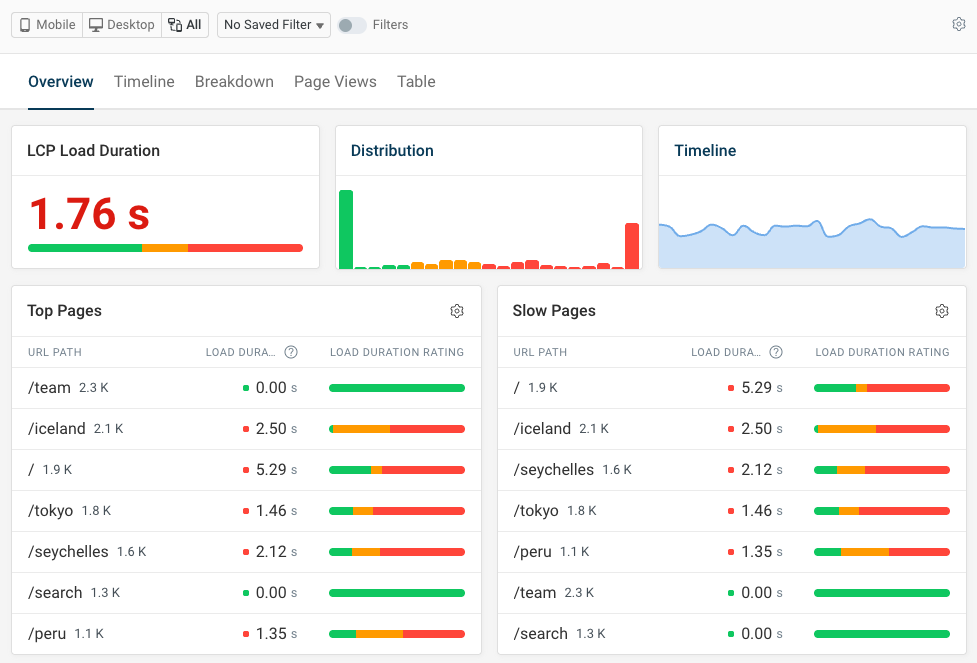
With DebugBear real user monitoring you can measure how fast images load for real visitors on your website.
View Largest Contentful Paint and Load Duration scores across your website and see how page experience varies for different users.
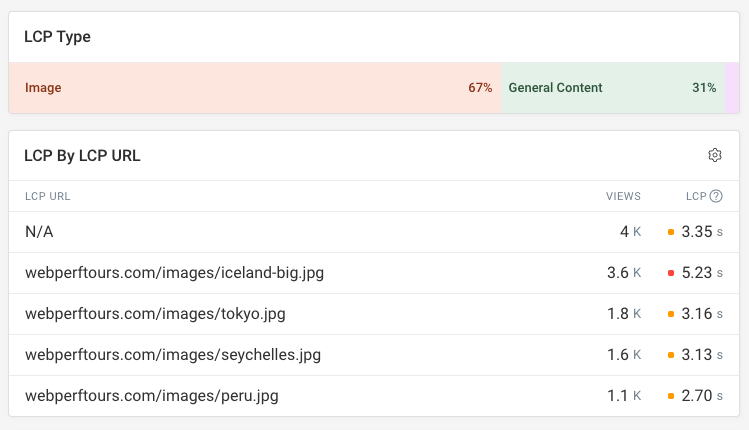
For example, you can see how load duration depends on the LCP image URL. Larger images will take longer to load, pointing to potential performance issues.
The URL breakdown lets you pinpoint specific performance issues on your website and optimize individual images that frequently cause issues.
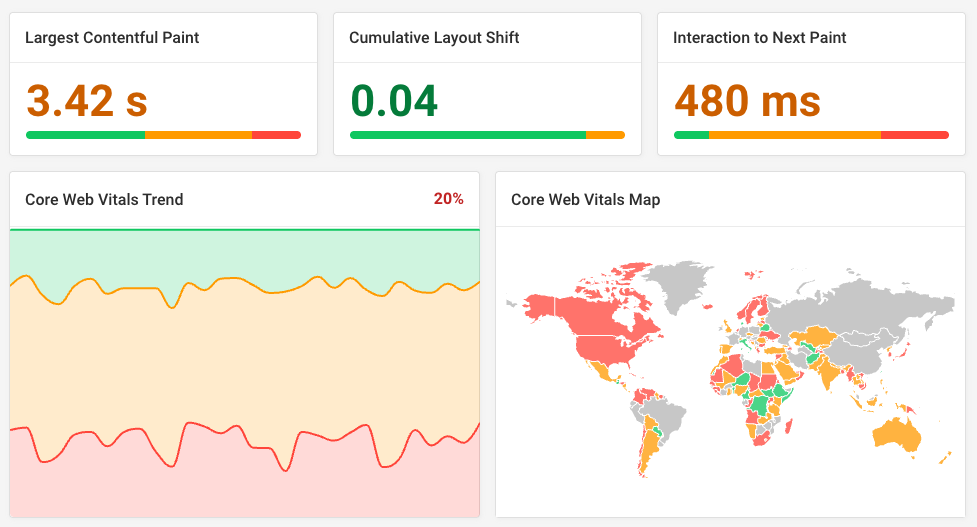
In addition to tracking LCP, DebugBear also helps you monitor other Core Web Vitals metrics across your whole website:
- Identify pages with poor LCP scores
- Check how network latency impacts load duration
- See what interactions delay Interaction to Next Paint
- Identify page elements causing Cumulative Layout Shift issues


Monitor Page Speed & Core Web Vitals
DebugBear monitoring includes:
- In-depth Page Speed Reports
- Automated Recommendations
- Real User Analytics Data