
'Reduce unused JavaScript' is a warning you'll encounter in Lighthouse-based web performance auditing tools, such as the local Lighthouse tool in Chrome DevTools, PageSpeed Insights, and DebugBear.
Unused JavaScript harms web performance because it slows down your page without providing any tangible benefits. It's like taking a bunch of clothes you won't need for a trip but still having to carry them around and paying a higher baggage fee on the plane.
To optimize your site for web performance and improve Core Web Vitals, you need to find a way to reduce unused JavaScript on your site. In this tutorial, we'll look into some hands-on techniques you can use to achieve this goal.
How Does Unused JavaScript Hurt Website Performance?
Having unused JavaScript on a page hurts website performance in a couple of ways:
- The page load time, together with the First Contentful Paint (FCP) and Largest Contentful Paint (LCP) metrics, will increase because the browser needs to download larger and/or more files.
- A larger amount of JavaScript code means that the initial module evaluation will take longer.
- The compile time, which takes place before code execution, will also increase, which may harm your Interaction to Next Paint results, as the page will start responding later to user interactions.
Detect Unused JavaScript
To reduce unused JavaScript on your website, you first need to find it. Lighthouse shows you the scripts on your site together with their total transfer size and the potential savings, which is the approximate amount of unused JavaScript code.
Use the DebugBear website speed test to quickly run a Lighthouse test online and detect unused JavaScript code.
For example, in the screenshot below, you can see the details of the 'Reduce unused JavaScript' warning in a Lighthouse audit conducted on the Semafor Tech web page:
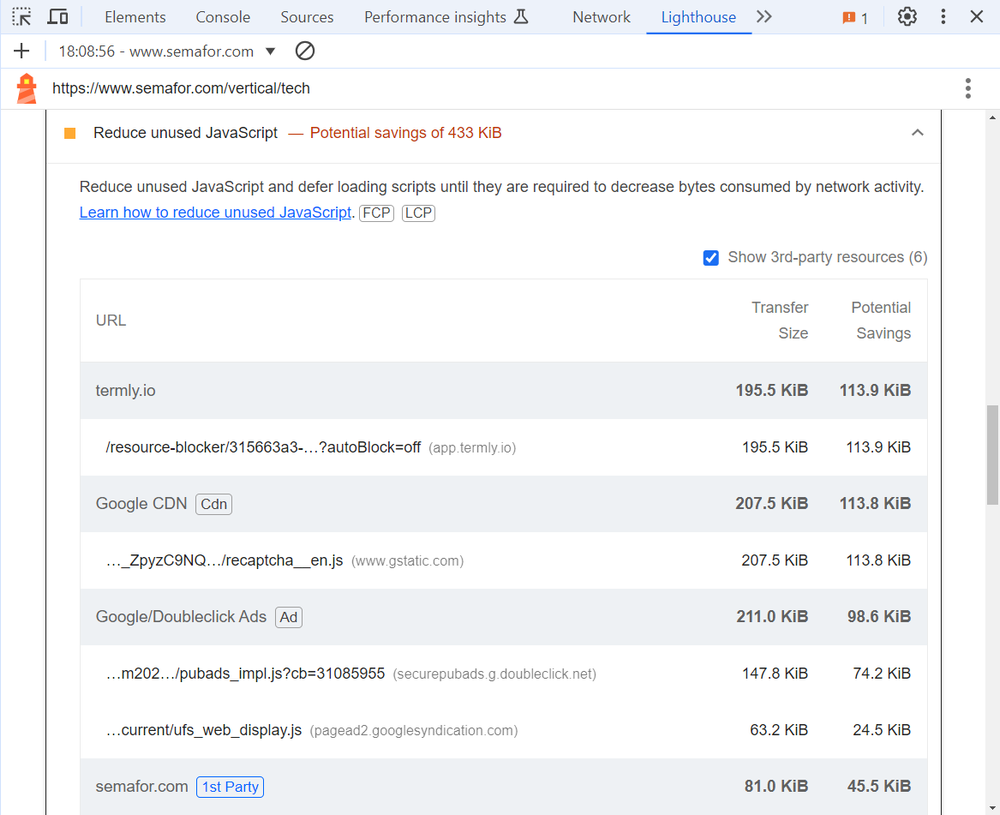
The audit explains that loading less code will reduce page weight and help your site load faster.
Reduce unused JavaScript and defer loading scripts until they are required to decrease bytes consumed by network activity.
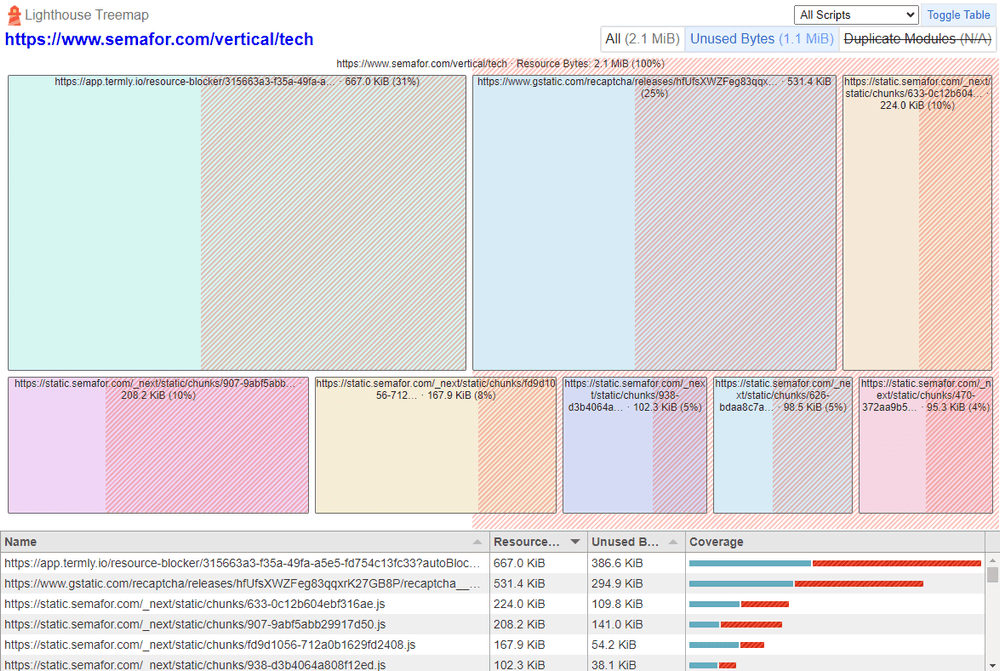
You can also visualize the used vs unused JavaScript on the page by opening the Treemap view in Lighthouse (click the View Treemap button below the metric overview).
The treemap visualizes the different JavaScript bundles on the page and their respective download size. It also indicates how much of the JavaScript file is actually used, with unused code highlighted by red stripes.
Different ways to audit unused JavaScript with Lighthouse
There are a few ways to run a similar Lighthouse audit on your (or your competitor's) website:
- Open Chrome DevTools, navigate to the Lighthouse tab, and click the Analyze page load button.
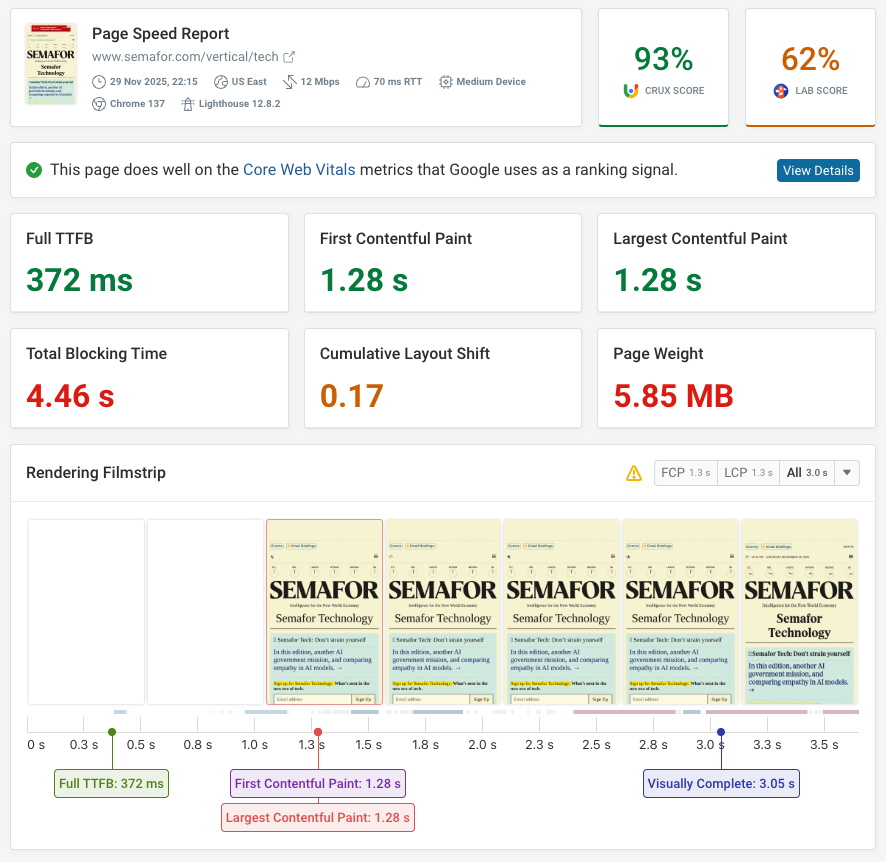
- Use Google’s PageSpeed Insights tool, which combines a Lighthouse audit with results from the Chrome User Experience (CrUX) Report.
- Run an advanced performance test using DebugBear’s Free Website Speed Tester, which provides an in-depth analysis and visualization of your Lighthouse audit, including a detailed timeline and a video recording.
If you want to go beyond using Lighthouse, you can also use an unused JavaScript code detector tool such as Knip.
Audit Your Third-Party Dependencies, and Remove What You Don't Need
Now that you have a list of your scripts with the potential savings that you could gain by removing unused JavaScript from each script, you can start reviewing your third-party dependencies and considering whether you really need them.
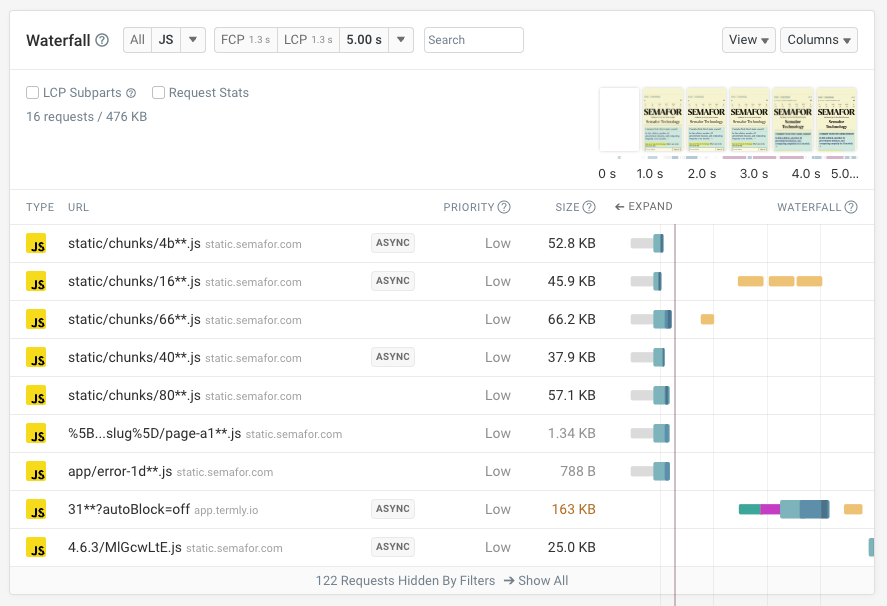
Here, you can also use our Free Website Speed Test tool that allows you to easily review your JavaScript files, shown with detailed performance data and request waterfalls (click the Requests menu in the left sidebar, and then select the JS filter):
When thinking about removing a third-party script, it doesn't necessarily mean you have to completely get rid of it. For example, you can also replace it with a more lightweight alternative.
Refactor Your First-Party JavaScript Code
While you're not able to refactor third-party JavaScript libraries as you need to use these scripts as-is, you can refactor your own JavaScript code.
By definition, refactoring means that you restructure the code without changing its intended functionality.
In terms of reducing unused JavaScript, it refers to the following workflow:
- You inspect a particular script and detect the unused code.
- You consider which parts of the unused JavaScript you can safely remove (for example, under different conditions, the currently unused code may be needed, e.g. on mobile devices).
- You remove all the unused code parts that you safely can.
- You go through each of your first-party script files, and rinse and repeat the process.
To analyze your scripts for unused code, you can use the Coverage tab of Chrome DevTools. To open it, click the three dots icon in the top-right corner of DevTools. When the context menu appears, click the More tools item, then select the Coverage option, and reload the page.
The Coverage pane has a couple of options — for example, you can filter for both JavaScript and your own domain name so that you can find your first-party scripts easily.
While in the bottom Coverage pane you can see a list of your first-party scripts together with the percentage of unused bytes, in the top Sources pane Chrome DevTools shows the inspected file in a line-by-line view and highlights the unused lines using a vertical red line:
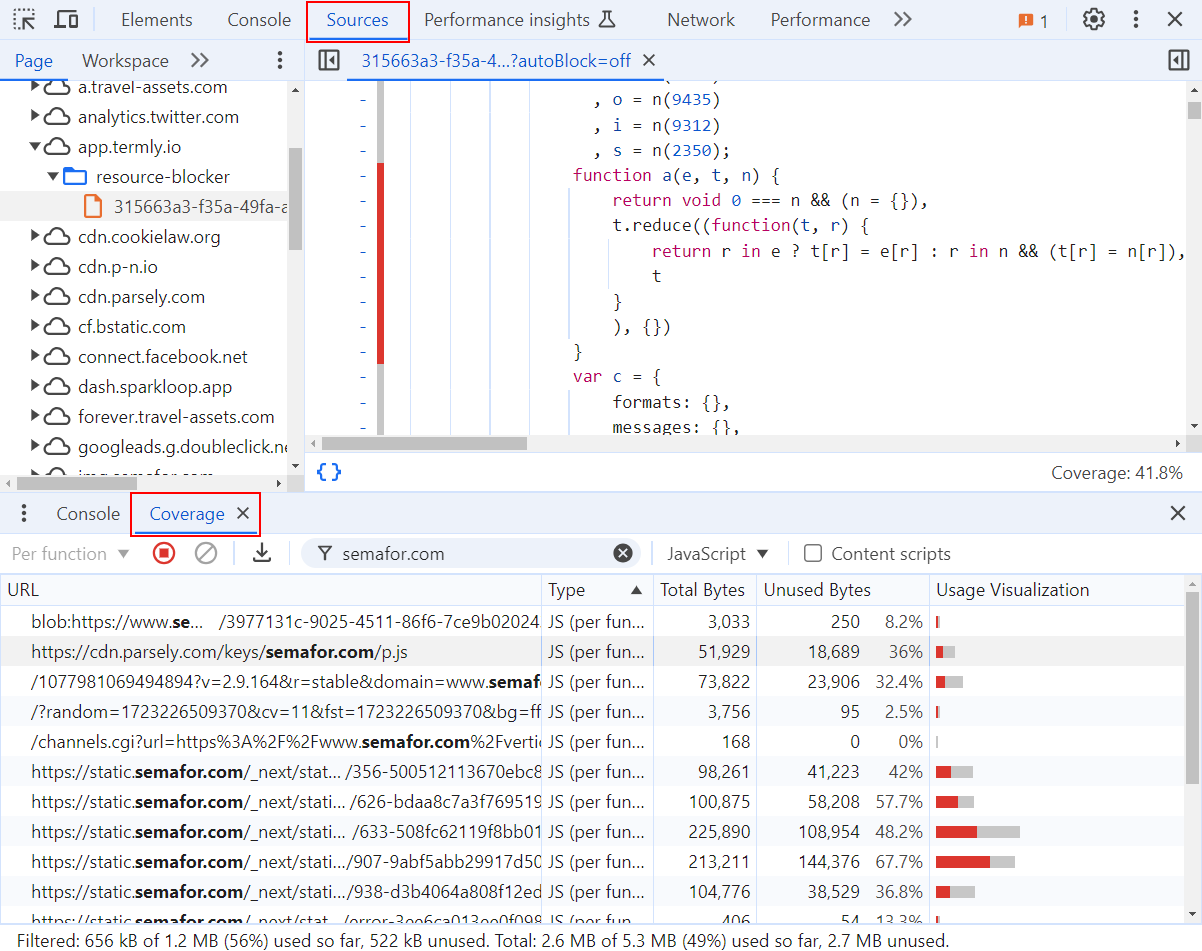
Don't forget to test the scripts under different conditions, e.g., using various viewports or interacting with the page to trigger event listeners, as the used-unused JavaScript code ratio is shown in real time and can change as you're modifying the conditions.
Minify or Bundle Your Scripts
You can further reduce unused JavaScript on your website by minifying or bundling your scripts.
Minification removes unnecessary characters, such as white spaces, code comments, and line breaks, from your scripts to shrink their size. You can think of it as a passive way of reducing unused JavaScript, as these unnecessary characters still qualify as JavaScript code.
To learn more about how minification works, check out our guide on how to minify JavaScript and CSS code. To minify your JavaScript files, you can use tools such as JSCompress, UglifyJS, or the Toptal JavaScript Minifier.
Bundling is a more complex (but also more efficient) process than minification, as it combines minification with advanced performance optimization features, such as:
- Code splitting – It splits your JavaScript code into smaller chunks so that the browser only downloads what’s really used on the page — see our article on how code splitting works.
- Conditional loading – It loads resources based on the presence of one or more conditions (e.g. if the user is logged into the site).
- Dead code elimination – It removes code that the browser can't reach under any circumstances.
- Tree shaking – This is an advanced form of dead code elimination; it removes unreachable code before adding it to the bundle.
- Scope hoisting – It puts various JavaScript modules into a single scope.
- Etc.
With a module bundler, such as Webpack, Parcel, or Rollup, you can create completely custom bundles for different pages and conditions, which allows you to reduce unused JavaScript on individual pages.
Use the Web Platform's Built-In Features
When possible, you should opt-in for the web platform's built-in features instead of using extra JavaScript libraries. For example, the View Transitions API can give you an SPA-like experience during page navigation without the need for a full-blown JavaScript framework.
The Popover API is another example of a built-in feature that can help you create accessible popovers without the need for a third-party library.
Monitor Your Site to Find Unused JavaScript Early On
The best way to reduce unused JavaScript is to follow a proactive approach, including using best coding practices for JavaScript, carefully assessing third-party scripts before adding them to your page, and regularly testing your site for potential JavaScript code bloats and other web performance issues.
DebugBear can monitor your website performance over time, including JavaScript download size and execution time. When something goes wrong you can get alerts in Slack or by email.
You can also use real user monitoring to identify scripts that are slowing down user interactions or causing the page to load too slowly.
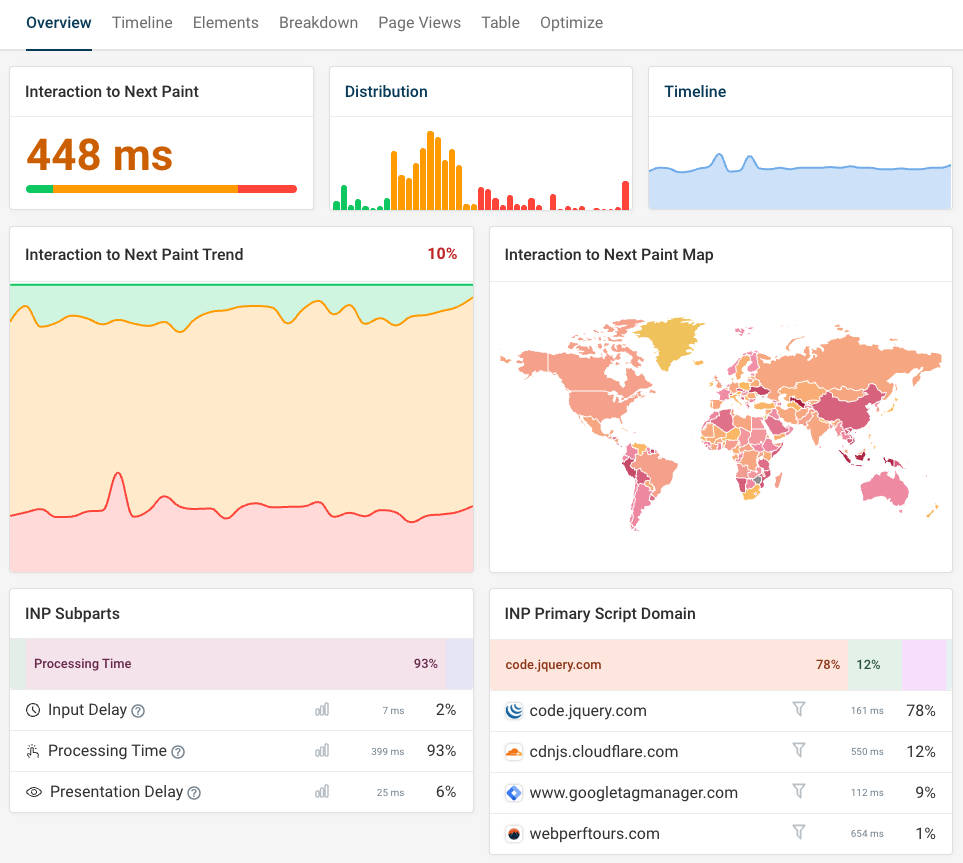
Google's Interaction to Next Paint metric tracks how fast your website responds to user input. Identify slow interactions as well as specific scripts that cause delays during each interaction.
You can also measure how this impacts user behavior by setting up conversion tracking. Sign up for a free trial.


Monitor Page Speed & Core Web Vitals
DebugBear monitoring includes:
- In-depth Page Speed Reports
- Automated Recommendations
- Real User Analytics Data