Lighthouse Treemap Explained: Analyze JavaScript Size
The treemap tool that's available through the Lighthouse report is a great tool to help you understand and optimize JavaScript code on your website.
In this article we'll explain how the treemap works and what insights you can gain from it.
How to open the Lighthouse treemap
To view the Lighthouse treemap, first run a Lighthouse test using a tool like the DebugBear website speed test or PageSpeed Insights.
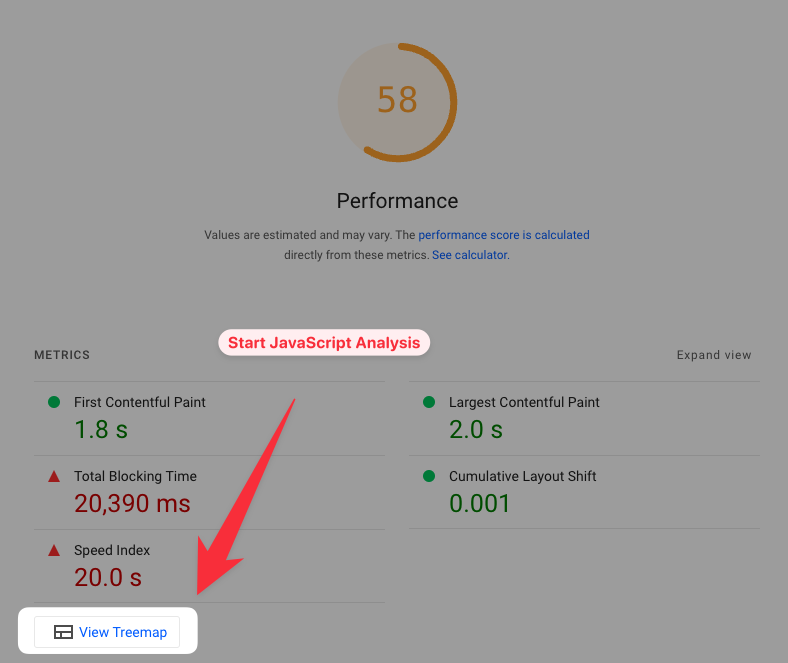
Then click for the View Treemap button in the Performance section of the report.
How to use the Lighthouse treemap
The Lighthouse treemap contains a whole bunch of information:
- What JavaScript files are loaded on your website
- The size of each JavaScript file
- Whether the code in the file is actually used on the page
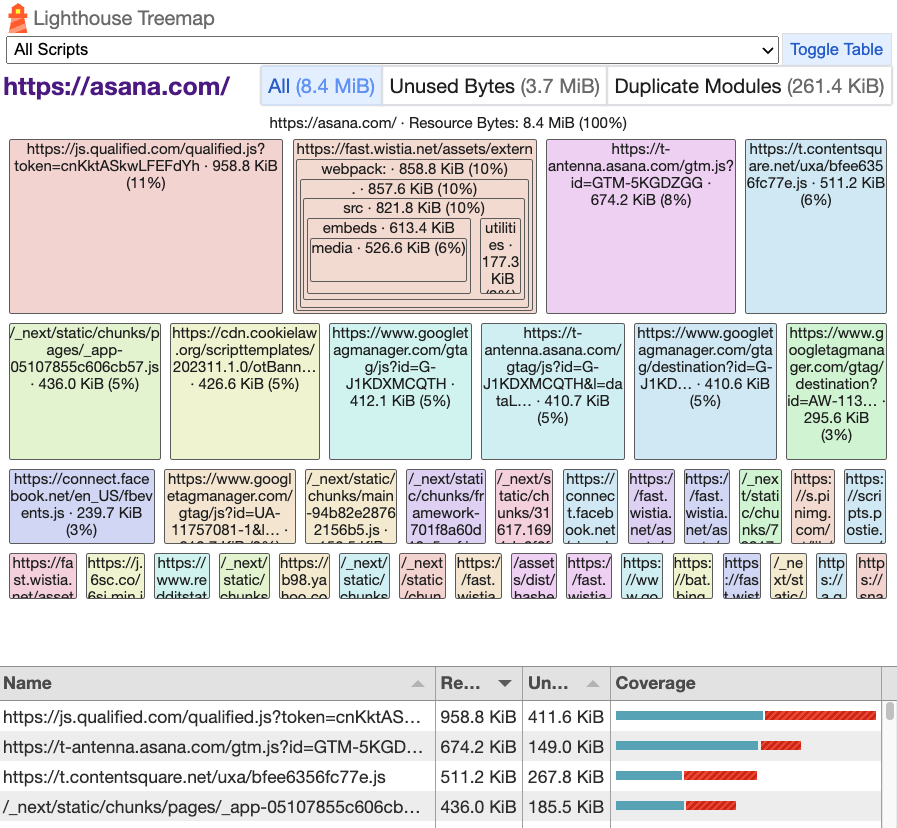
There's a lot to see and it can be overwhelming!
One thing you'll want to check if whether most of the code comes from your own website or from third-parties. In the treemap above we can find a lot of third-party code, for example:
- Wistia
- CookieLaw/OneTrust
- Google Tag Manager
- ContentSquare
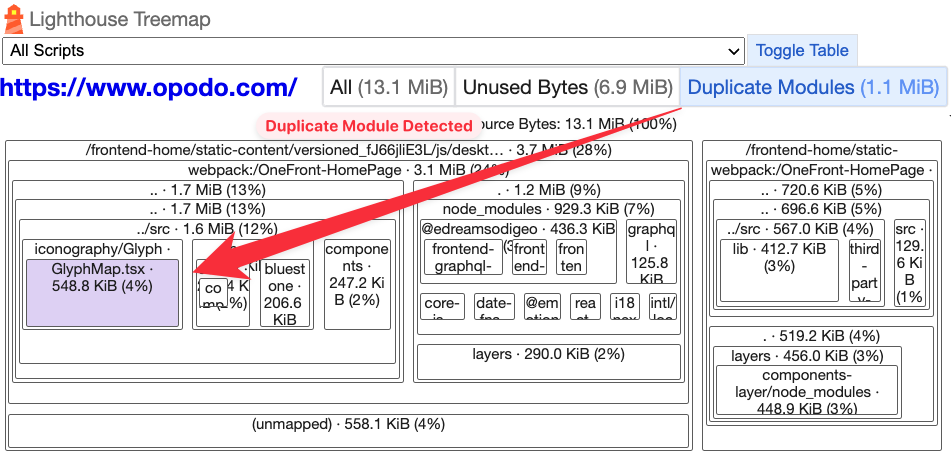
Each box represents a script and contains the script URL, uncompressed script size, and percentage of the overall script size on the page.
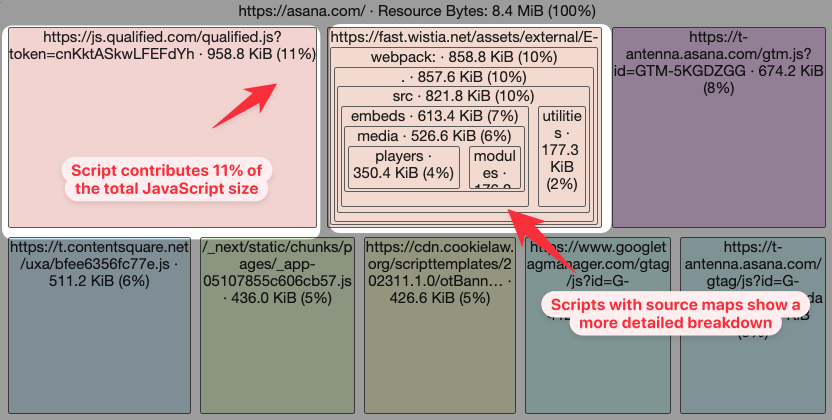
Some scripts will show a more detailed breakdown. That's the case if source maps are available for it.
Unused bytes in the Lighthouse tree map
At the top of the treemap view you'll also see an analysis showing how much of the code actually ran when loading the page. Many websites load large amounts of unused JavaScript.
In this case the page is loading 8.4 megabytes of code, but 3.7 megabytes (44%) of that never runs. Click on the Unused Bytes button to see how much of each bundle file is unused. Unused code is indicated by the red striped area.
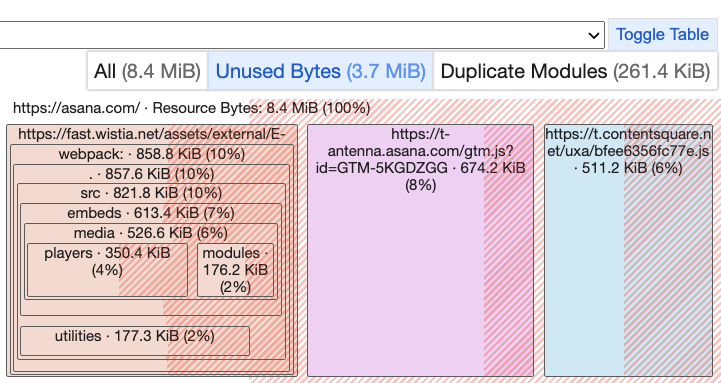
Sometimes Lighthouse can detect identical code that is used across different modules. You can see that by clicking the Duplicate Modules button.
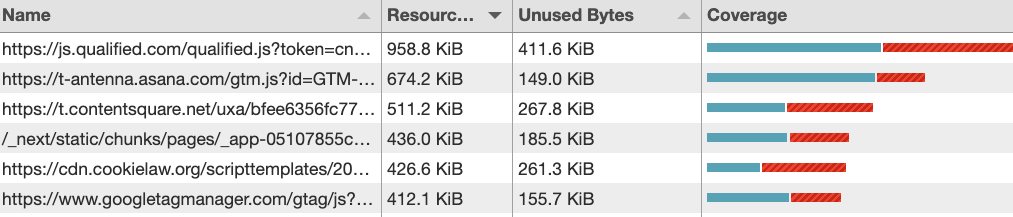
Analyze code coverage
Below the treemap itself, Lighthouse shows a table listing each module, and how many unused bytes are loaded. The Coverage column visualizes this breakdown. (Code coverage measures how much of a file or codebase ran when loading a website or running tests.)
More in-depth analysis with source maps
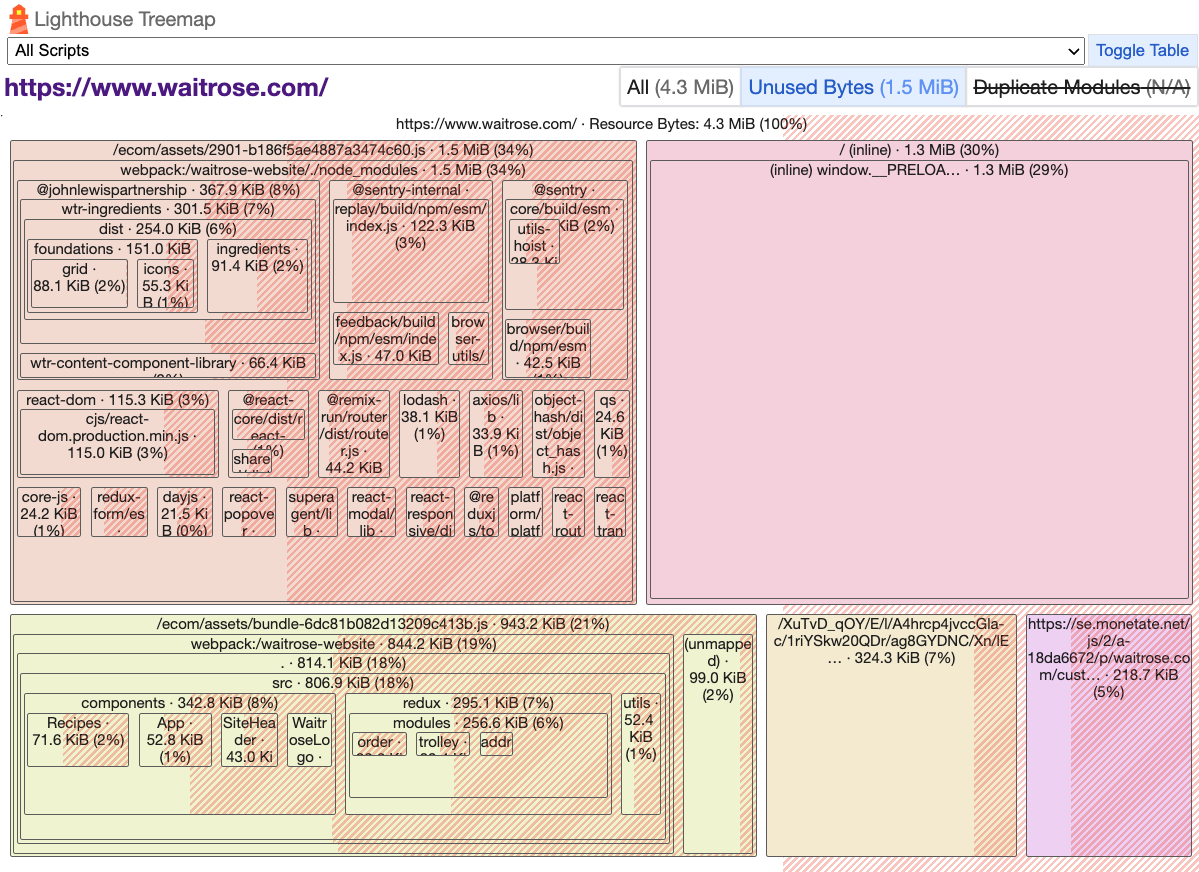
If the website publishes source maps for most of the scripts on the page that makes analyzing the treemap a lot more insightful. Source maps give us access to the original source maps and file names, before the code is bundled together and minified.
Taking a quick look at this treemap, we can see that a large amount of JavaScript code (1.3 megabytes) is embedded inline into the page HTML. (Our HTML Size Analyzer is a great tool to debug this further!)
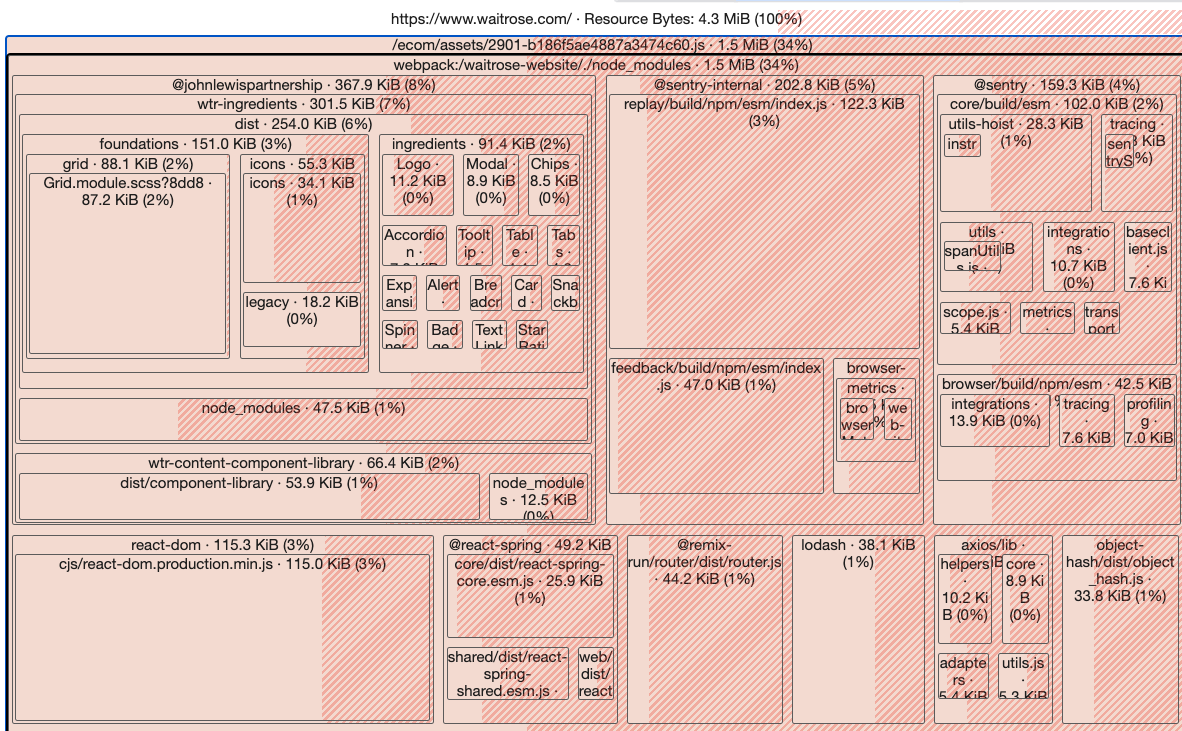
We can click on an individual script to see a more detailed breakdown of what's contained in it. Here we find that there are a few main contributors:
@johnlewispartnershipfirst-party website code@sentry-internaland@sentryfor application monitoringreact-dom,@react-springfor the application frameworklodashandaxiosas general JavaScript helper libraries
Identifying what code is contained in our bundle can help us reduce bundle size and make our website load faster. During development, a tool like webpack bundle analzyer is also a great help to understand module size.
Keep your JavaScript code small and fast
If you're trying to optimize your website performance, try DebugBear to analyze your page speed and monitor site performance over time.
Run Lighthouse tests on a schedule, compare different test results, and get additional detailed performance recommendations!


Monitor Page Speed & Core Web Vitals
DebugBear monitoring includes:
- In-depth Page Speed Reports
- Automated Recommendations
- Real User Analytics Data