In the context of web performance, measuring how your website performs is important for your users, and your business.
This post explores some differences between synthetic monitoring and real user monitoring (RUM), helping you make an informed decision about your web performance strategy.
Understanding Synthetic Monitoring and Real User Monitoring
Synthetic monitoring and real user monitoring are two different ways to collect web performance data. Let's take a look at each one and then compare the two types of performance monitoring.
What is Synthetic Monitoring?
Synthetic monitoring, also known as active monitoring, involves collecting data about your website in a controlled environment. This approach uses predefined configurations to regularly test your website's performance, functionality, and availability.

Synthetic monitoring allows you to:
-
Proactively identify issues before they impact real users
Imagine a scenario where your engineering team have just deployed a new feature. You can use synthetic monitoring to confirm that there are no performance regressions.
-
Test performance from various geographic locations
For example, your website might be too slow in a certain part of the world.
-
Monitor specific user journeys or critical paths
For example, the checkout process on your e-commerce site breaks.
-
Benchmark performance against competitors
Even if you don't work on a website, you can still include it in your lab-based tests. You can use the results of these tests to compare your website's performance to that of your competitors.
DebugBear's synthetic monitoring solution provides detailed insights into your website's performance, allowing you to catch issues early.
What is Real User Monitoring?
Real User Monitoring, also called passive monitoring, collects performance data from actual users as they interact with your website. RUM provides insights into the real-world experience of your users across different devices, browsers, and network conditions.

RUM allows you to:
- Understand the actual performance experienced by your users.
- Identify performance issues affecting certain categories of users.
- Correlate web performance with your business metrics.
While synthetic tests usually focus on specific tests results, RUM data is collected from many different visitors and you're more likely to look at statistical distributions (visualized as histograms) and percentiles.
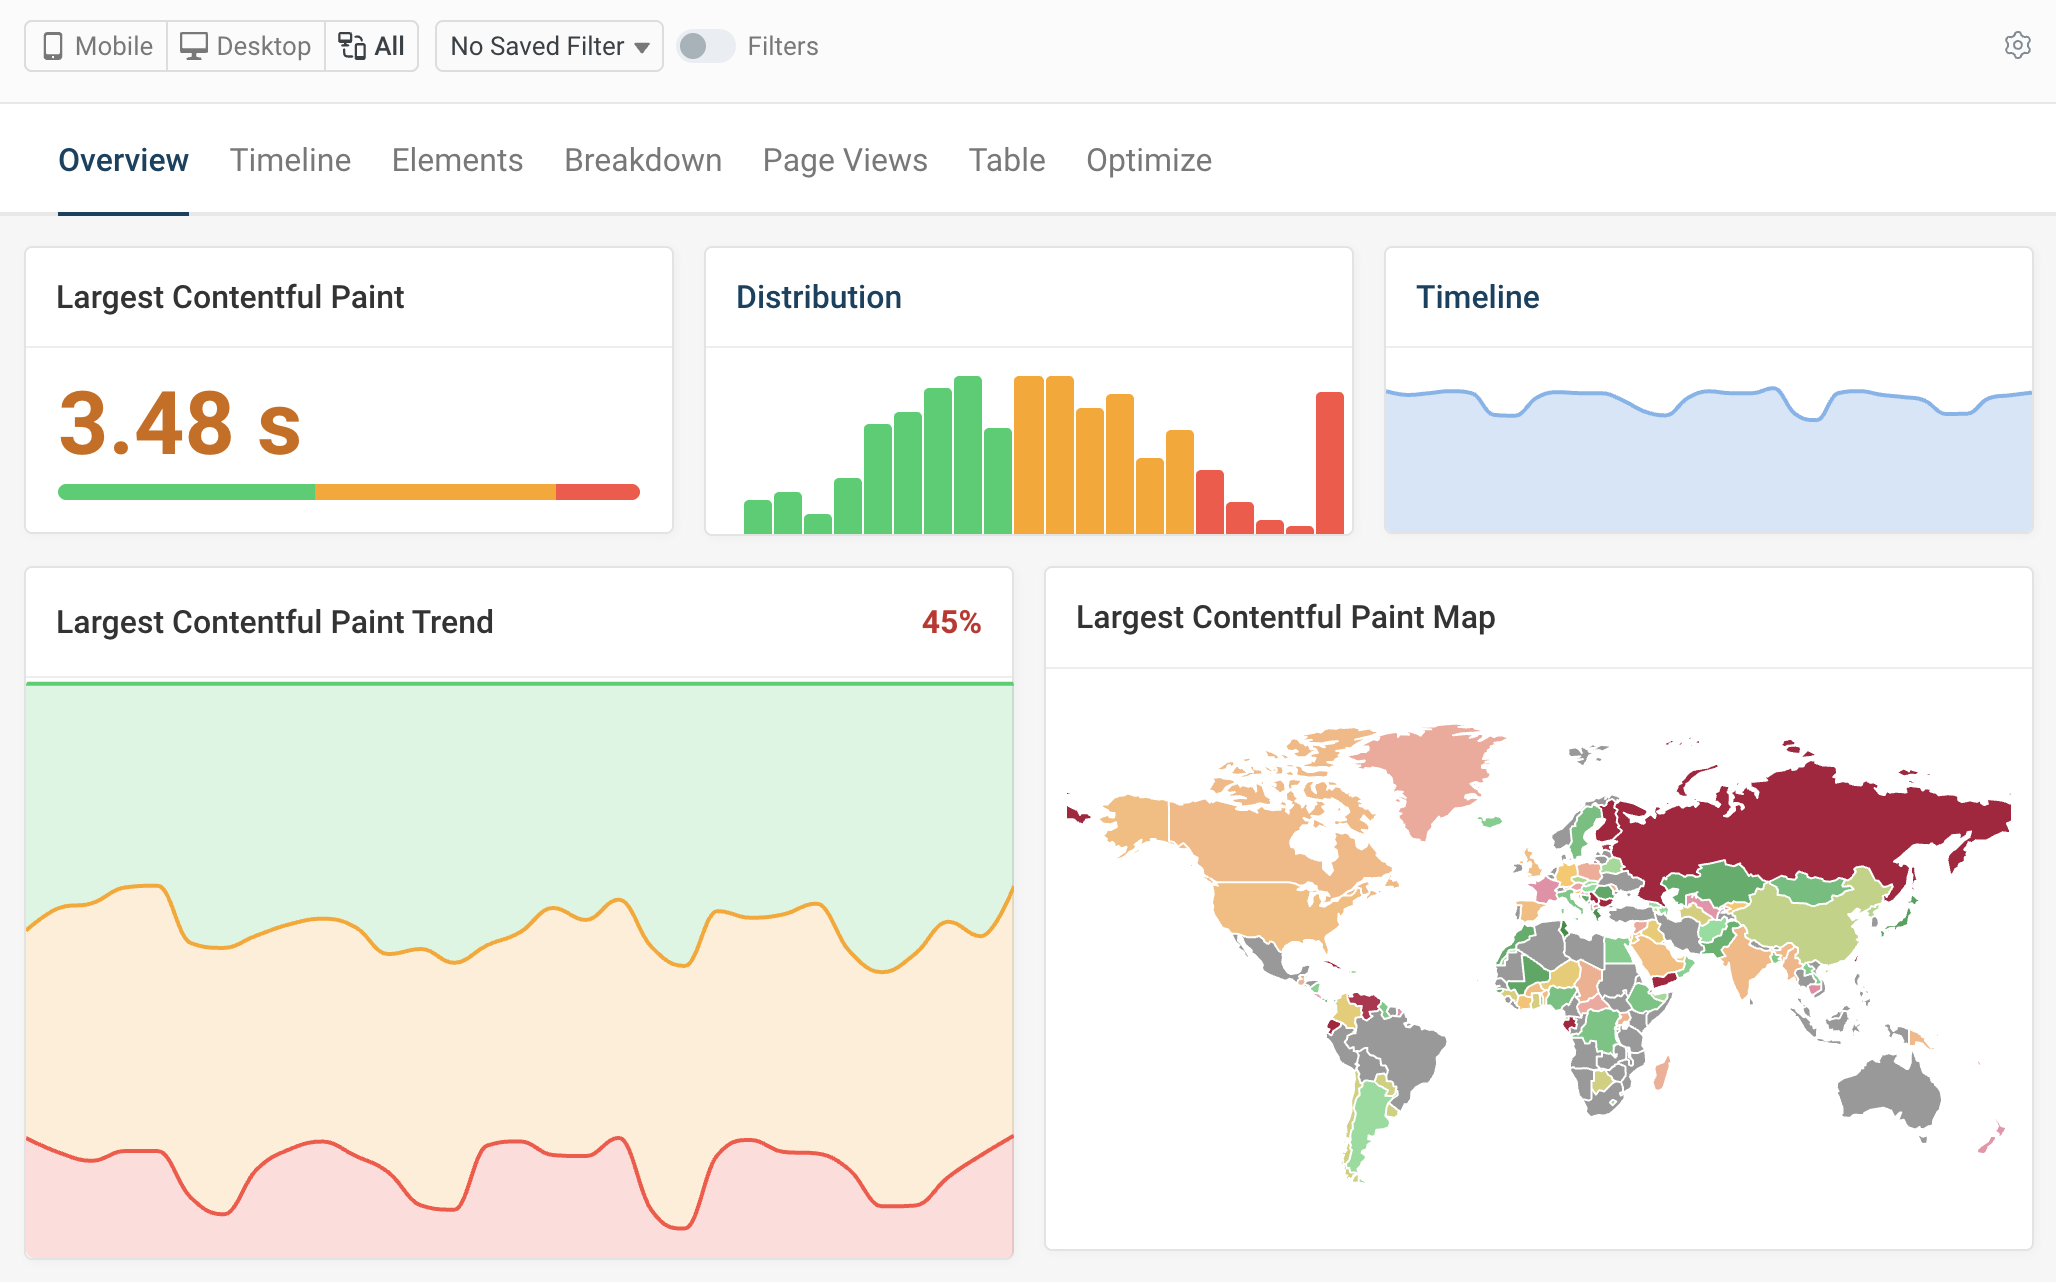
DebugBear's Real User Monitoring solution helps you analyze performance data from your actual users.
Key Differences Between Synthetic Monitoring and RUM
Both synthetic monitoring and RUM offer useful insights, but they differ in their approach and the type of data they provide. Let's explore these differences in more detail.
Control and Consistency
Synthetic monitoring lets you control the testing environment. You can specify:
- The browser (Chrome, Edge, etc.)
- Device characteristics (screen size, CPU, etc.)
- Network conditions (3G, 4G, etc.)
- Geographic locations (US, EU, etc.)
The following screenshot of Chrome's device mode shows a one-off test of the Netflix website. Various device characteristics are specified, such as the screen size and network conditions.
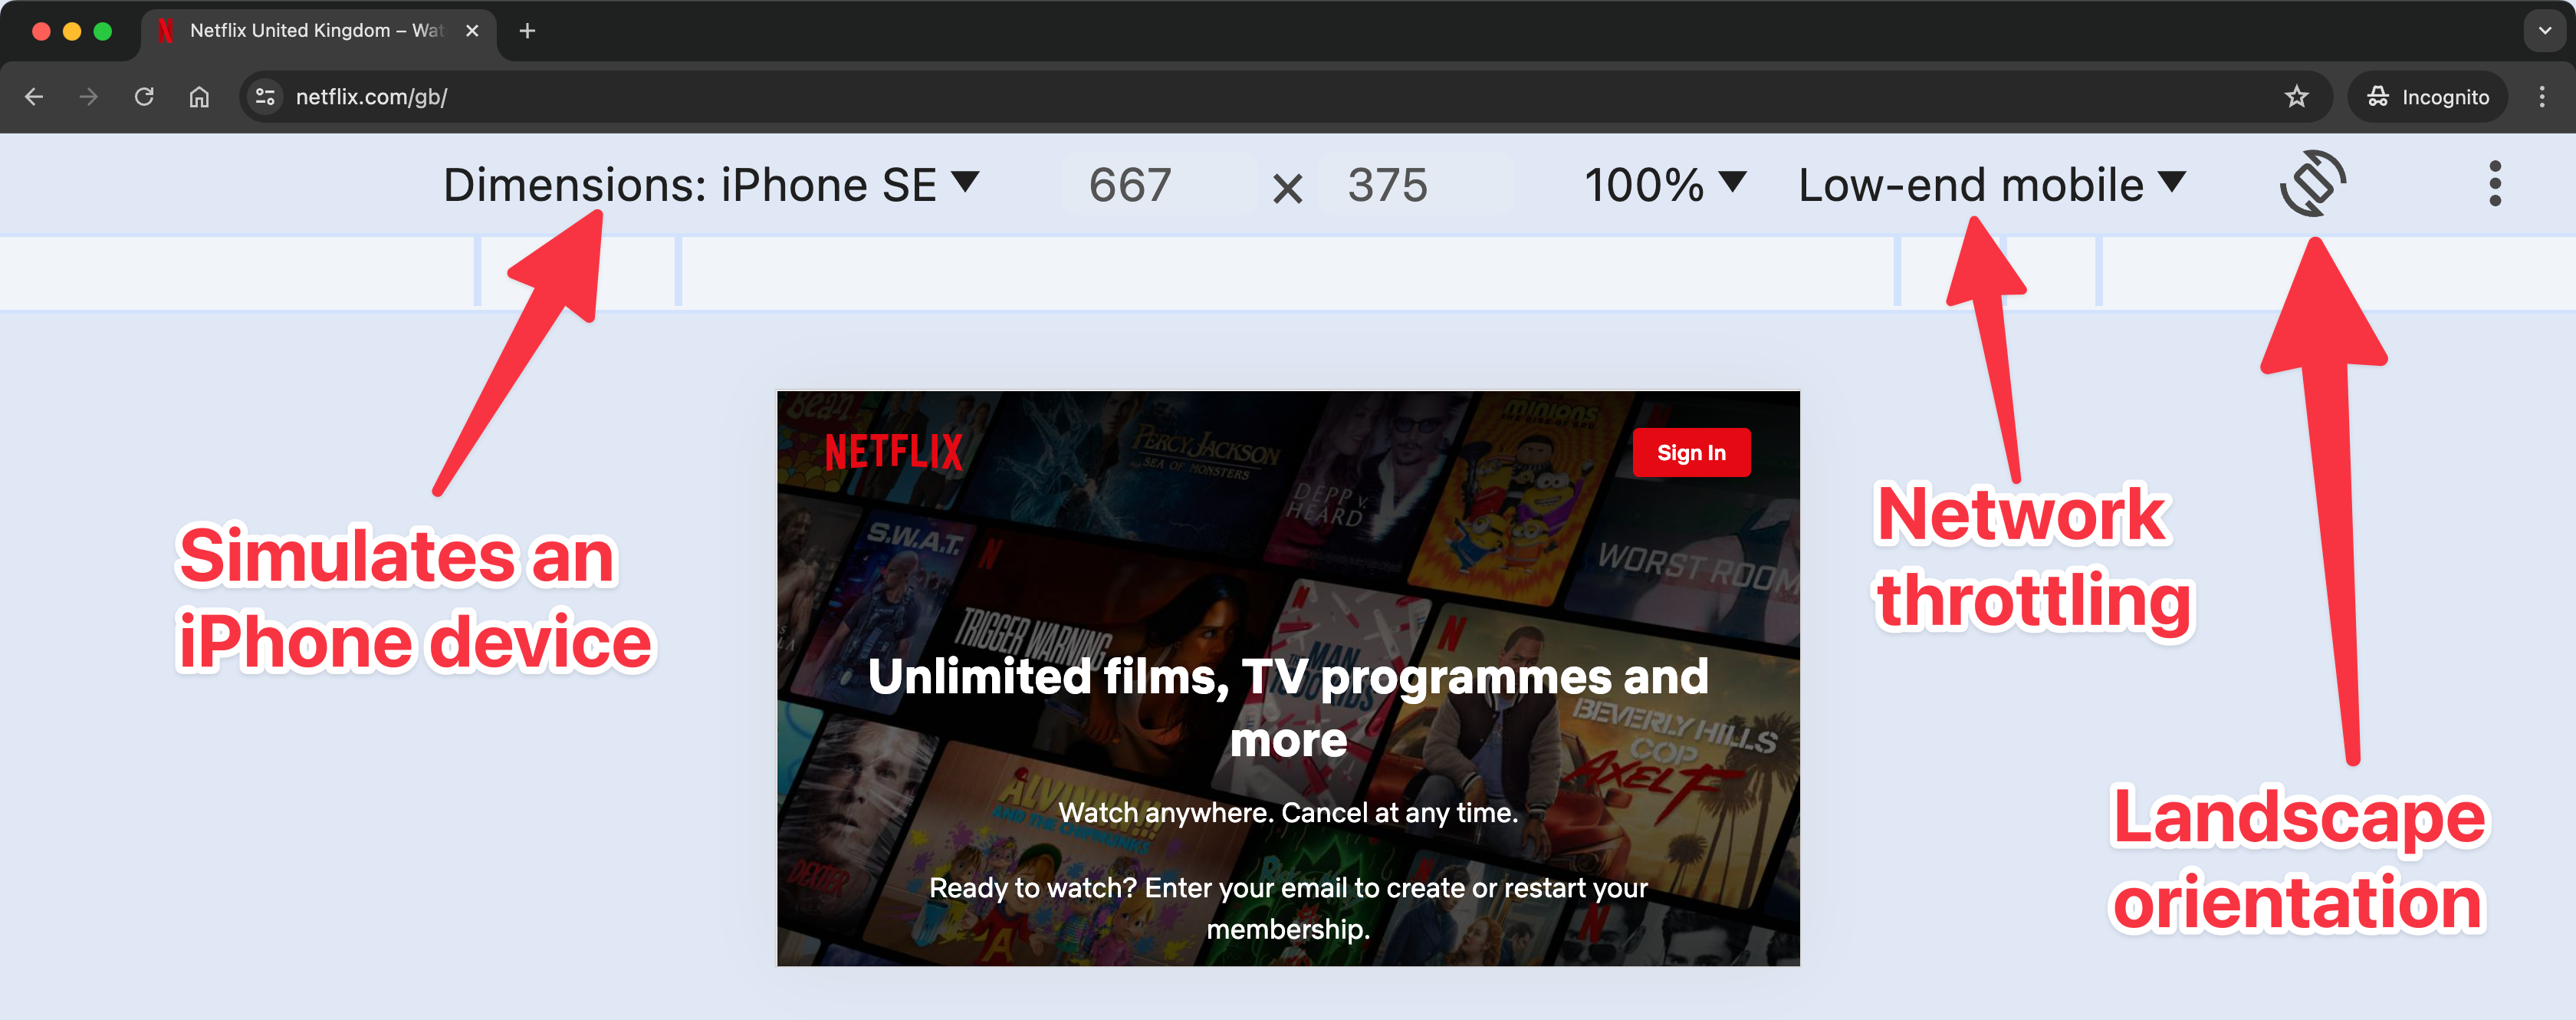
Running the same set of tests with the same conditions applied allows for benchmarking over time.
If you run a one-off performance test with free tools like PageSpeed Insights or the DebugBear website speed test you'll be able to see the environment configuration as part of the test report.

Real User Monitoring is impacted by the characteristics of your visitors:
- User device capabilities
- Network conditions (like wifi or 3G)
- Browser extensions, such as ad blockers
- User behavior and interactions
Be mindful that synthetic tests do not always reflect real-world conditions. Not only might the test environment differ from real-world conditions, but the act of running a test itself can affect the results.
In contrast, real user metrics can fluctuate with your traffic, while synthetic tests results are run using consistent test settings.
Example of a synthetic test using Lighthouse CLI
You can run this command in your terminal (assuming you have Node.js installed) to run a synthetic test to get the Largest Contentful Paint (LCP) score for the URL https://example.com:
npx lighthouse https://example.com --only-audits=largest-contentful-paint
If you run this command, you get a report that runs a synthetic test for just the LCP metric.
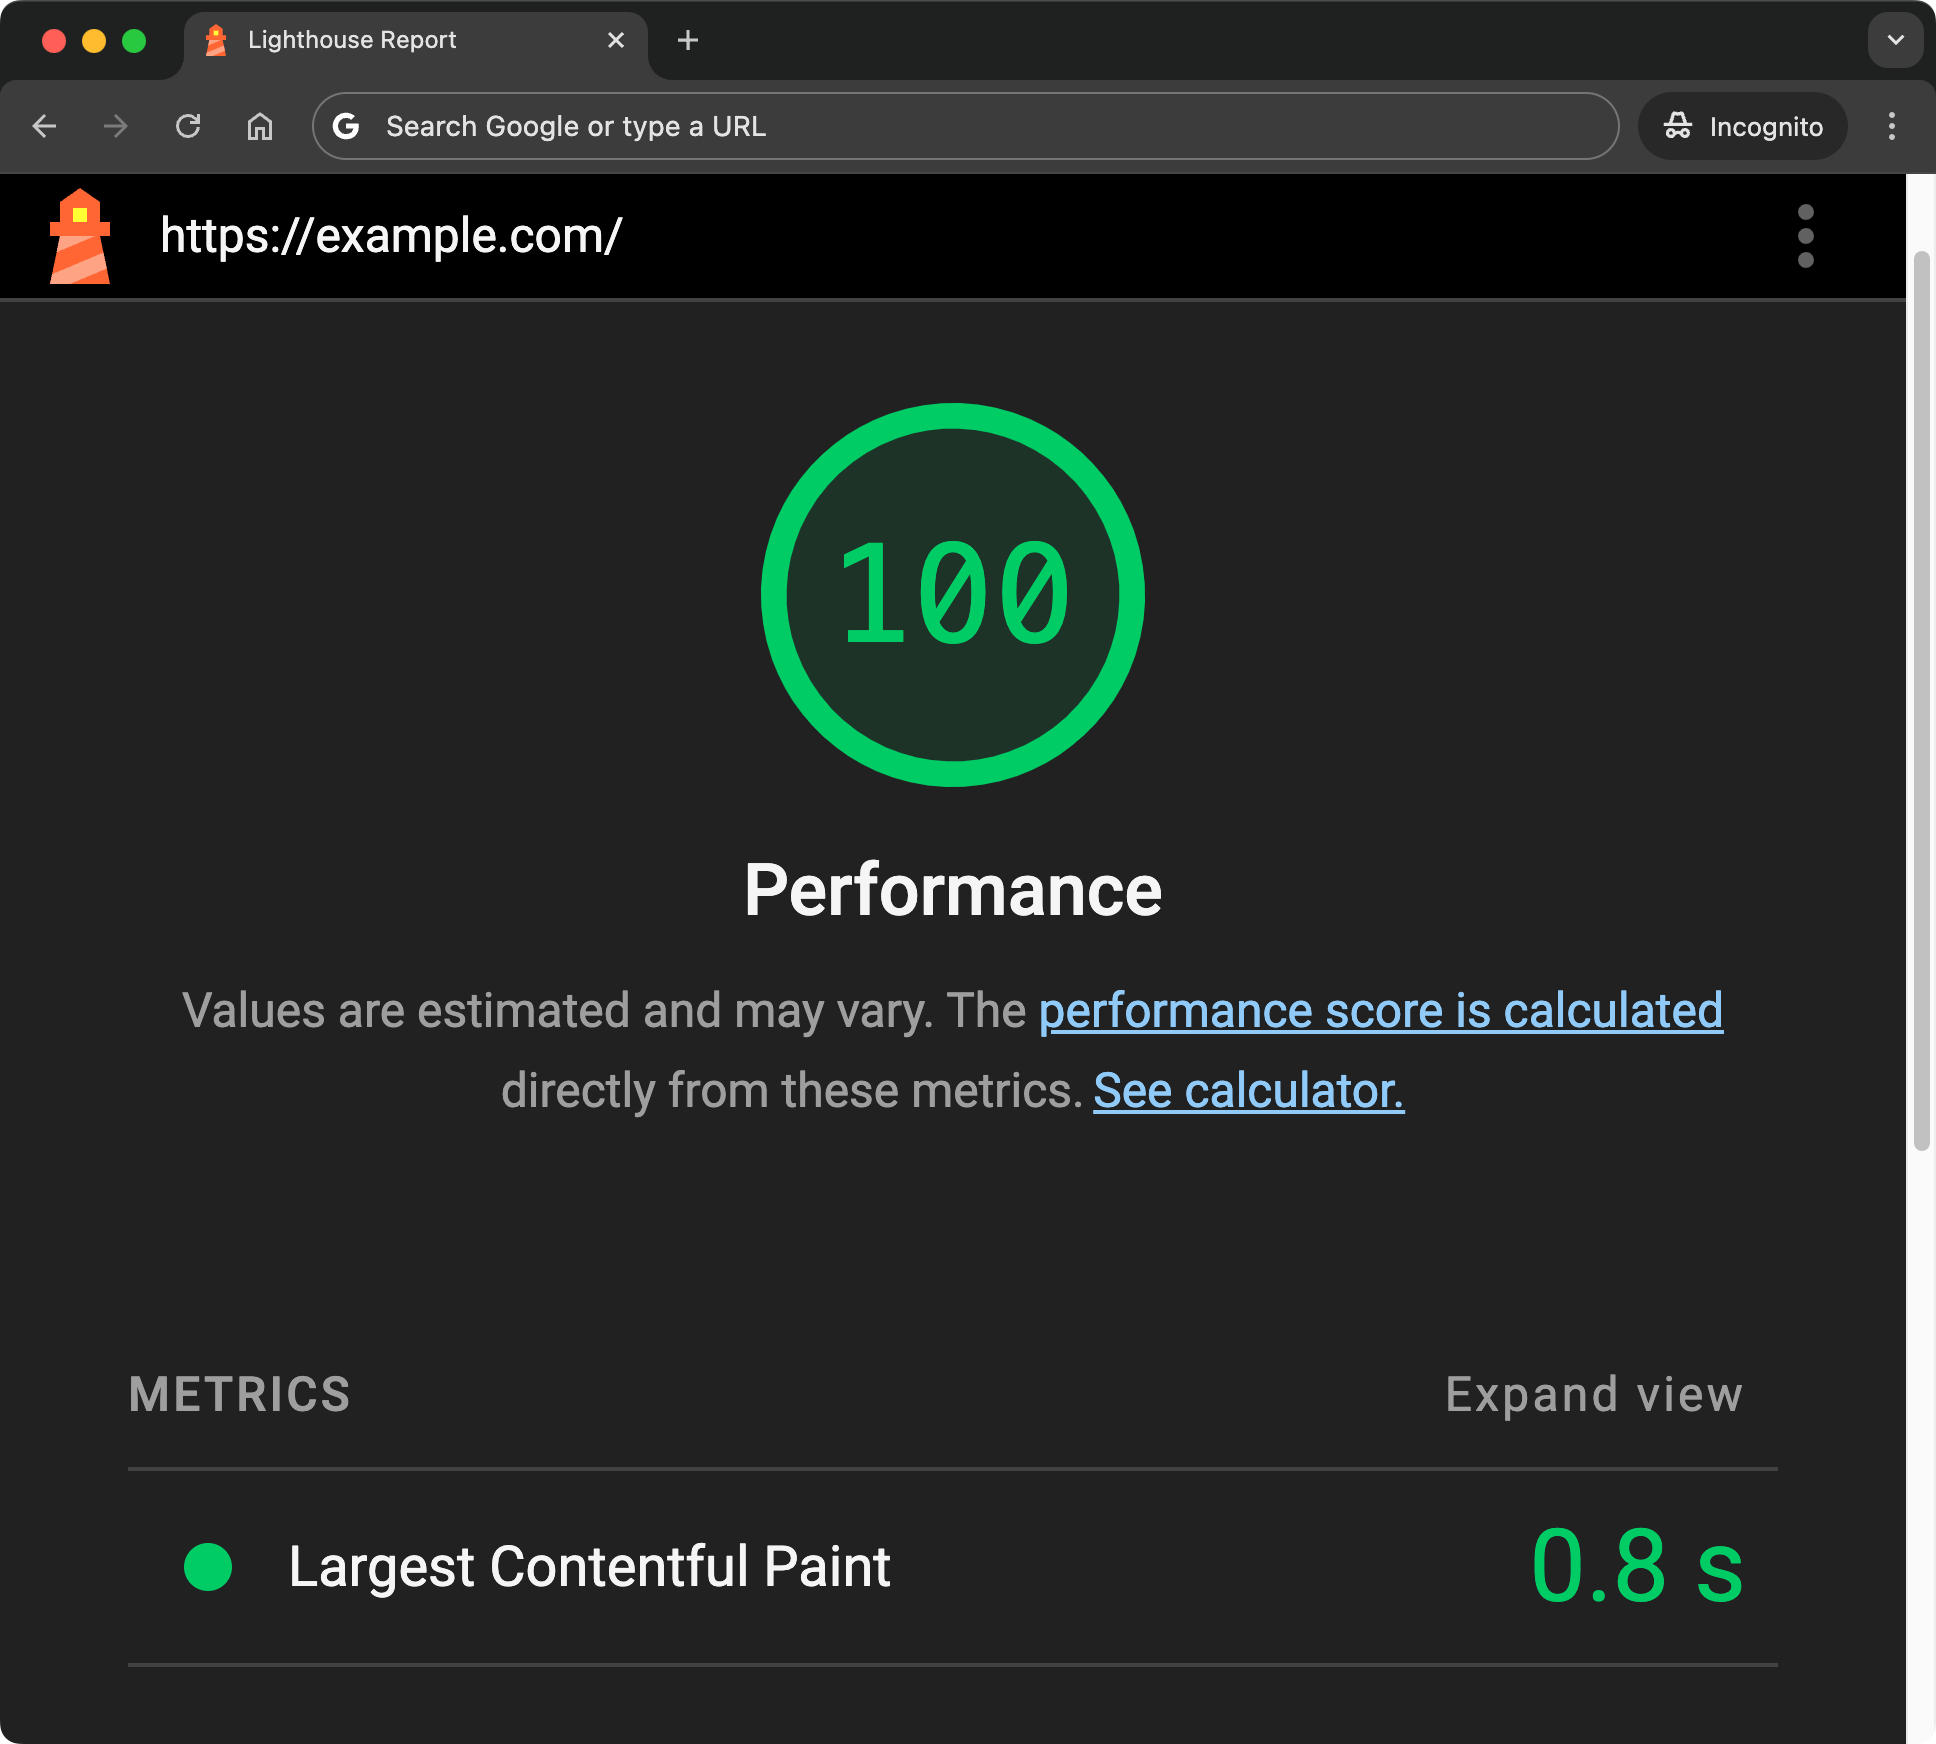
A developer might run this command on their machine before pushing a new feature to the website. Or you might run this command as part of a continuous integration pipeline to catch performance regressions.
Example of RUM data collection
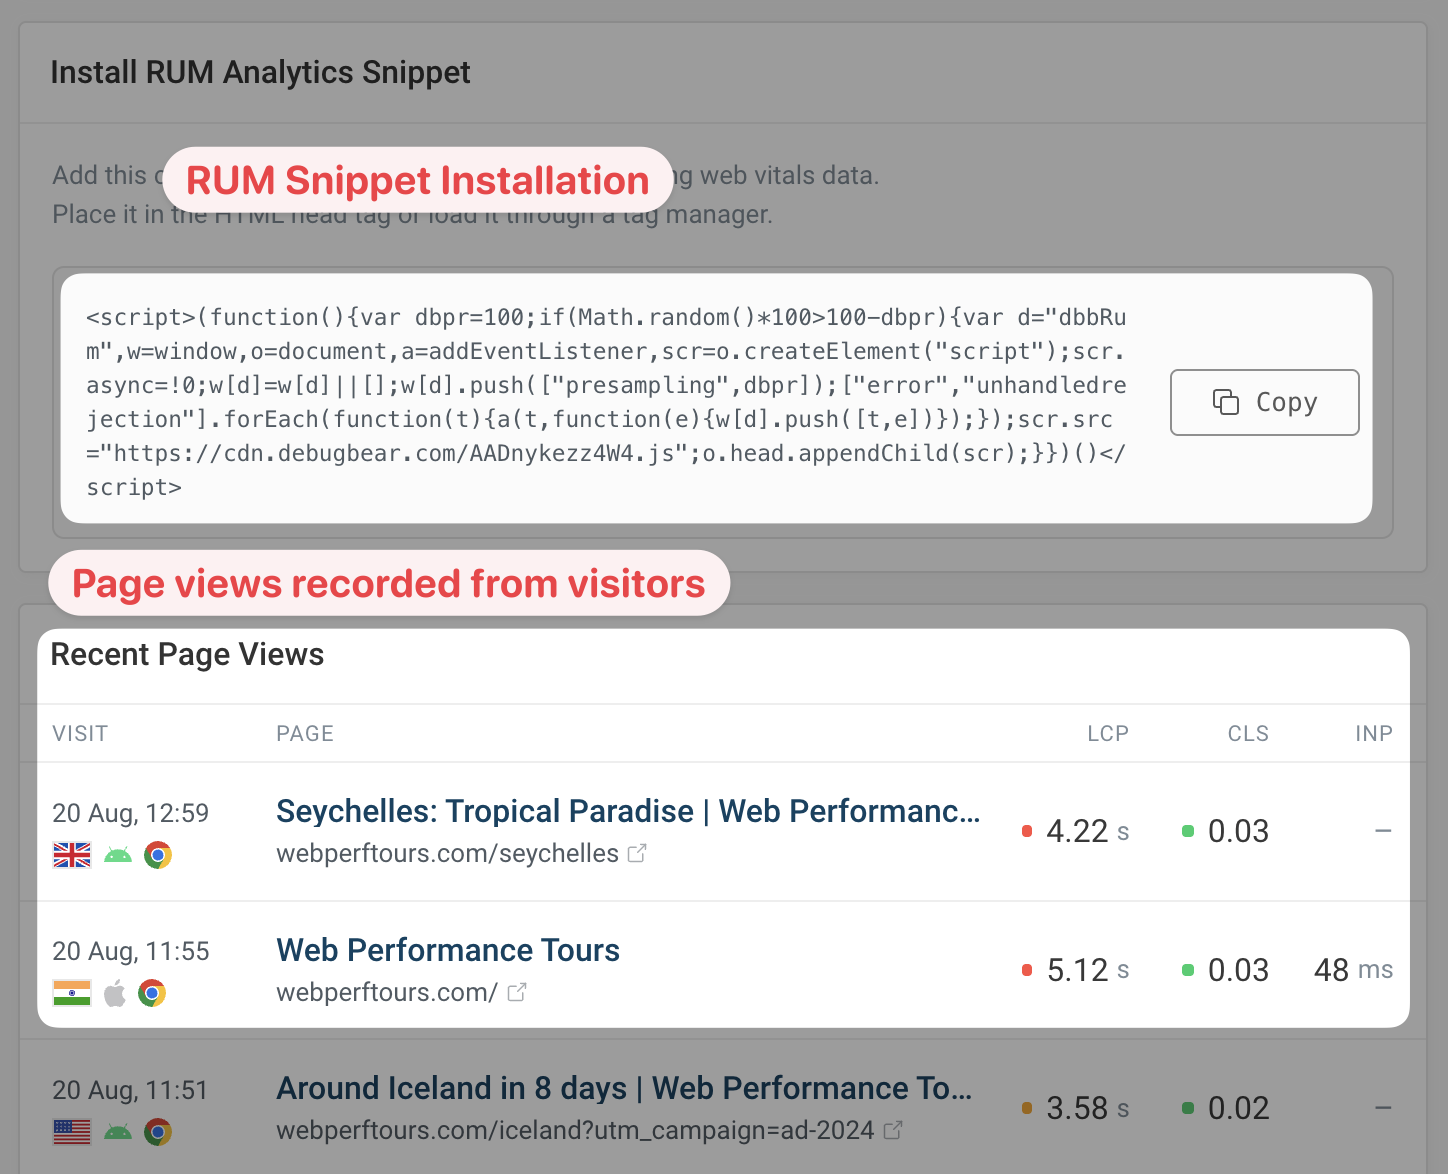
Instead of a terminal command you run on your own computer, RUM data collection is typically done by adding a script to your website. Here's an example of how you can use the PerformanceObserver API to collect LCP data. You can run this JavaScript code in your browser's developer tools console:
new PerformanceObserver((entryList) => {
  for (const entry of entryList.getEntries()) {
    console.log("LCP candidate:", entry.startTime, entry);
  }
}).observe({ type: "largest-contentful-paint", buffered: true });

// Now you might use navigator.sendBeacon to send this data to your server
Here's the output of running the code on the example.com website.
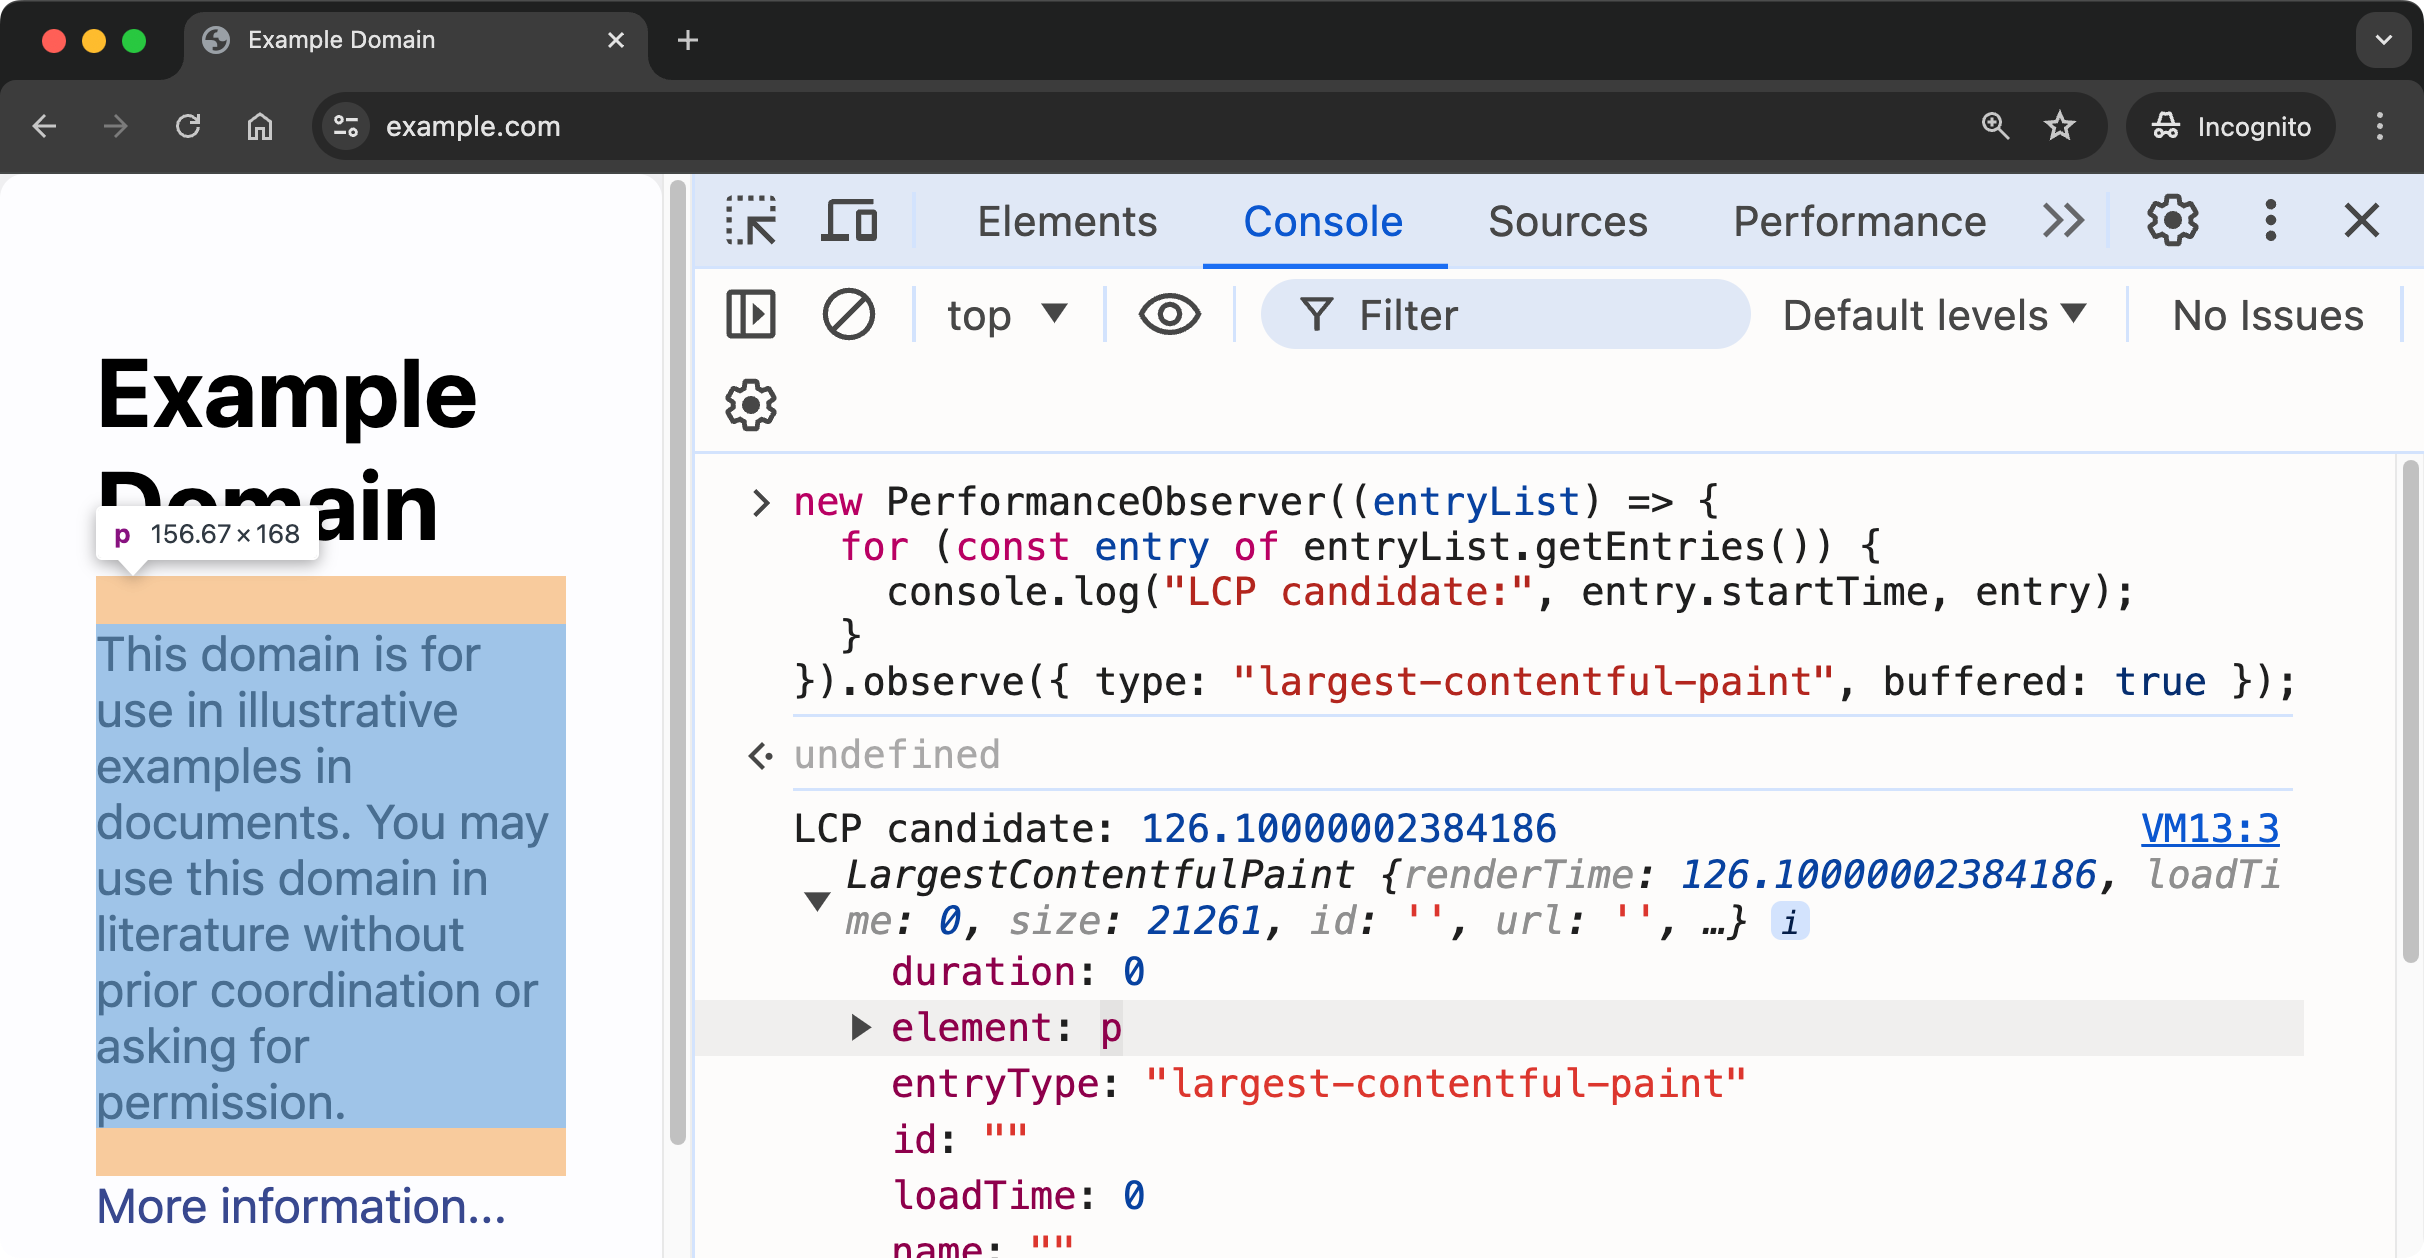
The big difference in this approach is that instead of running that code on your own computer, you're likely to deploy it to your website and collect data from real users. The previous code shown would run in the browser of every user who visits your website, where the data is then sent to your server.
Real user monitoring tools are built on top of browser APIs like the performance observer to make it easy to collect and analyze visitor data.
Proactive vs. Reactive Approach
Synthetic monitoring enables a proactive approach to performance optimization. By consistently running tests, you can:
- Detect issues before they impact users
- Validate performance improvements immediately after deployment
- Set up alerts for performance regressions
While the strategy you choose depends on your goals, you can even run synthetic tests on your staging environment to catch performance regressions before they reach production. This can form part of your continuous integration and even continuous deployment pipeline.
The following screenshot shows GitHub checks for a performance test run on a pull request. If the test fails, the pull request can be blocked from merging.

Real User Monitoring provides a reactive but comprehensive view of your website's performance. With RUM, you can:
- Identify issues as they occur in the real world
- Understand how performance can impact user behavior
- Learn about unexpected scenarios that synthetic tests might miss
Coverage and Scope
Synthetic monitoring helps you to check:
- Specific user journeys and critical paths
- Performance in different geographic locations
- Competitor websites
Note: synthetic tests are limited to the scenarios you define and will not cover all possible user interactions.
Real User Monitoring provides:
- Coverage of all pages and user interactions
- Data from a wide range of real-world conditions
- Insights into long-tail performance issues
RUM's wide coverage comes at the cost of less control over the testing environment.
Data depth
Real user monitoring data comes with some limitations for security and performance reasons. For example, browser APIs don't report resource size for third-party requests or what code is running inside of an iframe. Collecting a video recording of the page rendering process also isn't possible, as that would have a big impact on browser performance.
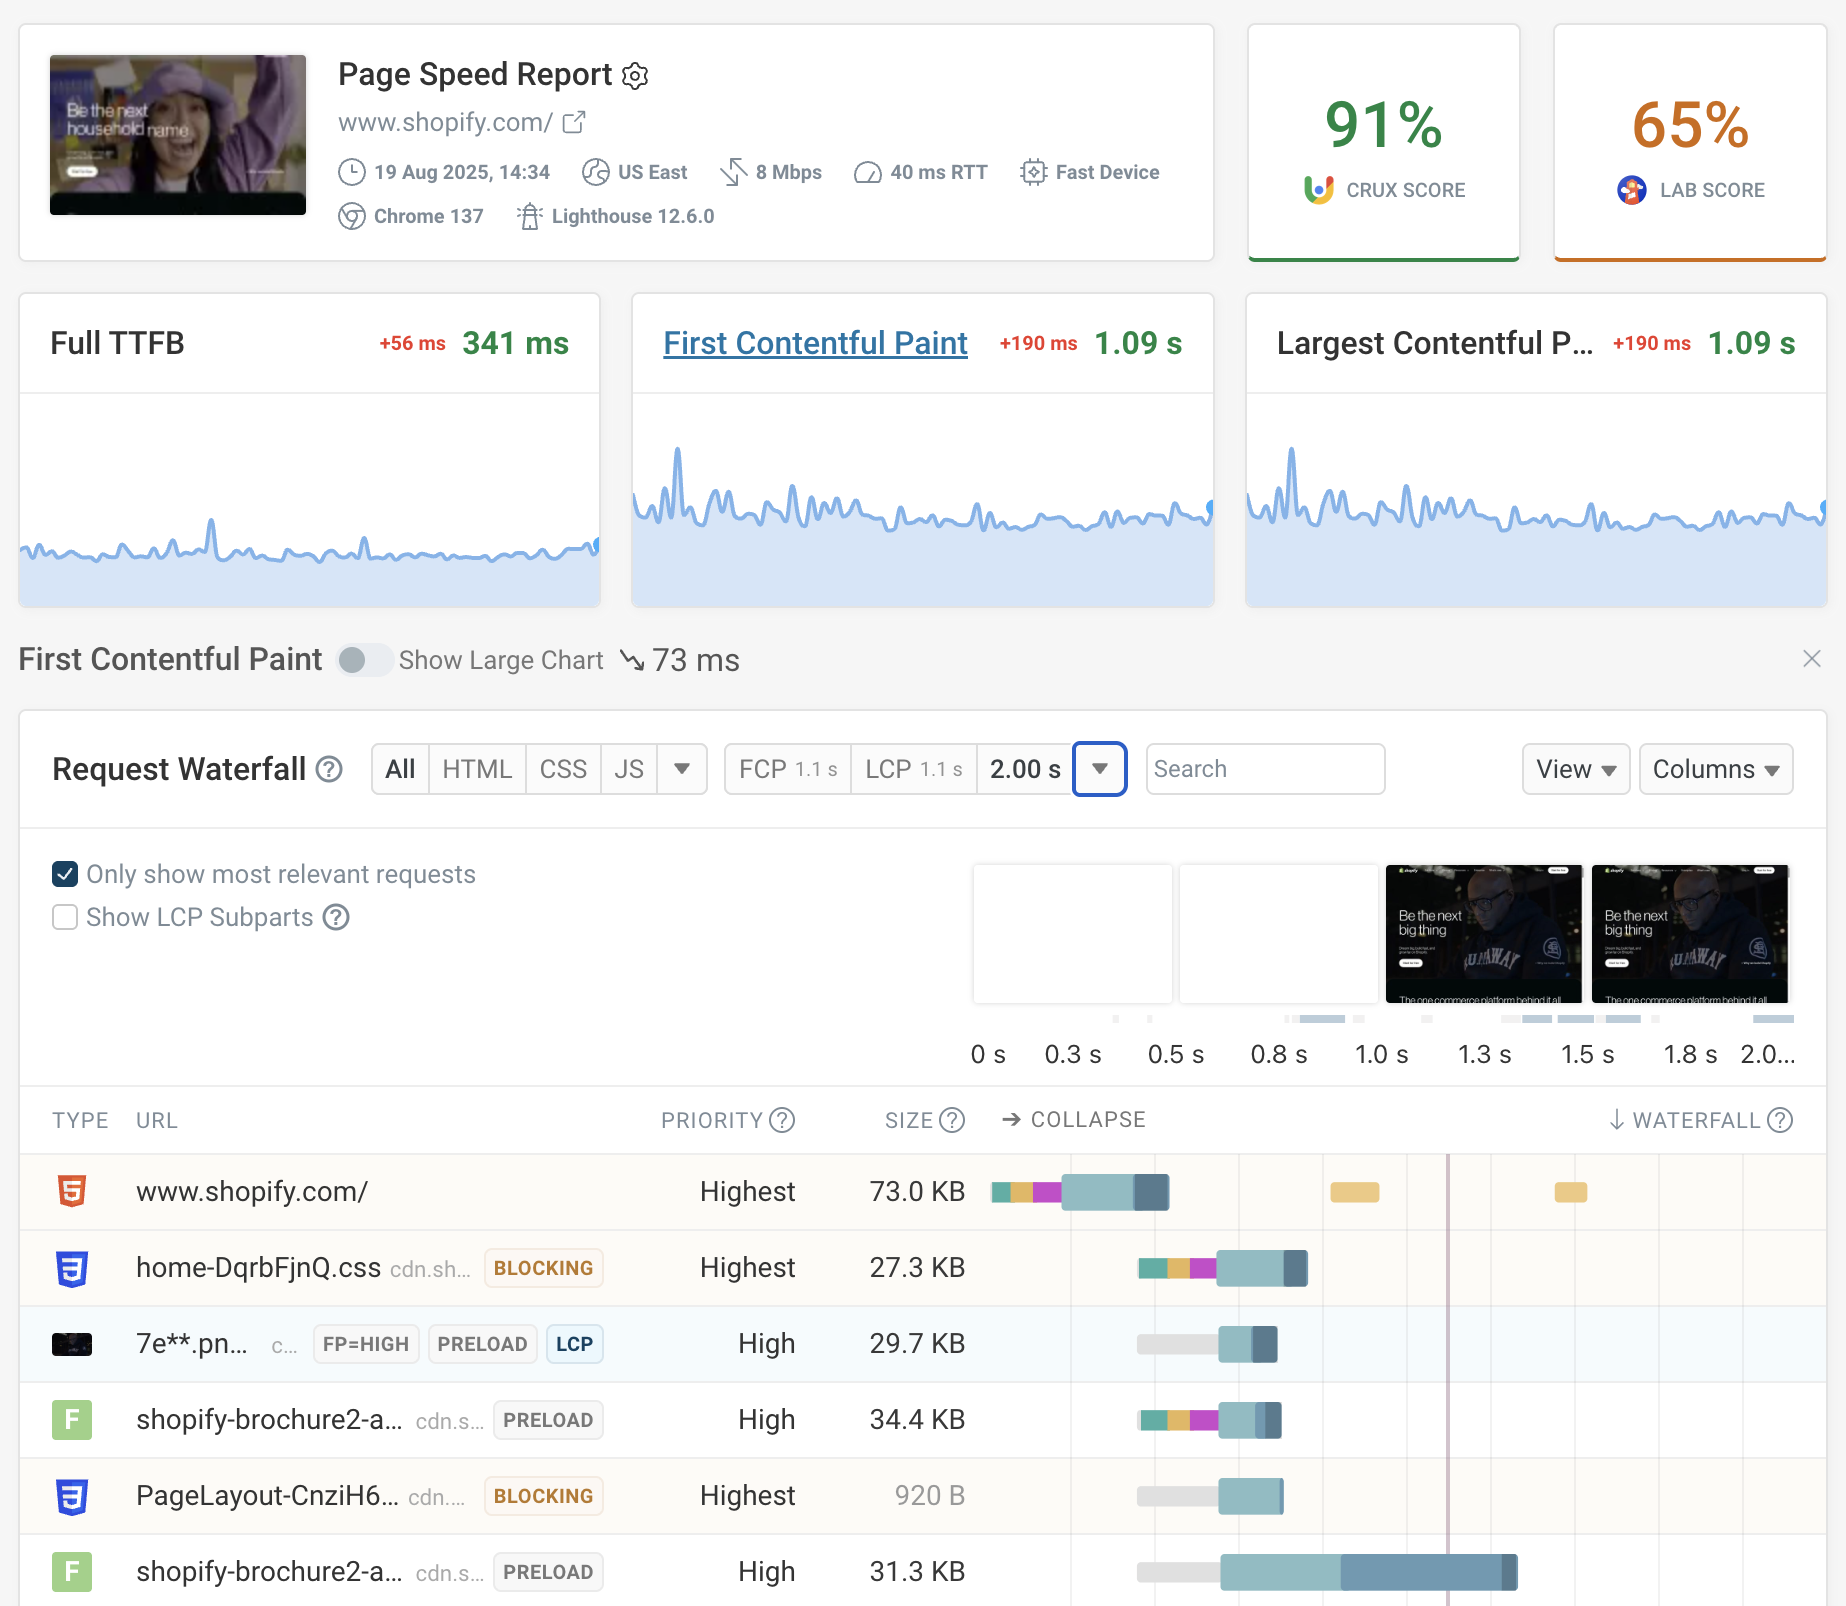
In contrast, lab test results can be a lot more detailed as the data is collected through internal browser developer tools rather than through JavaScript APIs.
For example, synthetic test reports often include:
- A video recording of the page rendering process
- Request details like request priorities, when different data chunks arrive, as well as HTTP headers and response bodies
- Detailed CPU task attribution
- Iframe processing tasks and requests
How much data is generated from monitoring?
Synthetic monitoring gives you a volume of data that you can plan for. This makes it easier to:
- Identify trends over time
- Perform detailed analysis of specific scenarios
- Generate consistent reports and alerts
Real User Monitoring can produce a large volume of data from your real users, this:
- Provides interesting statistical insights
- Helps you to categorize users based on performance
- Has additional data and storage requirements
DebugBear lets you define a sampling rate for your RUM data collection. This helps you control the amount of data you collect.
How to set up monitoring?
Synthetic monitoring typically requires:
- Setting up and maintaining test scripts
- Configuring test environments and schedules
- Occasional updates to the test scripts to reflect changes in your website
DebugBear's synthetic monitoring solution simplifies this process, helping you to easily set up and manage your tests.
Real User Monitoring involves:
- Adding monitoring scripts to your website
- Managing the data collection and storage of performance data
- Considering privacy and consent requirements
DebugBear's Real User Monitoring provides a straightforward implementation process while having a transparent approach to data privacy.
Using both Synthetic Monitoring and RUM
While synthetic monitoring and RUM each have their strengths, using both types of monitoring provides a better understanding of your website's performance.
Benefits of a Combined Approach
-
Powerful insights: Synthetic monitoring provides controlled data, while RUM offers real-world insights.
-
Proactive and reactive: Catch issues early with synthetic tests and understand their real-world impact through RUM data.
-
Validate and explore: Use synthetic tests to validate specific optimizations and RUM to investigate unexpected performance patterns.
DebugBear's combined monitoring solution offers the best of both worlds: synthetic monitoring and real user monitoring.
Choosing the Right Approach for Your Needs
When using synthetic monitoring and RUM, consider the following factors:
-
Resource availability: Consider the time and technical understanding needed for setting up each approach.
-
Website features: Complex websites may benefit more from RUM. Synthetic monitoring may be good enough for simple websites, at least initially.
-
Performance culture: Think about how each approach fits into the performance culture of your company.
-
Budget: Consider the costs of each approach, especially as your monitoring needs grow.
Typically, a combined approach using both synthetic monitoring and RUM is most effective.
Web Monitoring Has Been Set Up, Now What?
Once you've started monitoring data from:
- Synthetic tests
- Real user monitoring
- Both synthetic and real user monitoring
You need to analyze the data to identify and fix performance issues. Here are some steps you might take:
- Set up alerts: Configure alerts for performance regressions or issues that impact user experience.
- Analyze data: Look for patterns in your data to identify long-term performance issues.
- Fix issues: Use the data to prioritize and fix performance issues.
DebugBear helps with identifying, but also fixing performance issues. Where applicable, the Recommendations feature provides one-click experiments for common performance issues. This can help you quickly validate performance improvements without having to change your code.
Once you've verified that the recommendation improves performance, you can then implement the change in your codebase.

How does Synthetic Monitoring and RUM relate to Core Web Vitals?
Core Web Vitals are a set of metrics that Google uses to measure the user experience on the web. When you improve your Core Web Vitals, your users benefit from a faster, more responsive website. Core Web Vitals also play a role in Google's search ranking algorithm.
Using DebugBear, you can test your website's Core Web Vitals using both synthetic monitoring and RUM.
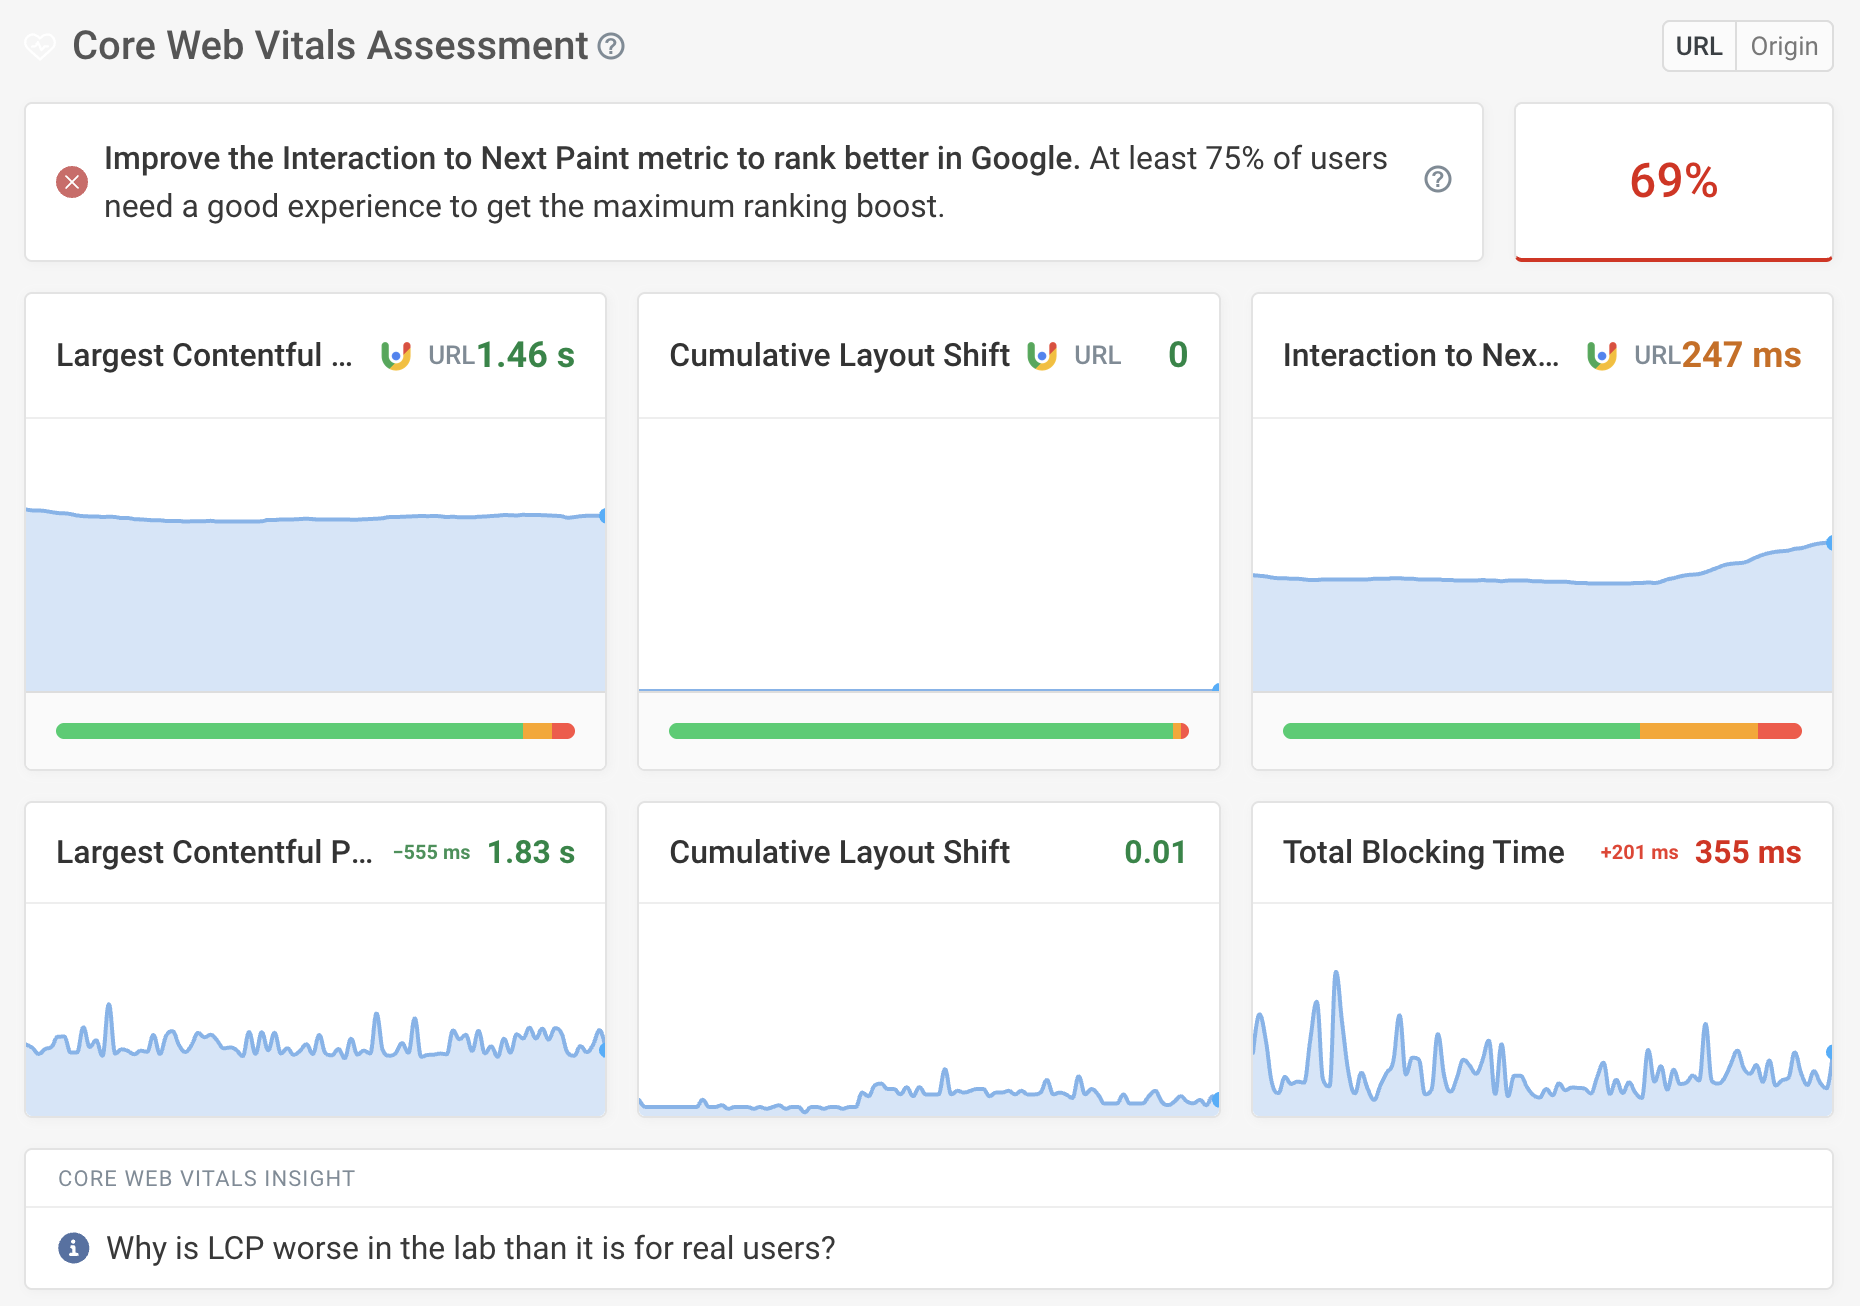
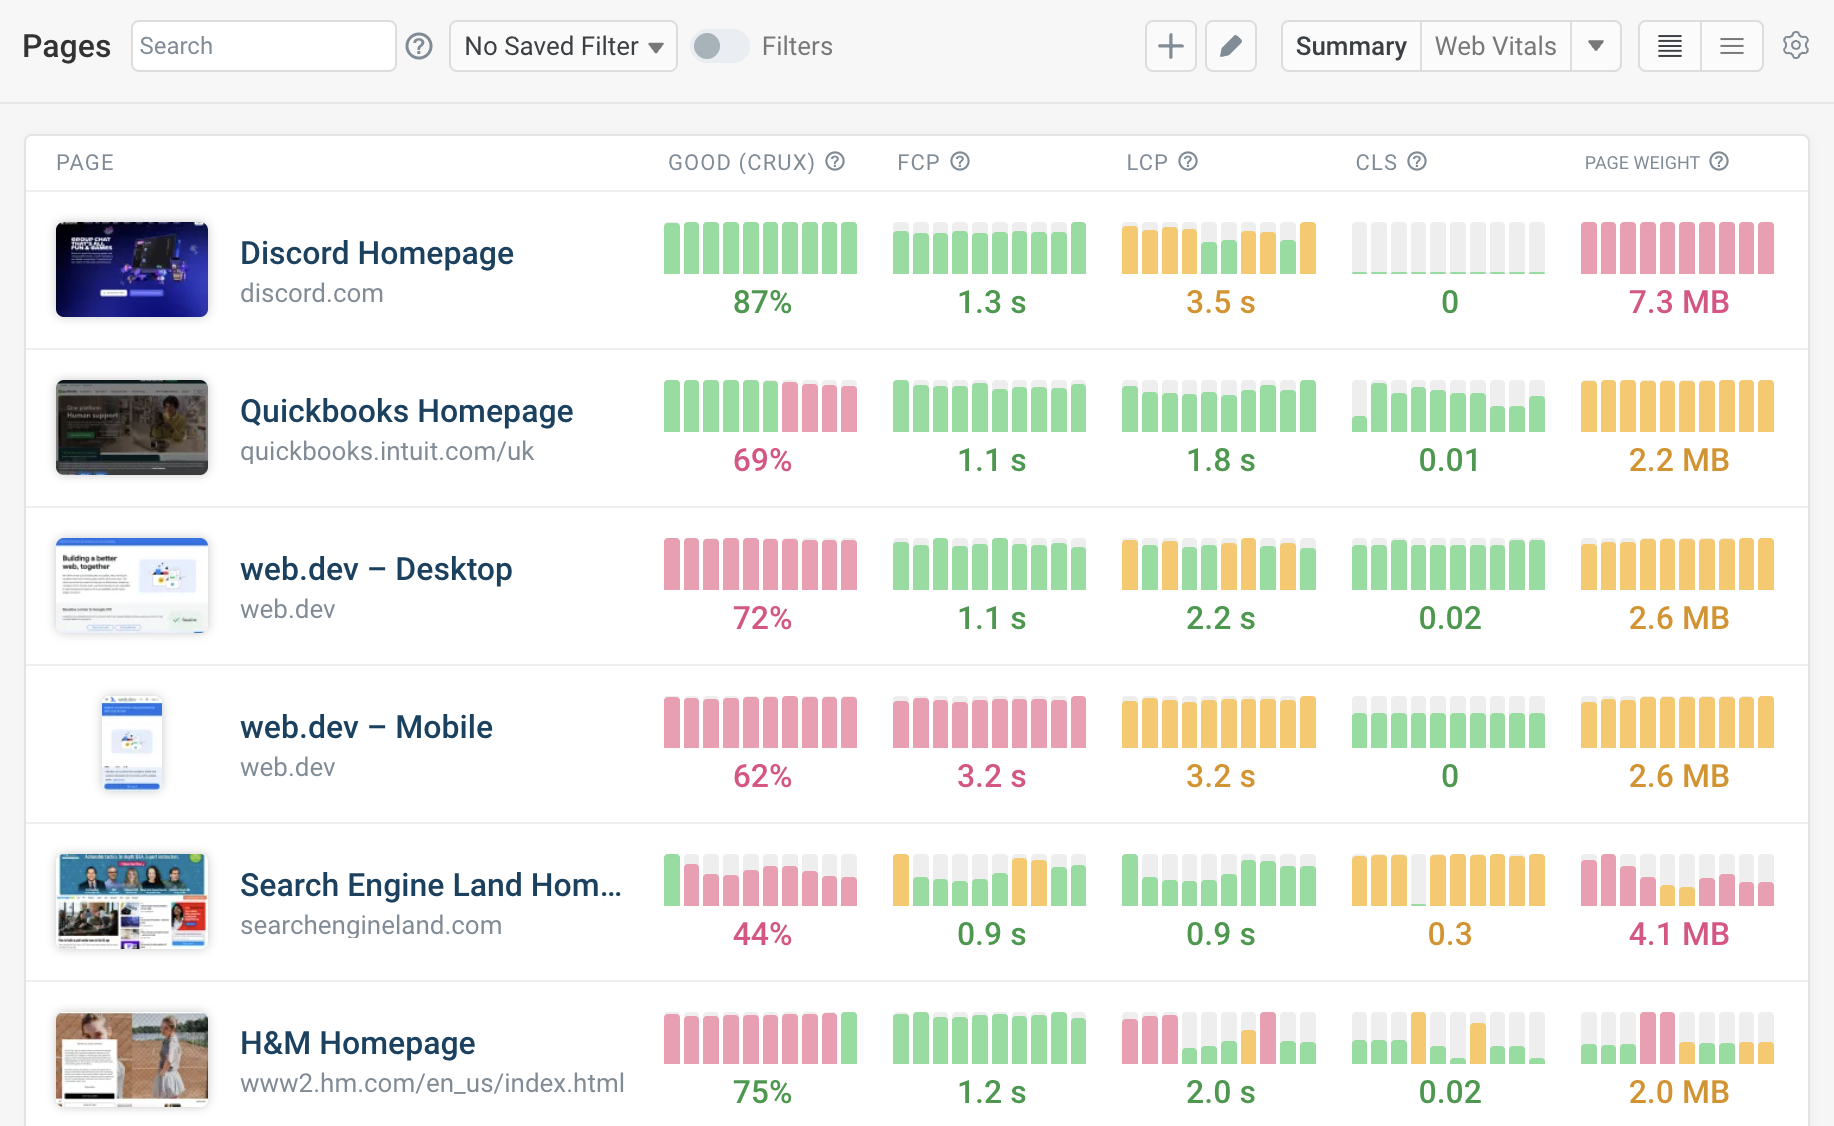
The following example shows the Core Web Vitals results from a single synthetic test run on a website. In addition to the synthetic web vitals data, the report also includes metrics from Google's Chrome User Experience Report (CrUX).
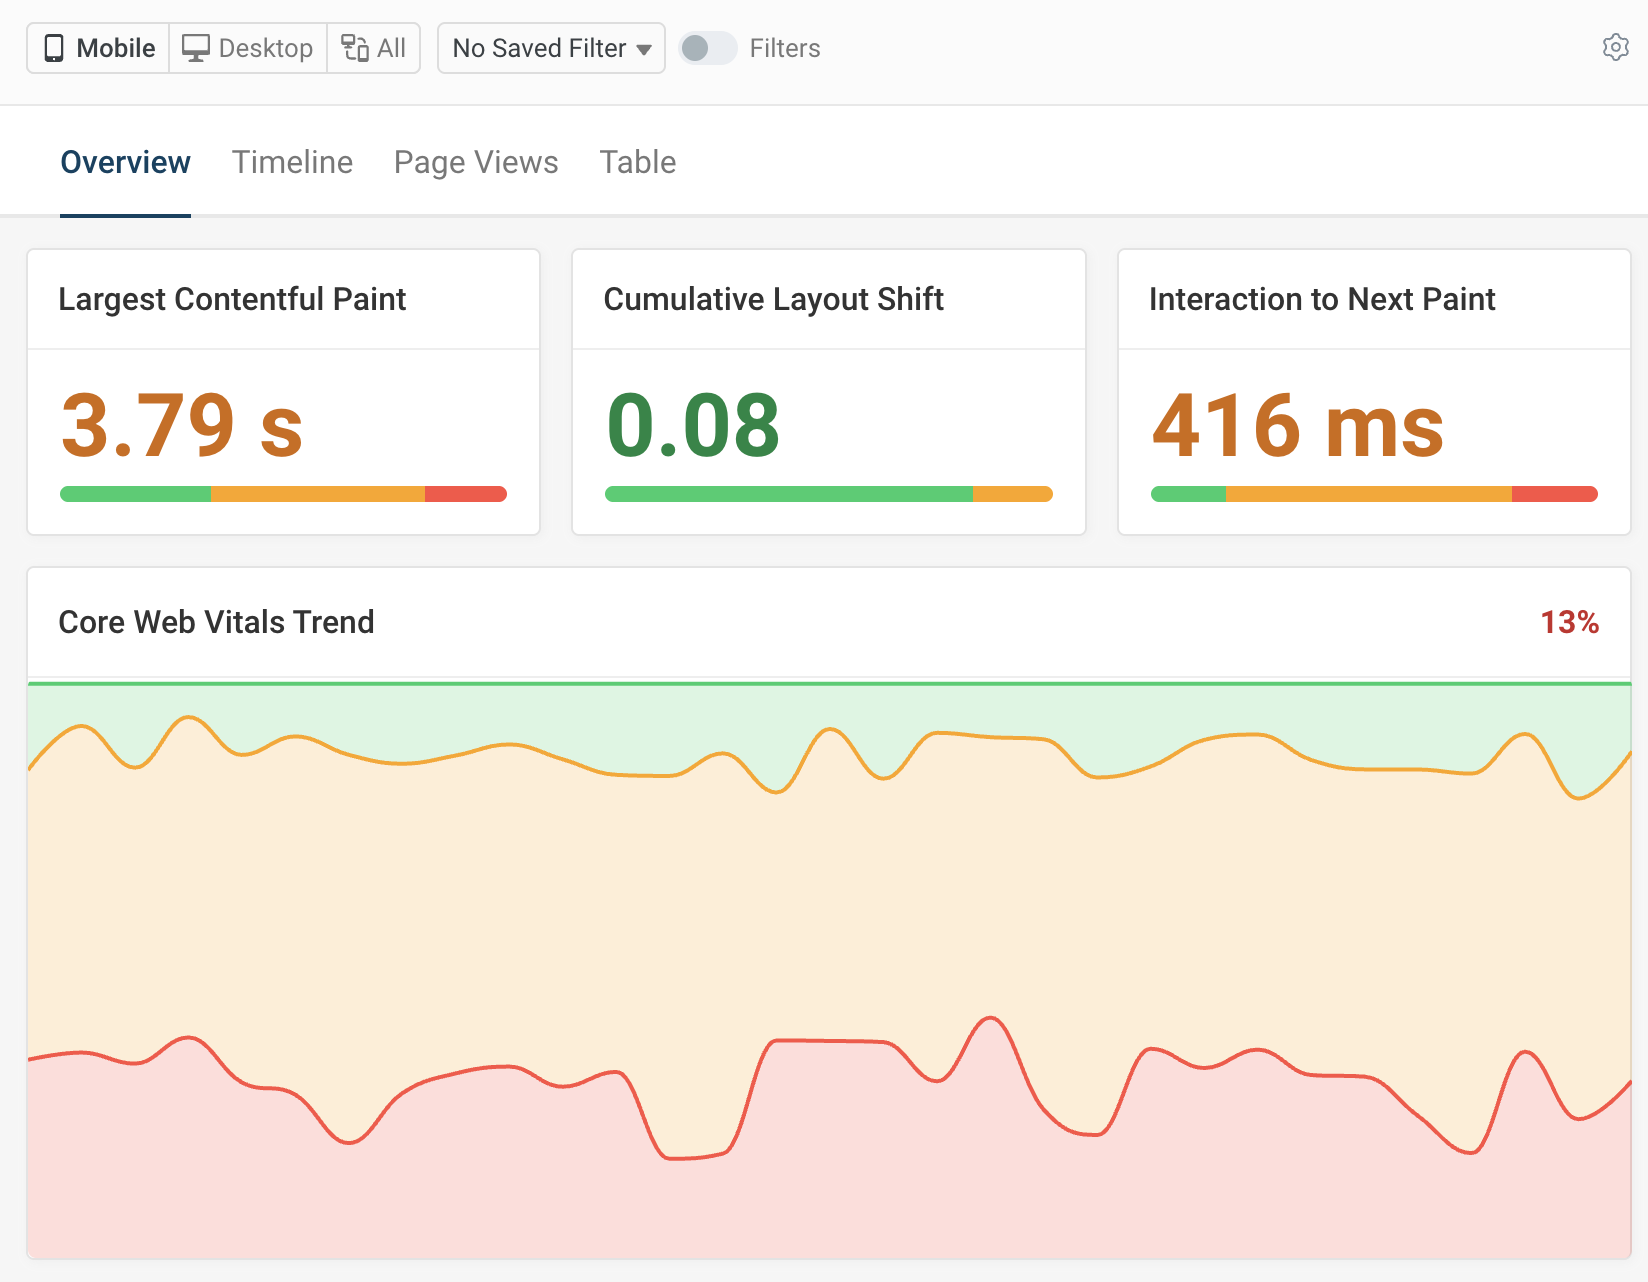
The RUM screenshot below shows aggregated Core Web Vitals data from real users.
You can dive into data for each of the pages on your website (as long as they get traffic from visitors).
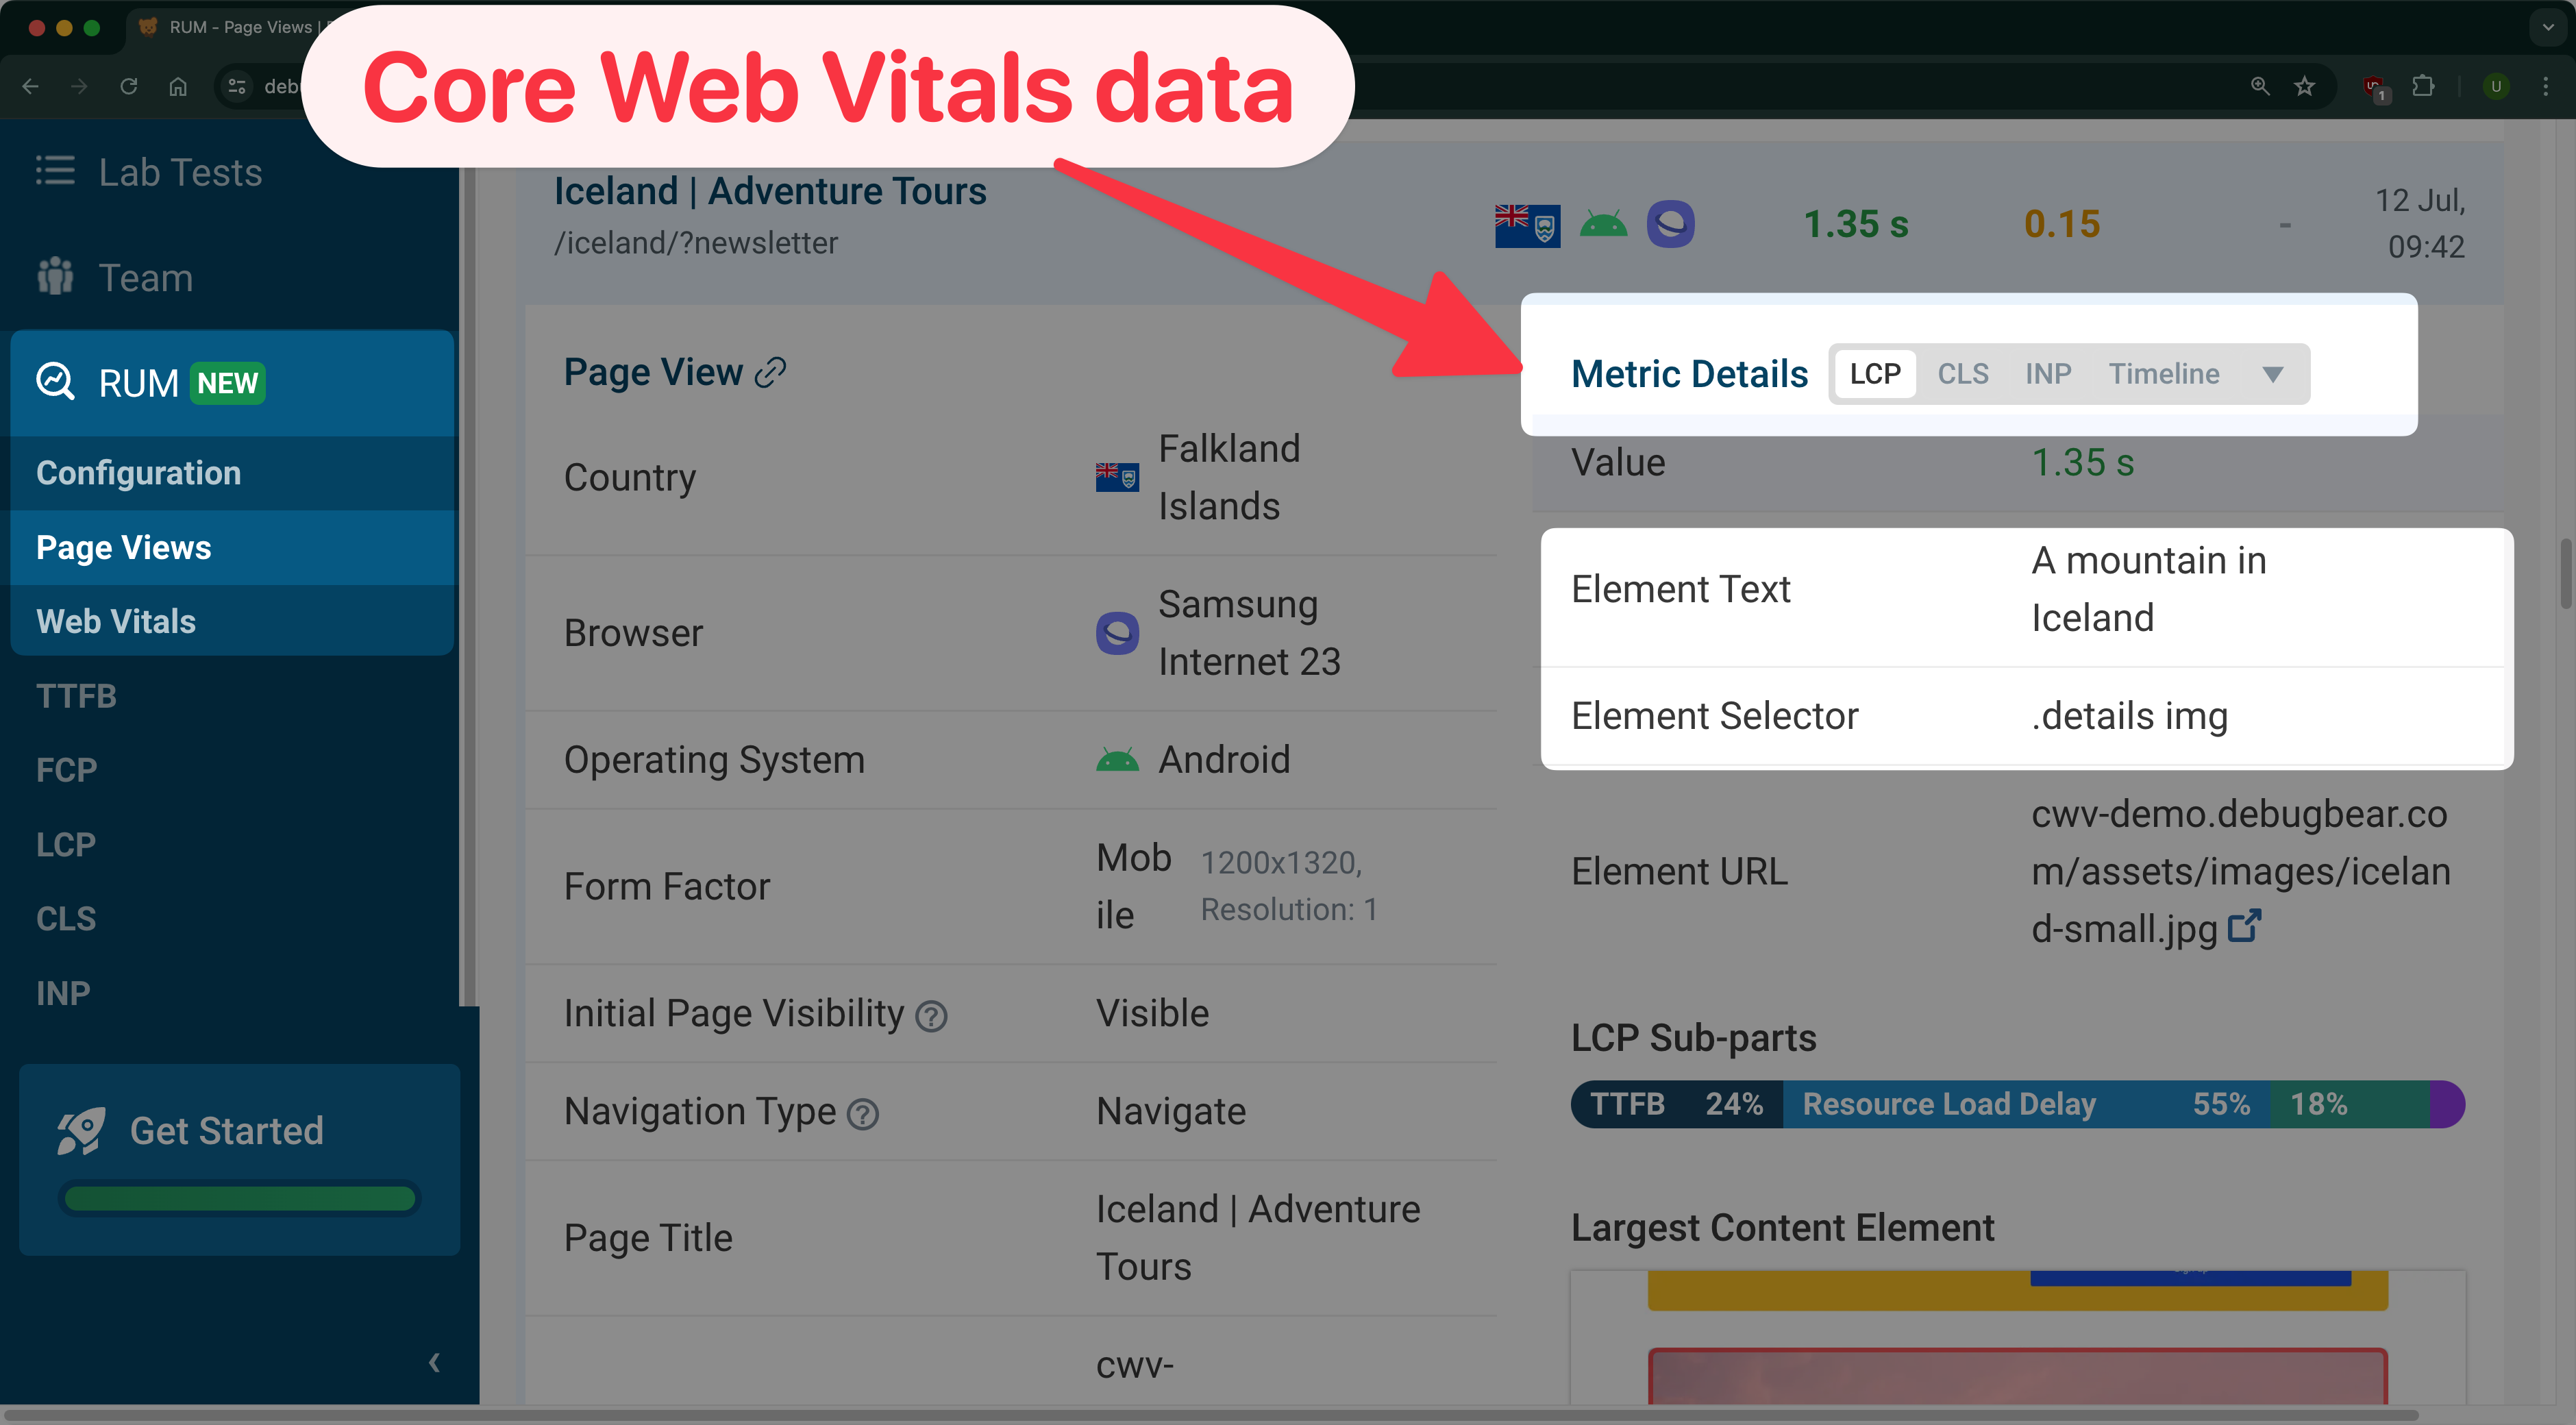
While aggregated RUM data can be useful, DebugBear also provides the ability to drill down into individual user sessions to understand how real users experience your website. The following example shows an individual page view in RUM which includes full Core Web Vitals data for a real page view from a user:
What RUM and synthetic tools are available?
If you're looking to find a monitoring tool that works for your organization, we've compiled lists of the best real user monitoring tools and best synthetic monitoring tools on the market.
Conclusion
Both synthetic monitoring and real user monitoring offer powerful insights into website performance.
DebugBear offers solutions for both synthetic monitoring and real user monitoring, so you get the best of both. Start monitoring your website performance today!


Monitor Page Speed & Core Web Vitals
DebugBear monitoring includes:
- In-depth Page Speed Reports
- Automated Recommendations
- Real User Analytics Data
