
Web performance monitoring is key for maintaining a fast, reliable website. Synthetic monitoring tools help you track your website's performance by simulating user interactions and measuring key metrics.
This guide compares a number of synthetic monitoring solutions. We evaluate their key features, pricing, and limitations to help you choose the right tool for your needs.
What are synthetic monitoring tools?
Synthetic monitoring tools continuously check your website performance to tell you how fast it is, alert you to regressions, and produce reports that you can use to optimize your page speed.
They are also referred to as lab-based tests, because they are run in a lab environment under controlled testing conditions. That stands in contrast to real user monitoring tools, which collect data on actual visitors.
Synthetic tools provide more in-depth reporting and can run tests on demand. Real user monitoring describes the actual visitor experience, but offers more limited reporting and only works for production websites that get regular traffic.
Why do you need a synthetic monitoring tool?
Synthetic website monitoring tools help you keep track of your website performance over time and deliver a great visitor experience and pass Google's Core Web Vitals assessment. They allow you to continuously test your website speed in order to identify potential optimizations and get alerted when there's a page speed issue.
While a comprehensive optimization strategy requires multiple types of monitoring, synthetic monitoring in particular has the following key strengths:
- Synthetic data is the most detailed type of data available, and comes with tailored performance recommendations
- Data is collected in a controlled lab environment, and is not liable to fluctuations due to changing visitor patterns
- Any website can support synthetic monitoring, even if the website doesn't have enough traffic (such as a staging website)
1. DebugBear
DebugBear is a web performance monitoring service that tracks Core Web Vitals, site speed metrics, and user experience data to help optimize website performance and SEO rankings.
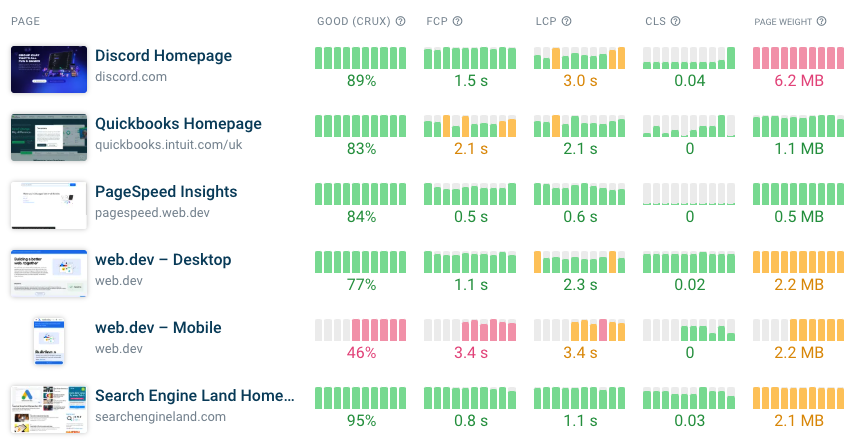
Here's an overview dashboard from DebugBear, showing page speed for different monitored pages at a glance.
Key Features
- Lab-based automated testing with Lighthouse scores
- Visual regression tracking with filmstrip and waterfall views
- Chrome User Experience Report (CrUX) data integration
- Automatic alerts for performance regressions
- Network request chain analysis for debugging
- Also offers real user monitoring across entire websites
Pros
- Detailed performance metrics for Core Web Vitals, and more
- A wizard to guide you through locating, and fixing performance issues
- Offers free one-off lab tests
- One-click performance experiments let you test out performance fixes to measure the impact
The custom recommendations are based on an analysis of your website. In some cases you can even run an automated experiment to test the change without deploying code to production.

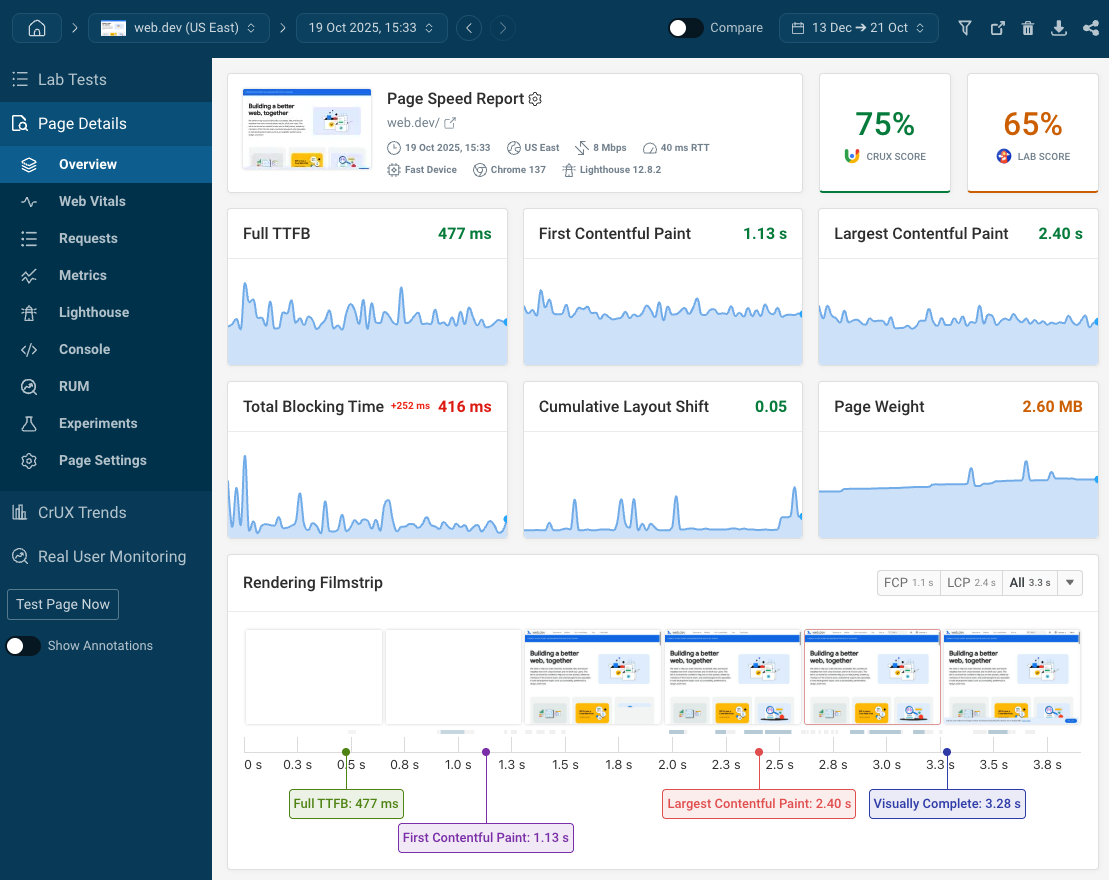
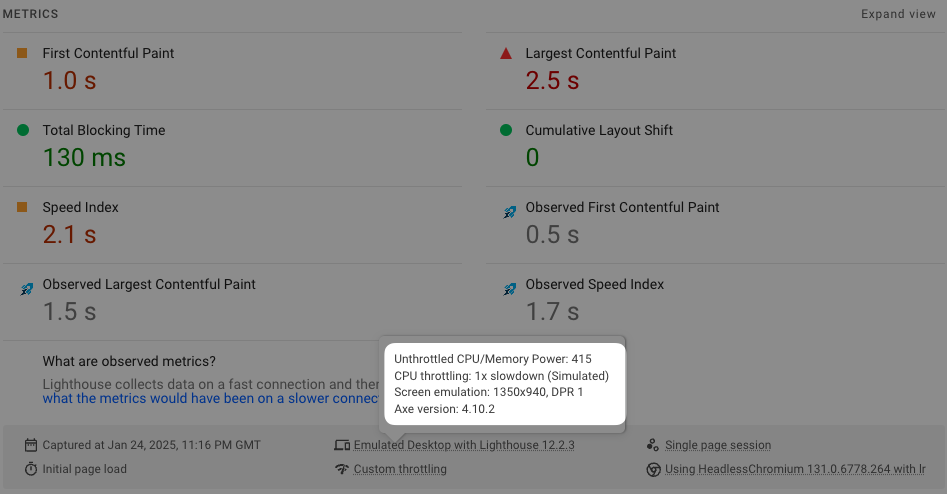
Each tracked URL comes with a more detailed dashboard showing you not just the metrics but also details on how a visitor would experience the website, network requests, and CPU tasks.
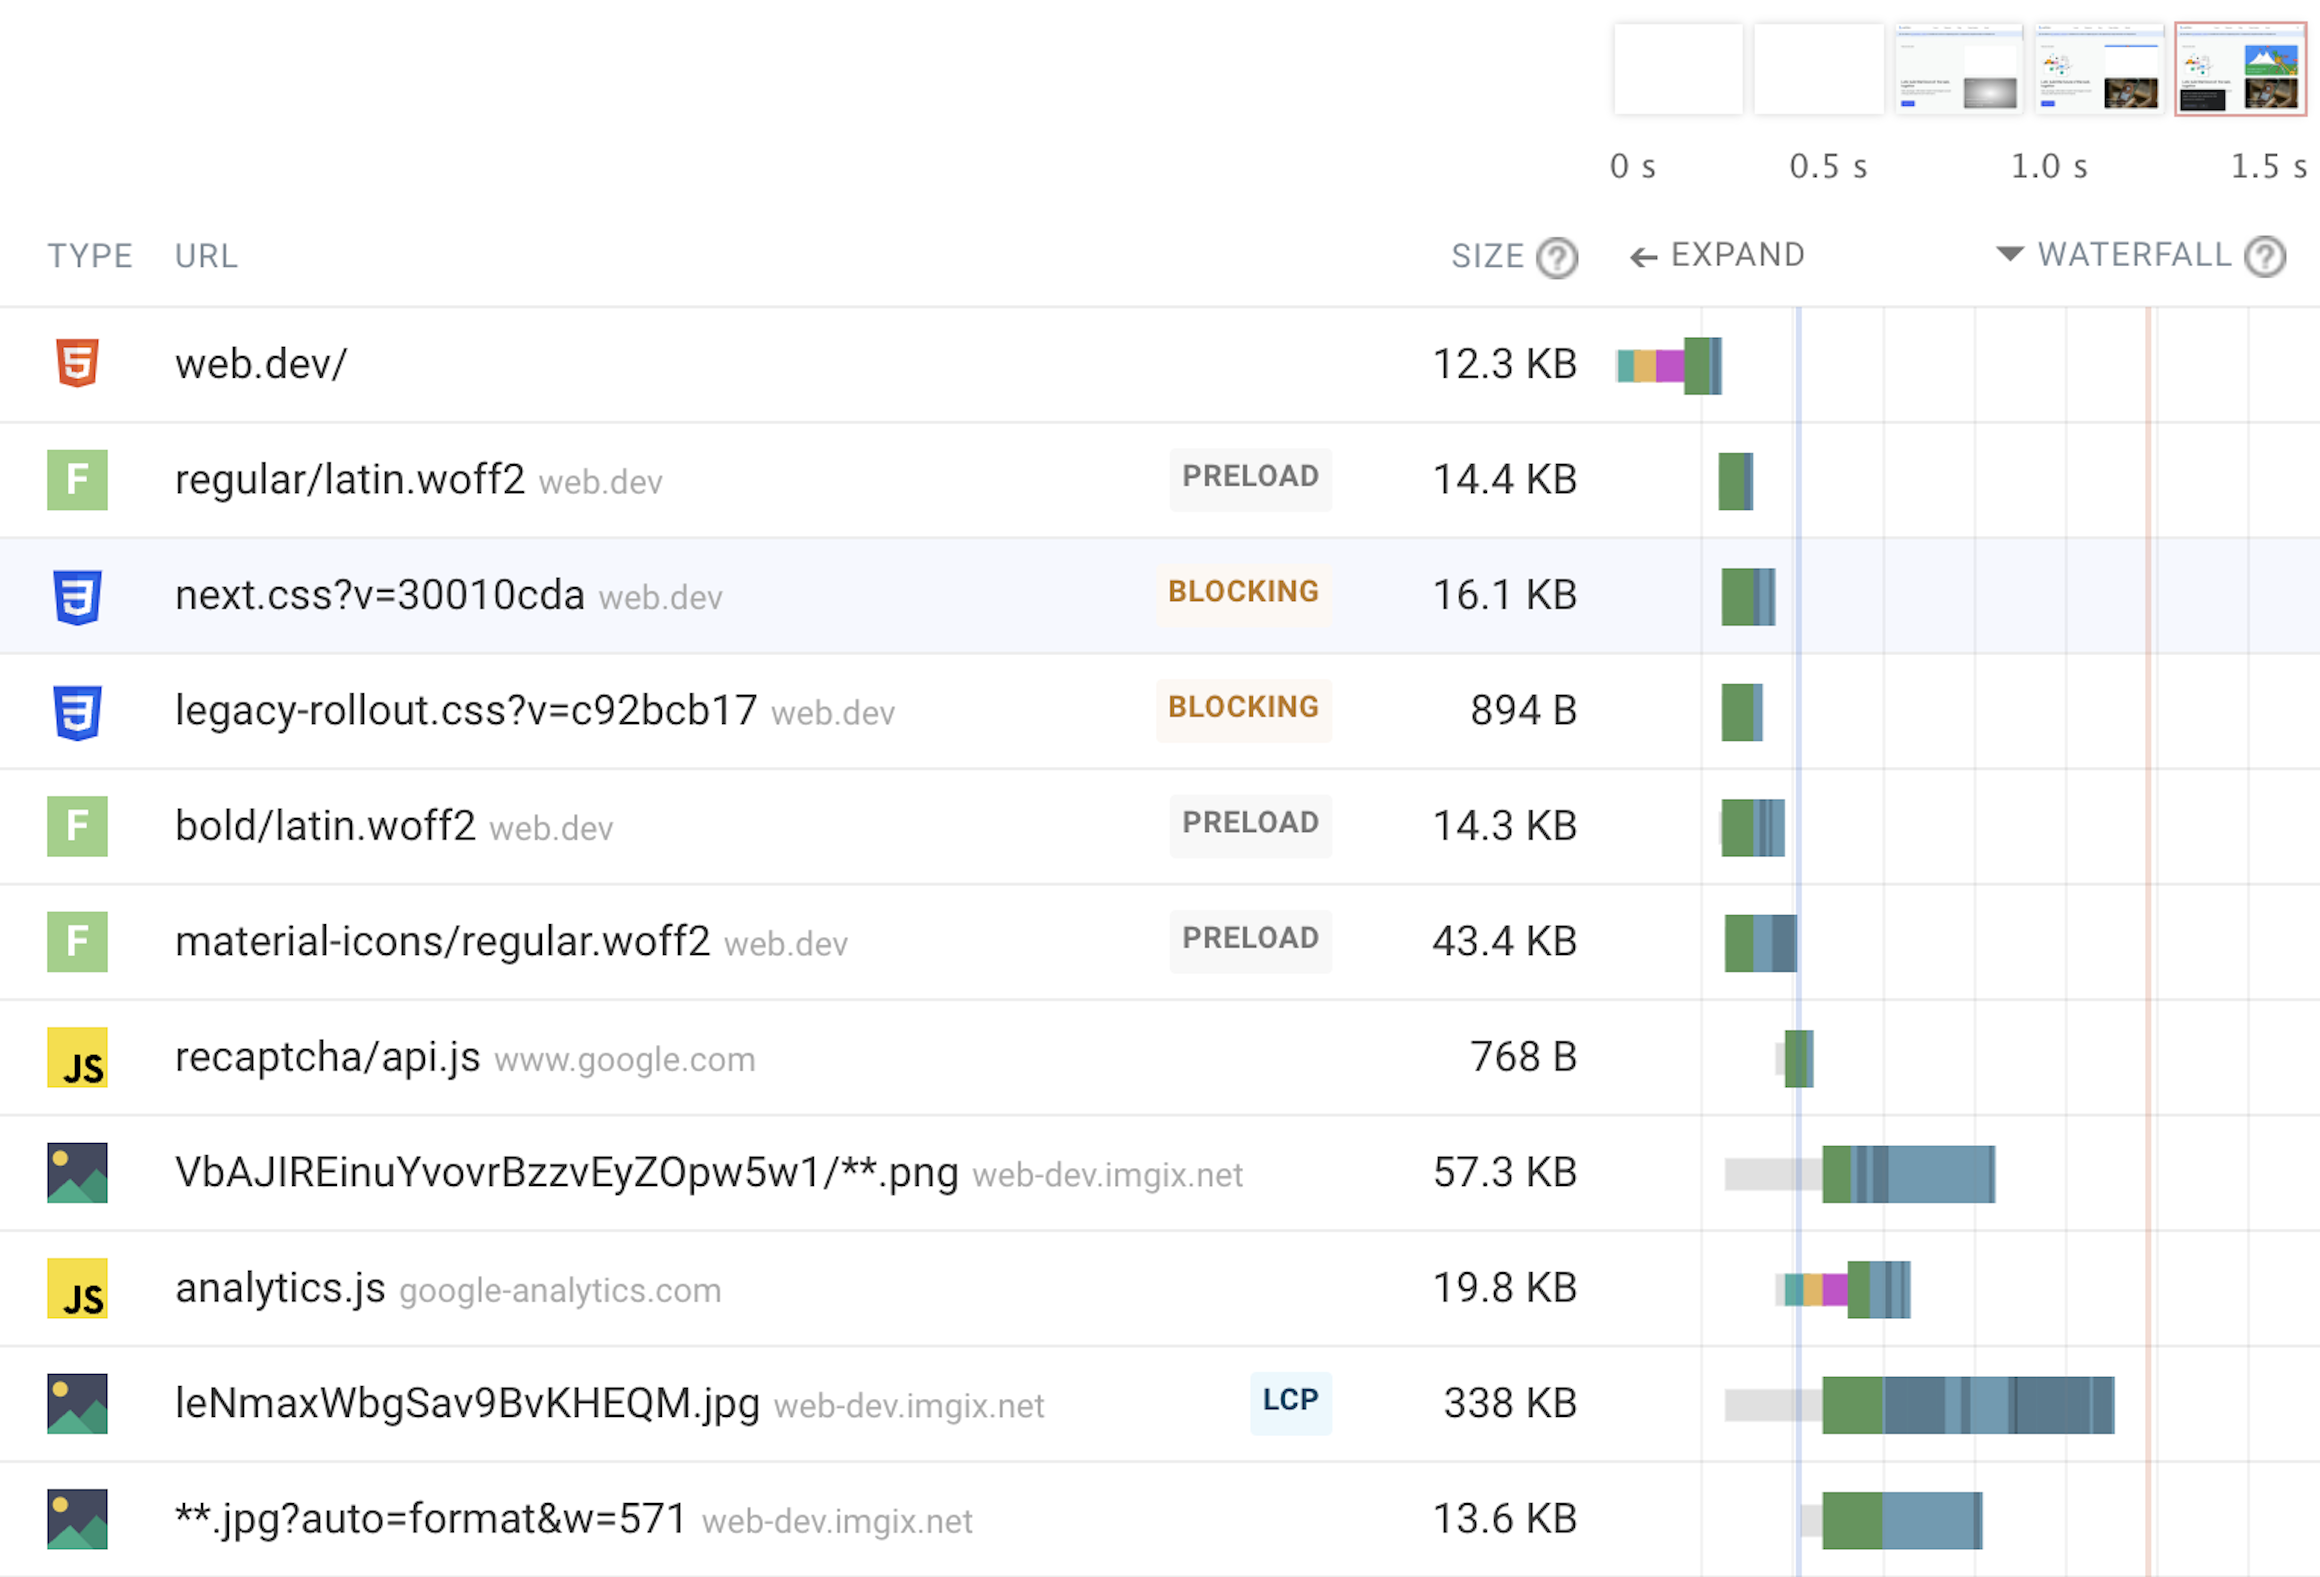
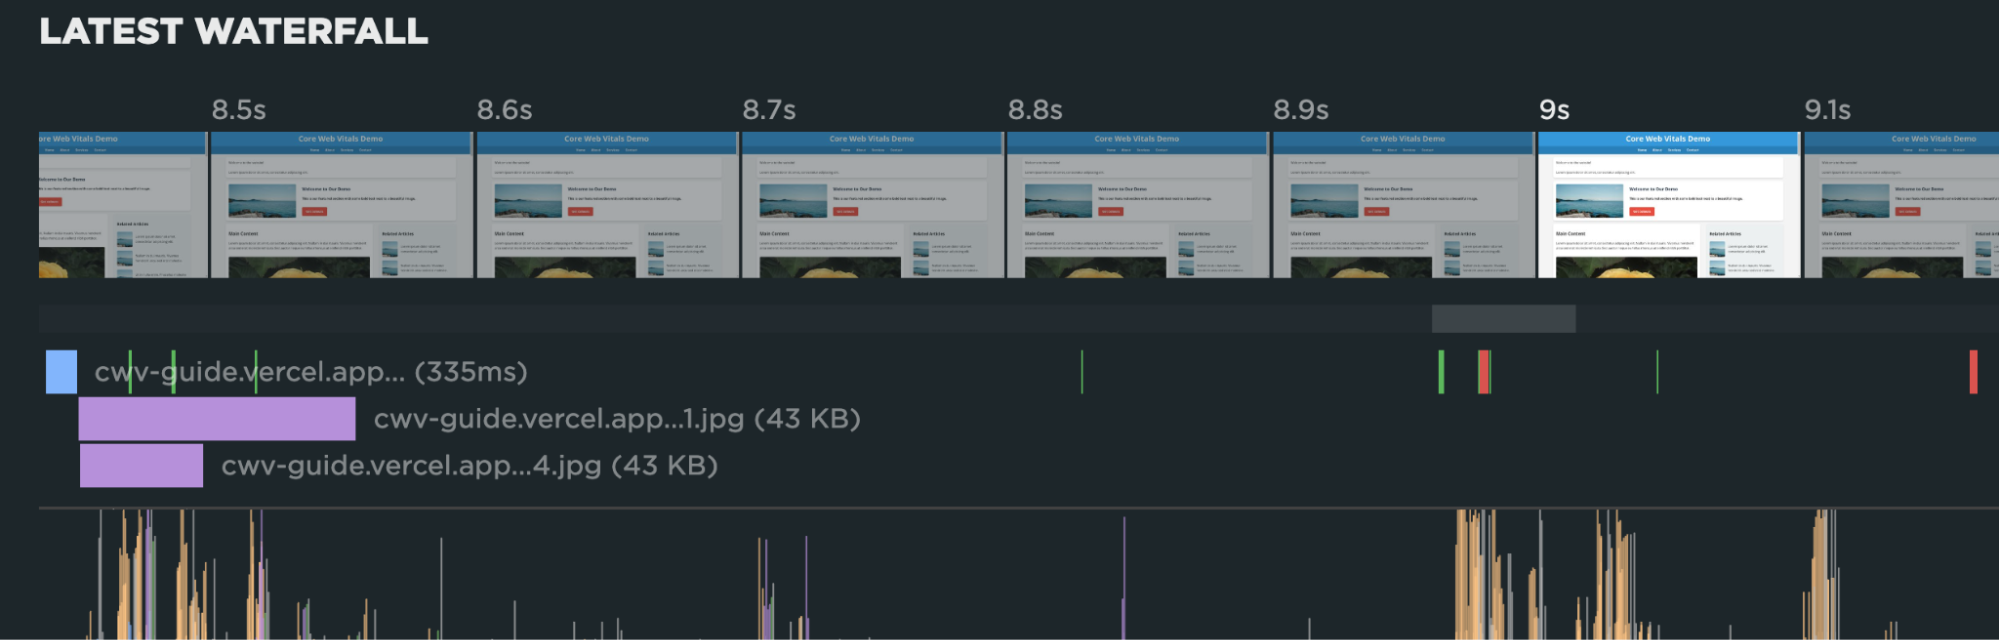
DebugBear features a detailed waterfall view of network requests. This information is vital to debug website performance issues, as you can visually correlate what resources are loading with the content that's showing up in the rendering filmstrip.
Cons
- Can be expensive for small hobby projects
- Only focused on frontend performance
Pricing
Start with a 14-day free trial (no credit card needed) then purchase a subscription starting at $49/mo.
2. SpeedCurve
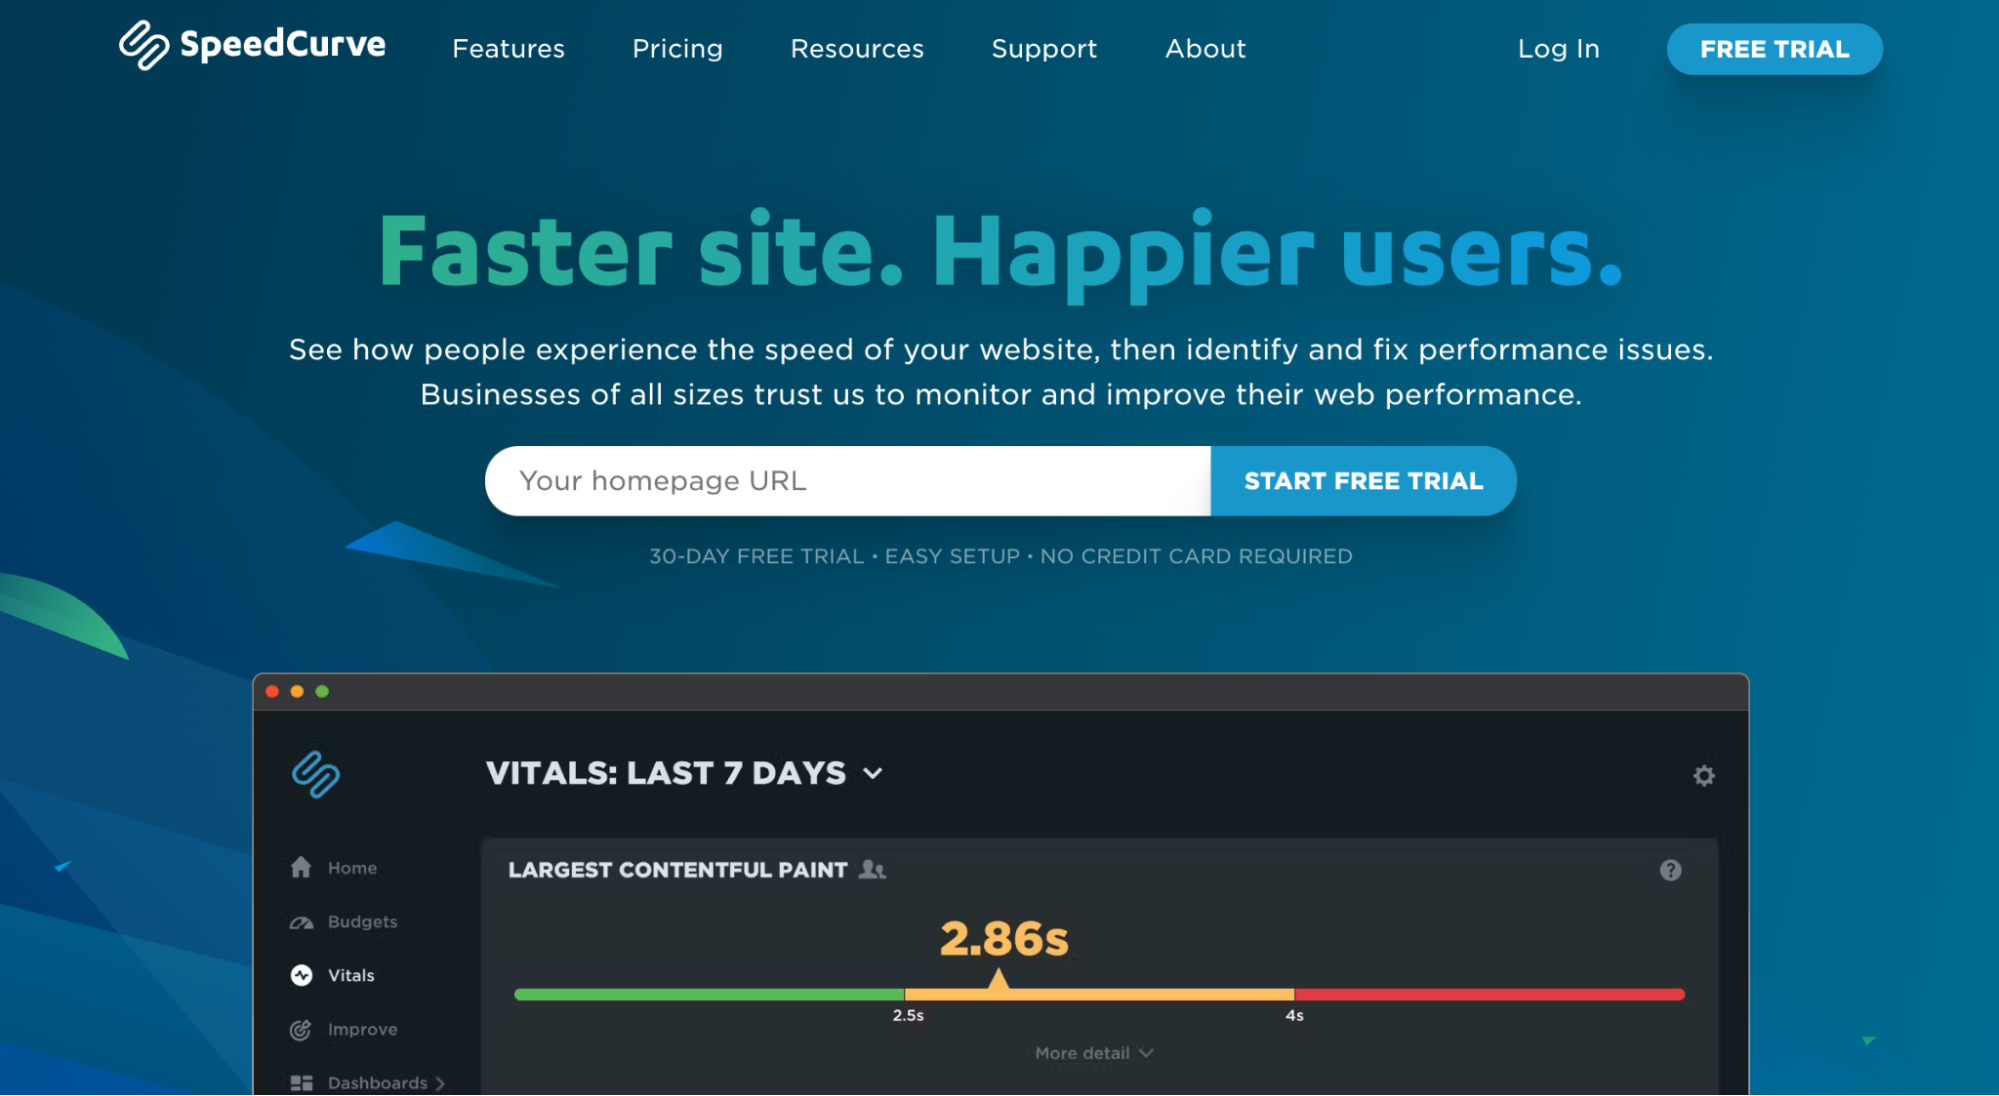
SpeedCurve monitors website performance through synthetic testing and real user monitoring (RUM), helping identify and fix speed issues that affect user experience.
Key Features
- Tracks 100+ performance metrics including Core Web Vitals, Lighthouse scores, and custom metrics
- Provides competitor benchmarking capabilities
- Integrates with CI/CD workflows through API and performance budgets
- Offers real-time alerts for performance threshold violations
Pros
Track website changes through clear visualizations and performance comparisons in an intuitive dashboard. Each deployment includes automated Lighthouse scoring and reporting.
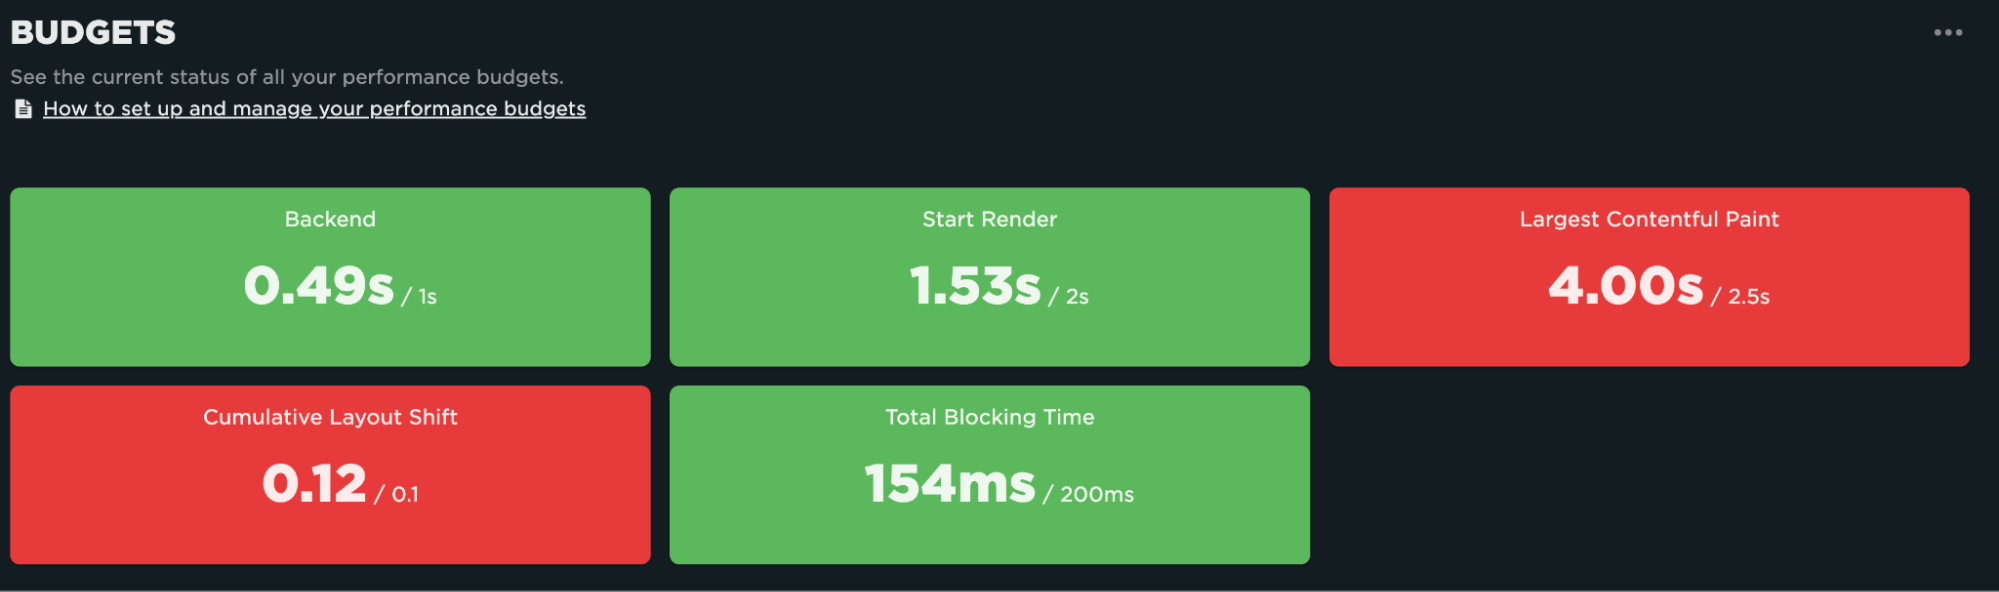
Synthetic test budgets help alert you during performance regressions.
Synthetic lab tests also capture a network request waterfall that includes CPU activity, so you can understand periods of heavy browser processing activity.
Cons
Oversimplified interface and restricted functionality affect usability. Performance metrics lack granularity, preventing effective troubleshooting of performance issues.
Pricing
Sign up for a free trial, then pay $12 USD monthly for up to 1000 synthetic checks per month on the basic plan.
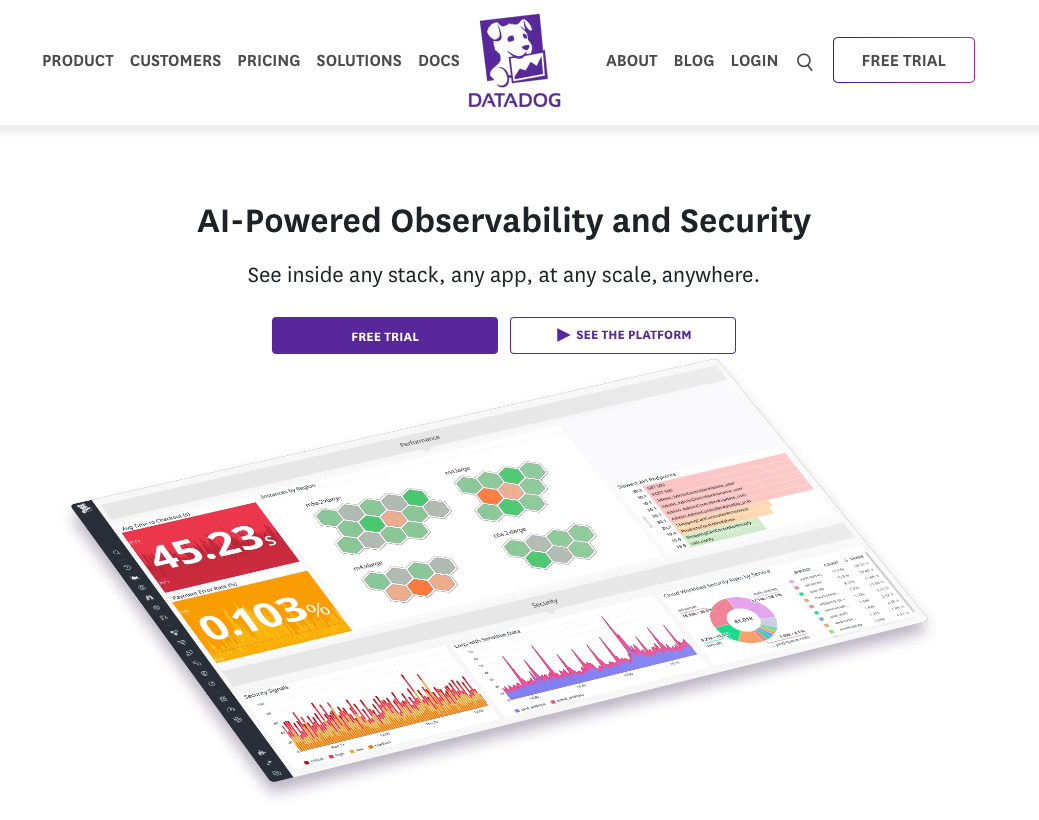
3. Datadog
Datadog is a comprehensive website observability platform that includes synthetic monitoring in its service. You can also use it to collect data on real experience.
Key Features
- Monitors core web vitals and load times across web applications
- Tracks user sessions with replay capability and error tracking
- Collects custom metrics and user behavioral data
- Correlates frontend issues with backend traces and logs
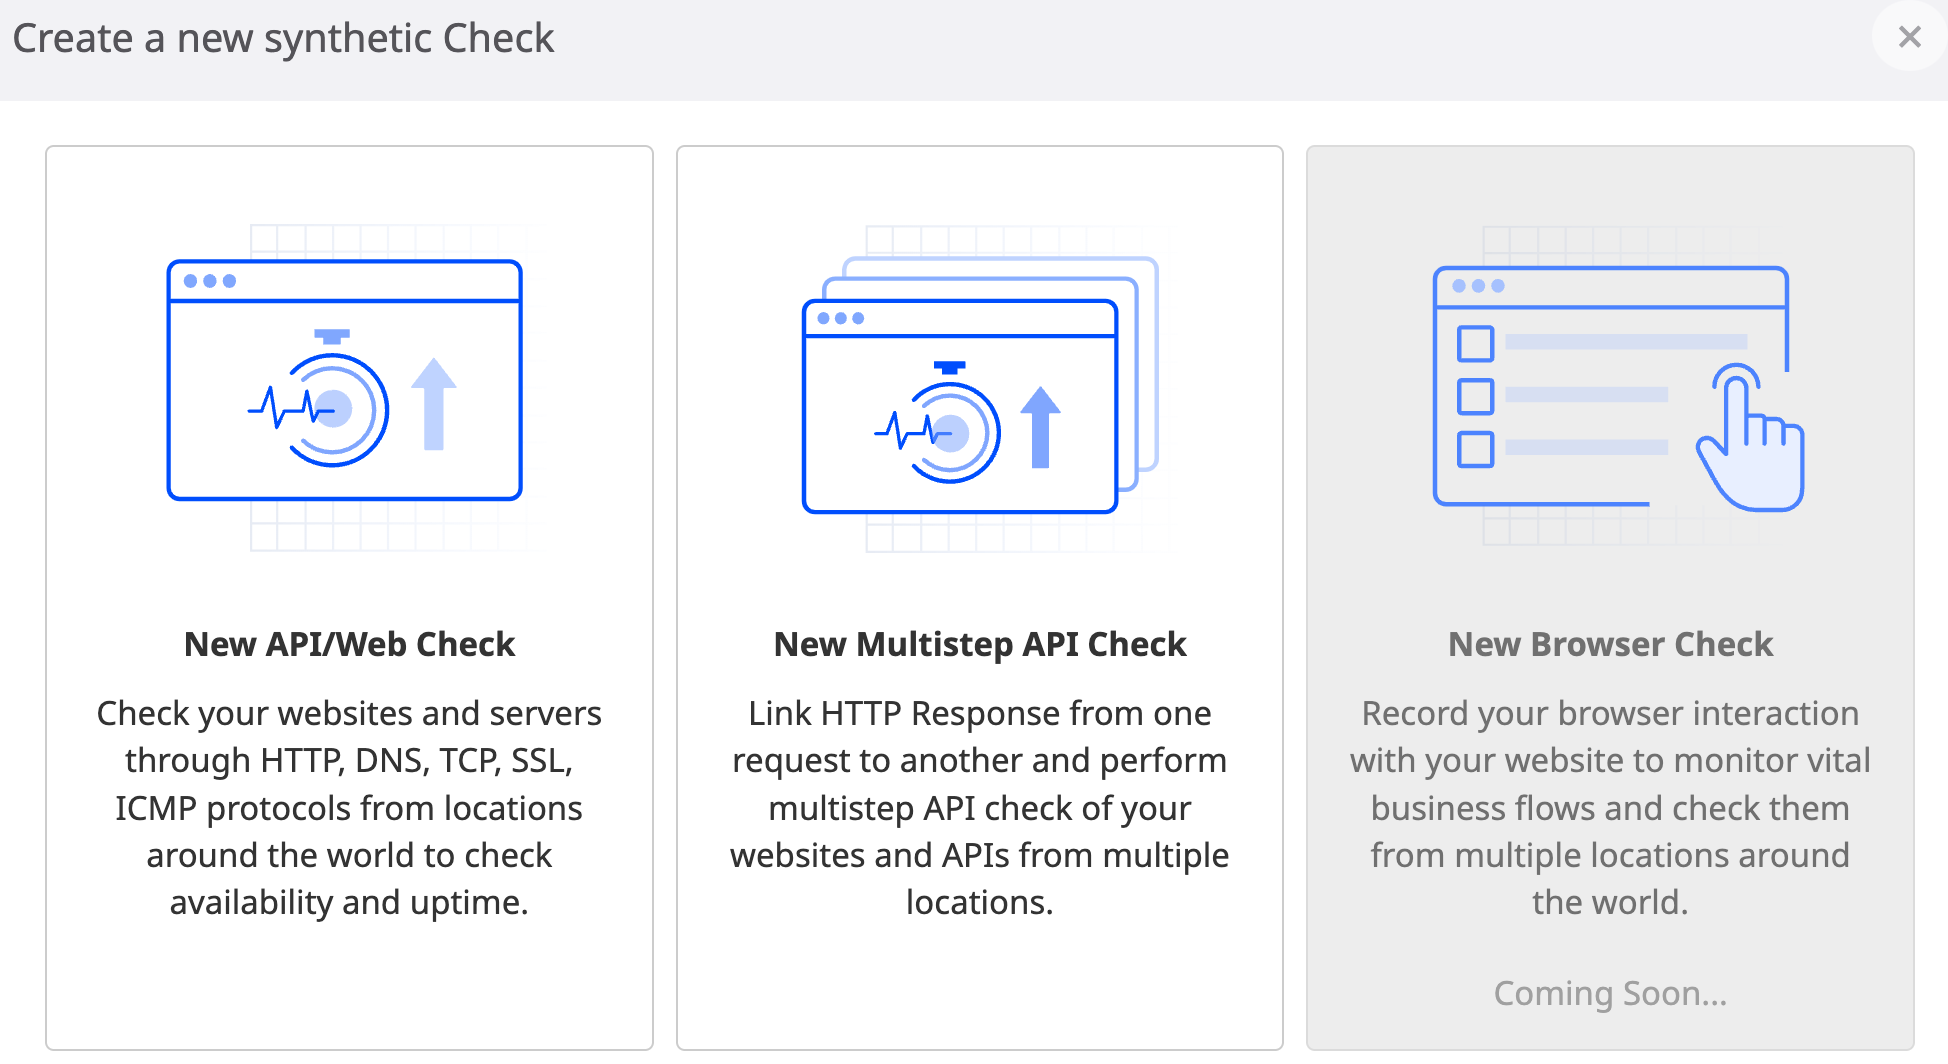
- Provides synthetic browser testing to simulate user journeys
Pros
Monitor site performance and interaction tests, while also capturing real user web browsing sessions. This captured data reveals how visitors navigate your site and helps identify issues.
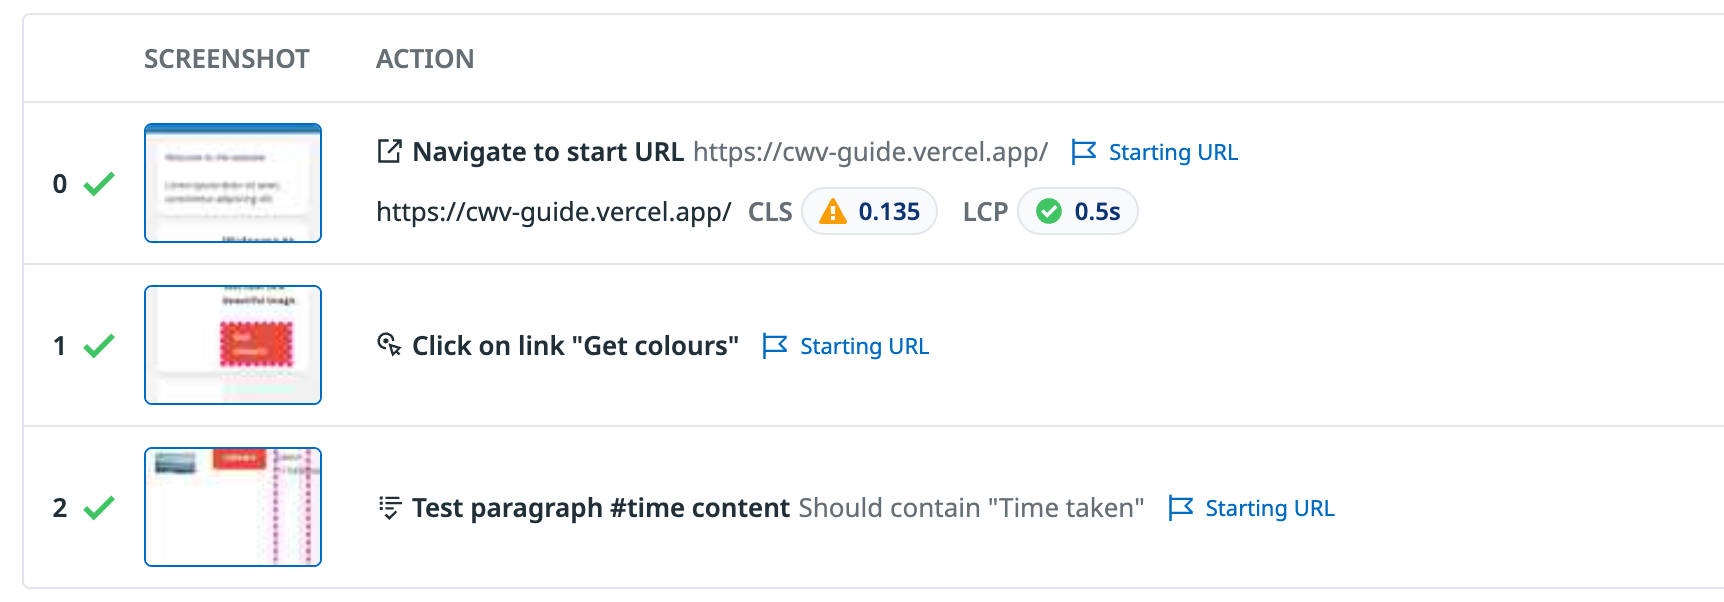
Here's an example of a synthetic browser test that includes a scripted user flow:
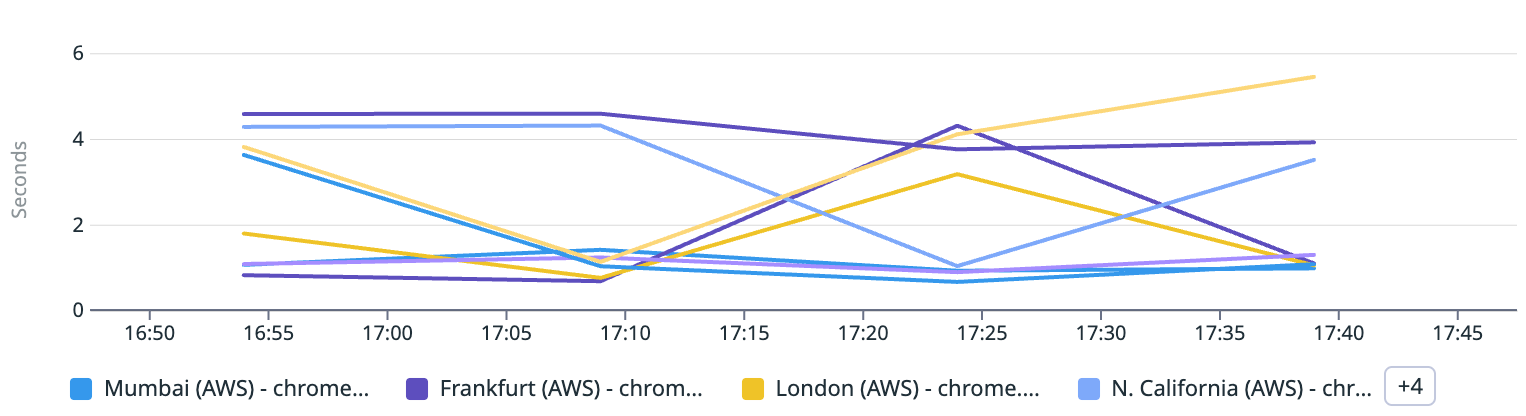
You can use the synthetic tests to monitor performance, uptime, and correctness. Here's a chart showing uptime in different regions over time:
Cons
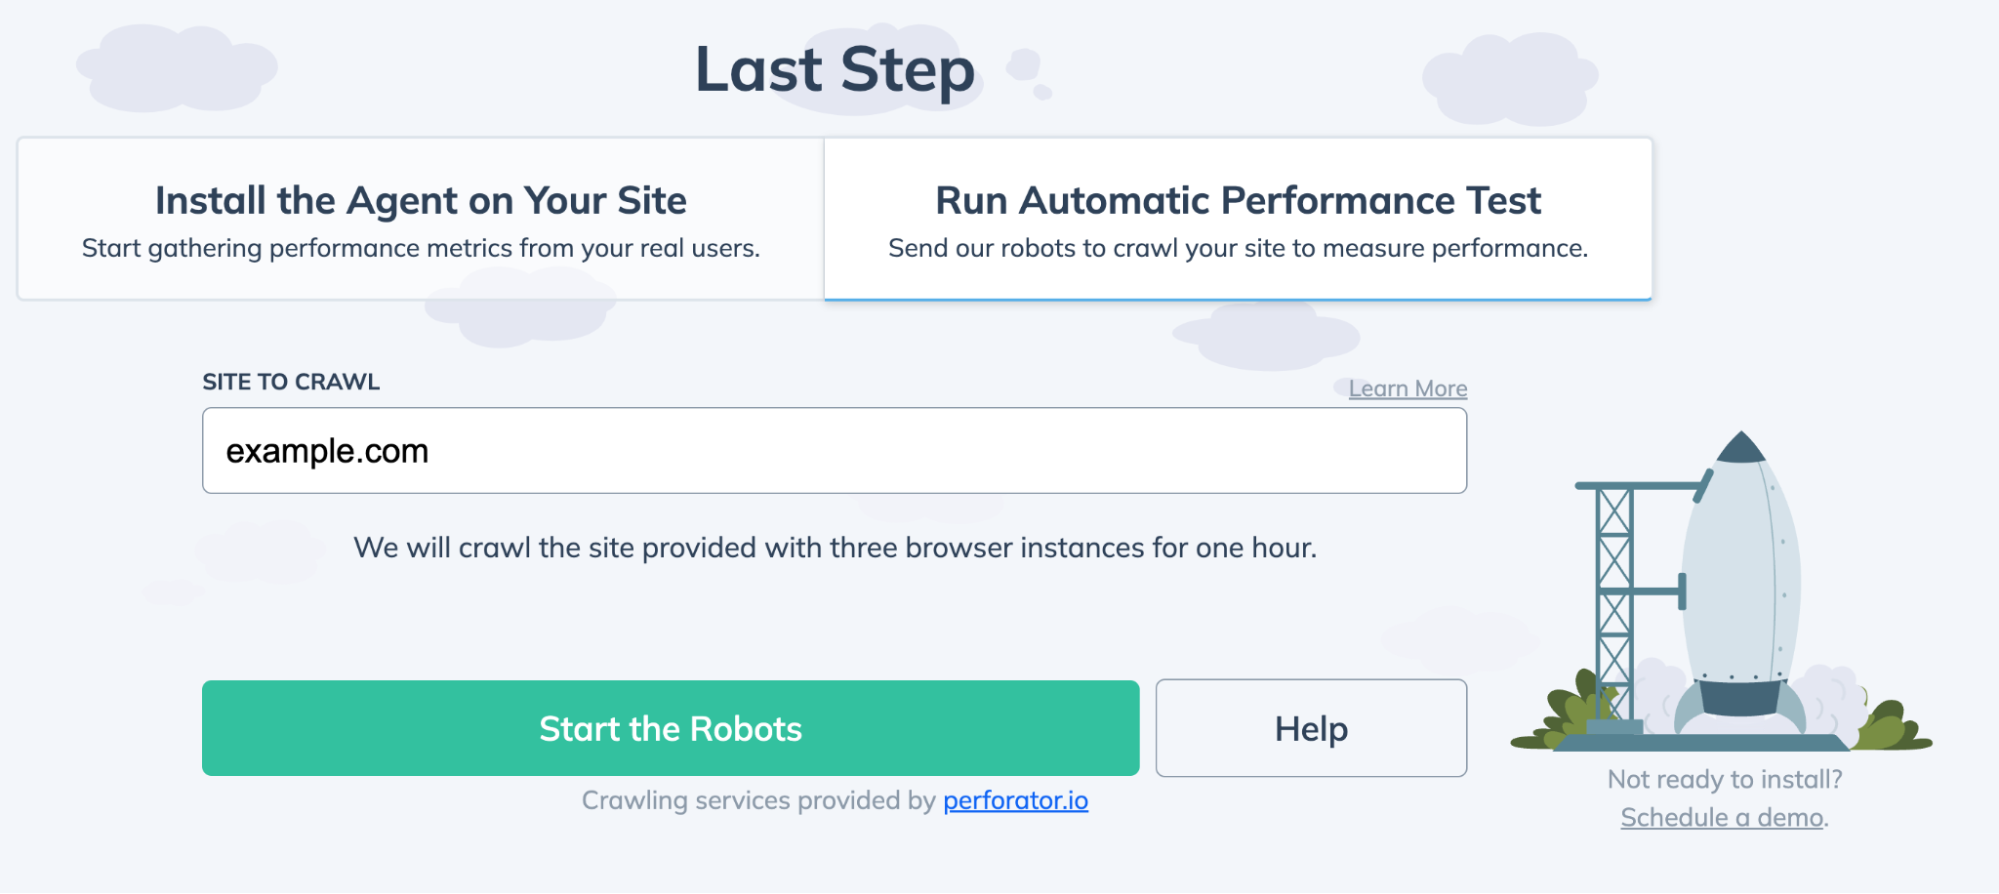
Installing the required tracking agent during onboarding creates confusion and complexity.
Pricing
Start with a free trial, then pay $5 monthly for up to 10,000 synthetic checks.
4. Pingdom
Pingdom is a website monitoring service that also includes a real user monitoring service to track end-user interactions and performance metrics on websites, priced starting at $10 per month.
Key Features
- Geographic tracking of user activity with live mapping
- Performance metrics including load time, time to first byte, and Apdex score
- Browser, device, and platform-specific analytics
- Customizable performance threshold alerts
- Historical trend analysis and comparison
- Deployment via single code snippet
Pros
Records user interactions to create automated tests, monitors site uptime with a shareable status page, and integrates with monitoring tools to provide infrastructure metrics and code-level visibility.
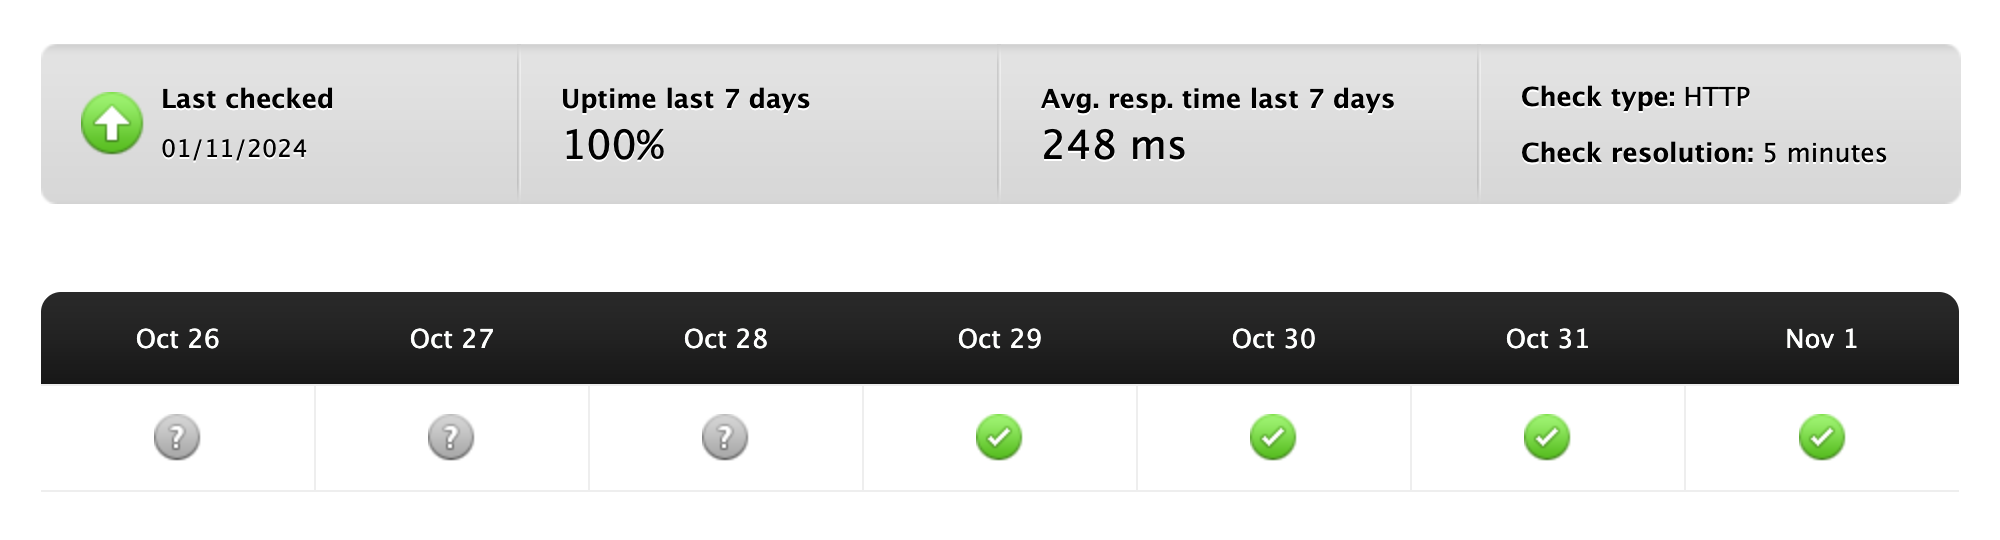
Synthetic uptime checking: Pingdom can also generate status pages for you
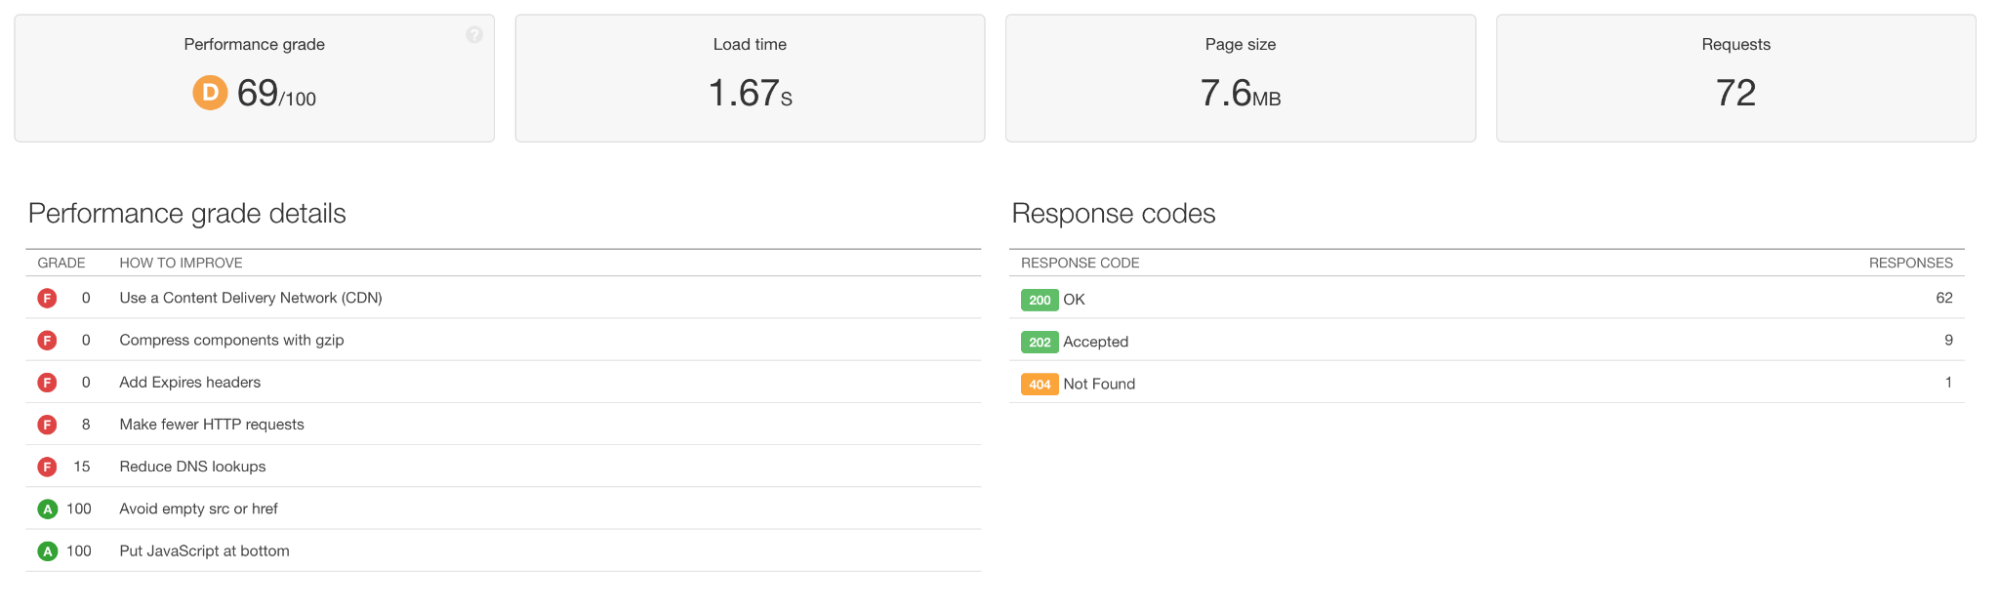
Synthetic lab-based tests give you a report and recommendations for how to improve performance.
Cons
Performance monitoring lacks depth, notably missing Core Web Vitals tracking. Available metrics provide insufficient detail to properly diagnose and debug performance issues.
Pricing
Users can start with a free trial before choosing between $10/month (billed annually) for either 10 uptime checks or 2 transaction checks monthly.
5. New Relic
New Relic is a suite of monitoring tools, including a synthetic monitoring service and a real user monitoring service that tracks and analyzes web application performance from the end-user's perspective through browser-side data collection.
Key Features
- Core web vitals tracking (LCP, INP, CLS) for SEO optimization
- Error rate monitoring with deployment correlation
- Geographic usage patterns and device-specific performance metrics
- Browser-specific performance tracking and troubleshooting
- Backend service connection through distributed tracing
- Real-time alerting for performance indicators
Pros
Monitor your website and infrastructure while watching user session recordings to correlate logs with on-page events. Track page views with filtered analytics and query dashboard data using AI-powered insights.
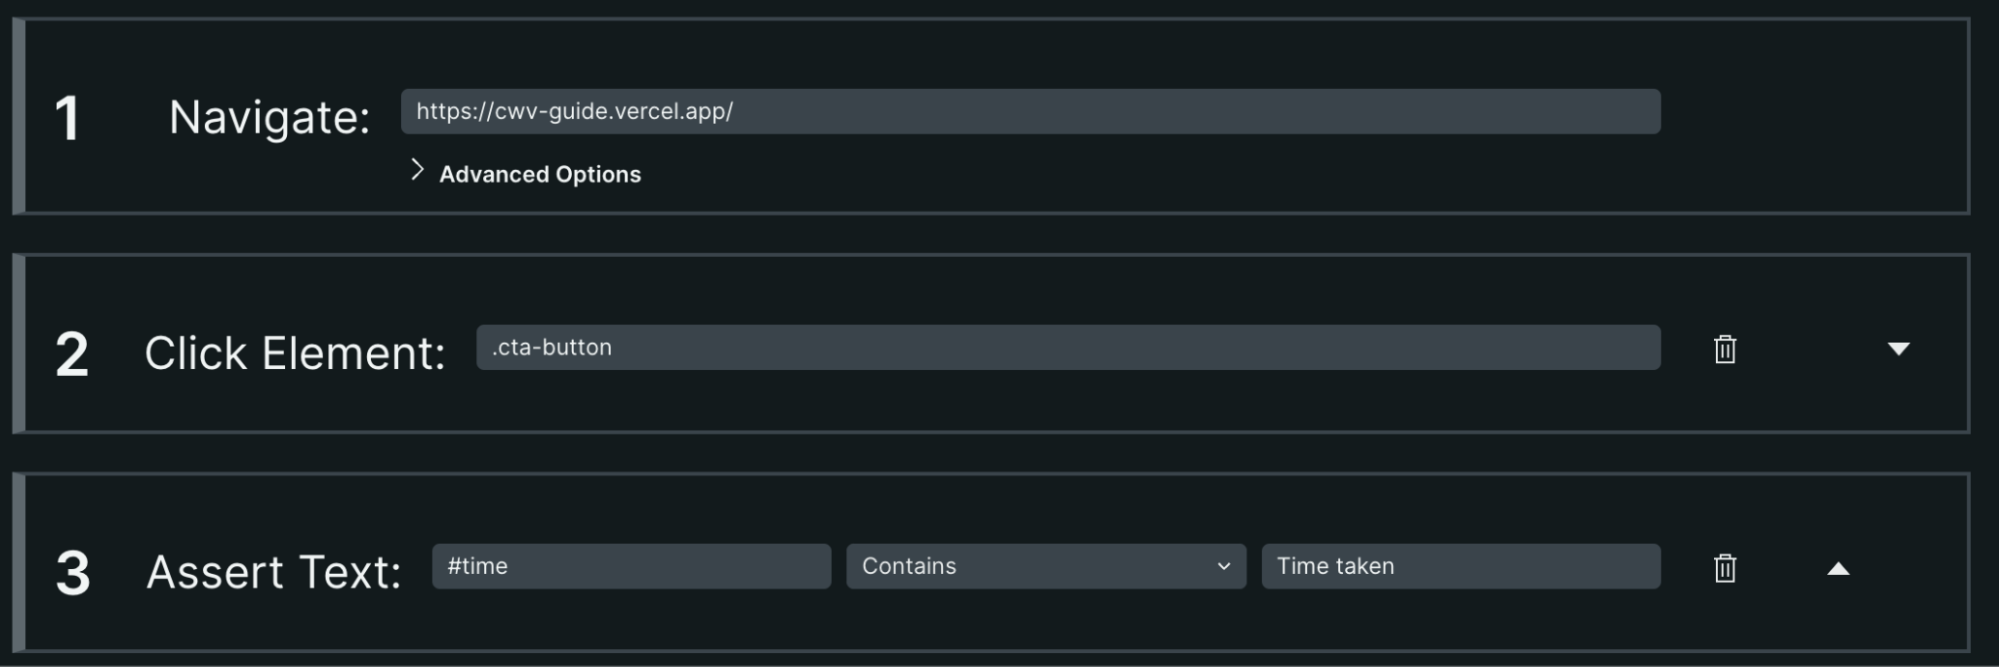
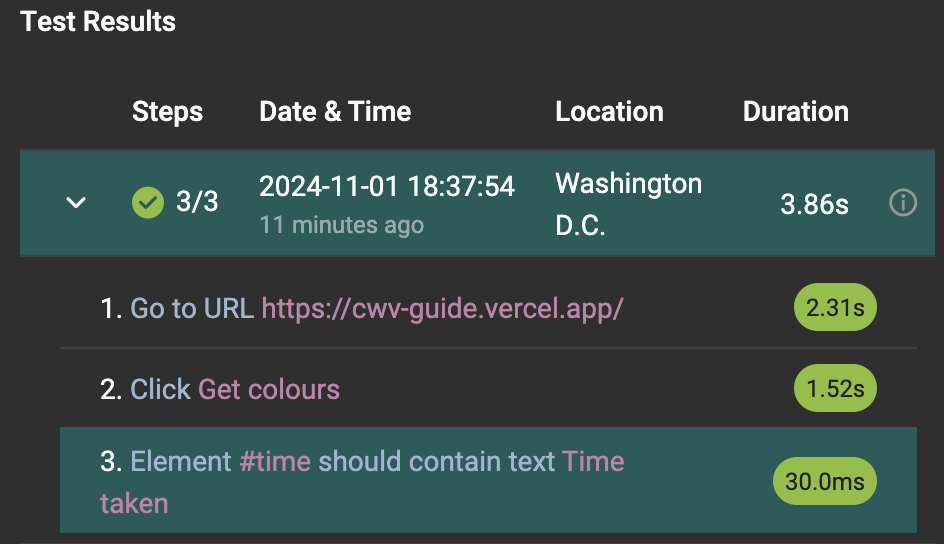
This synthetic test captures the clicking of a call-to-action button, and asserts the page updates as expected:
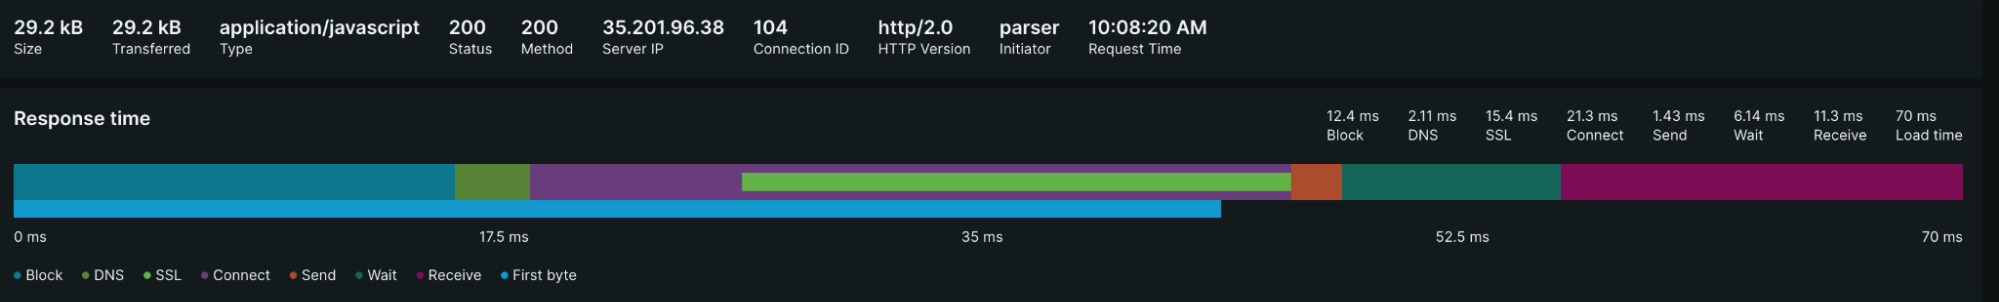
You can dive into specific network request details when looking at a lab test. Synthetic lab tests capture the usual performance and network related metrics you're likely to expect
Cons
The interface's complexity hinders easy information access. Data analysis lacks depth, particularly for web performance metrics.
Pricing
Start with a free trial and pay based on your usage.
6. Request Metrics
Request Metrics is primarily a RUM service that tracks website performance metrics and Core Web Vitals to identify speed issues affecting actual users. It also has some synthetic monitoring capabilities.

Key Features
- Real-time performance monitoring of page loads and user interactions
- Automatic URL pattern detection and page grouping
- Resource waterfall analysis to identify slow-loading assets
- Core Web Vitals tracking for SEO optimization
- Third-party script impact analysis
- Regional performance tracking by country
- No-code trial option with performance scanning
Pros
Monitor and debug Core Web Vitals through detailed interaction analysis, track user journeys step-by-step, and visualize website performance metrics in a clean dashboard interface.
Request Metrics is geared towards real user monitoring, however synthetic lab data is available if you do not have real users yet, for example for a site that has not yet been released.
Cons
Useful features are restricted to premium pricing tiers. Synthetic testing remains basic and secondary to the core product.
Pricing
Start with a free trial, then choose from plans starting at $37/month for the Essentials plan.
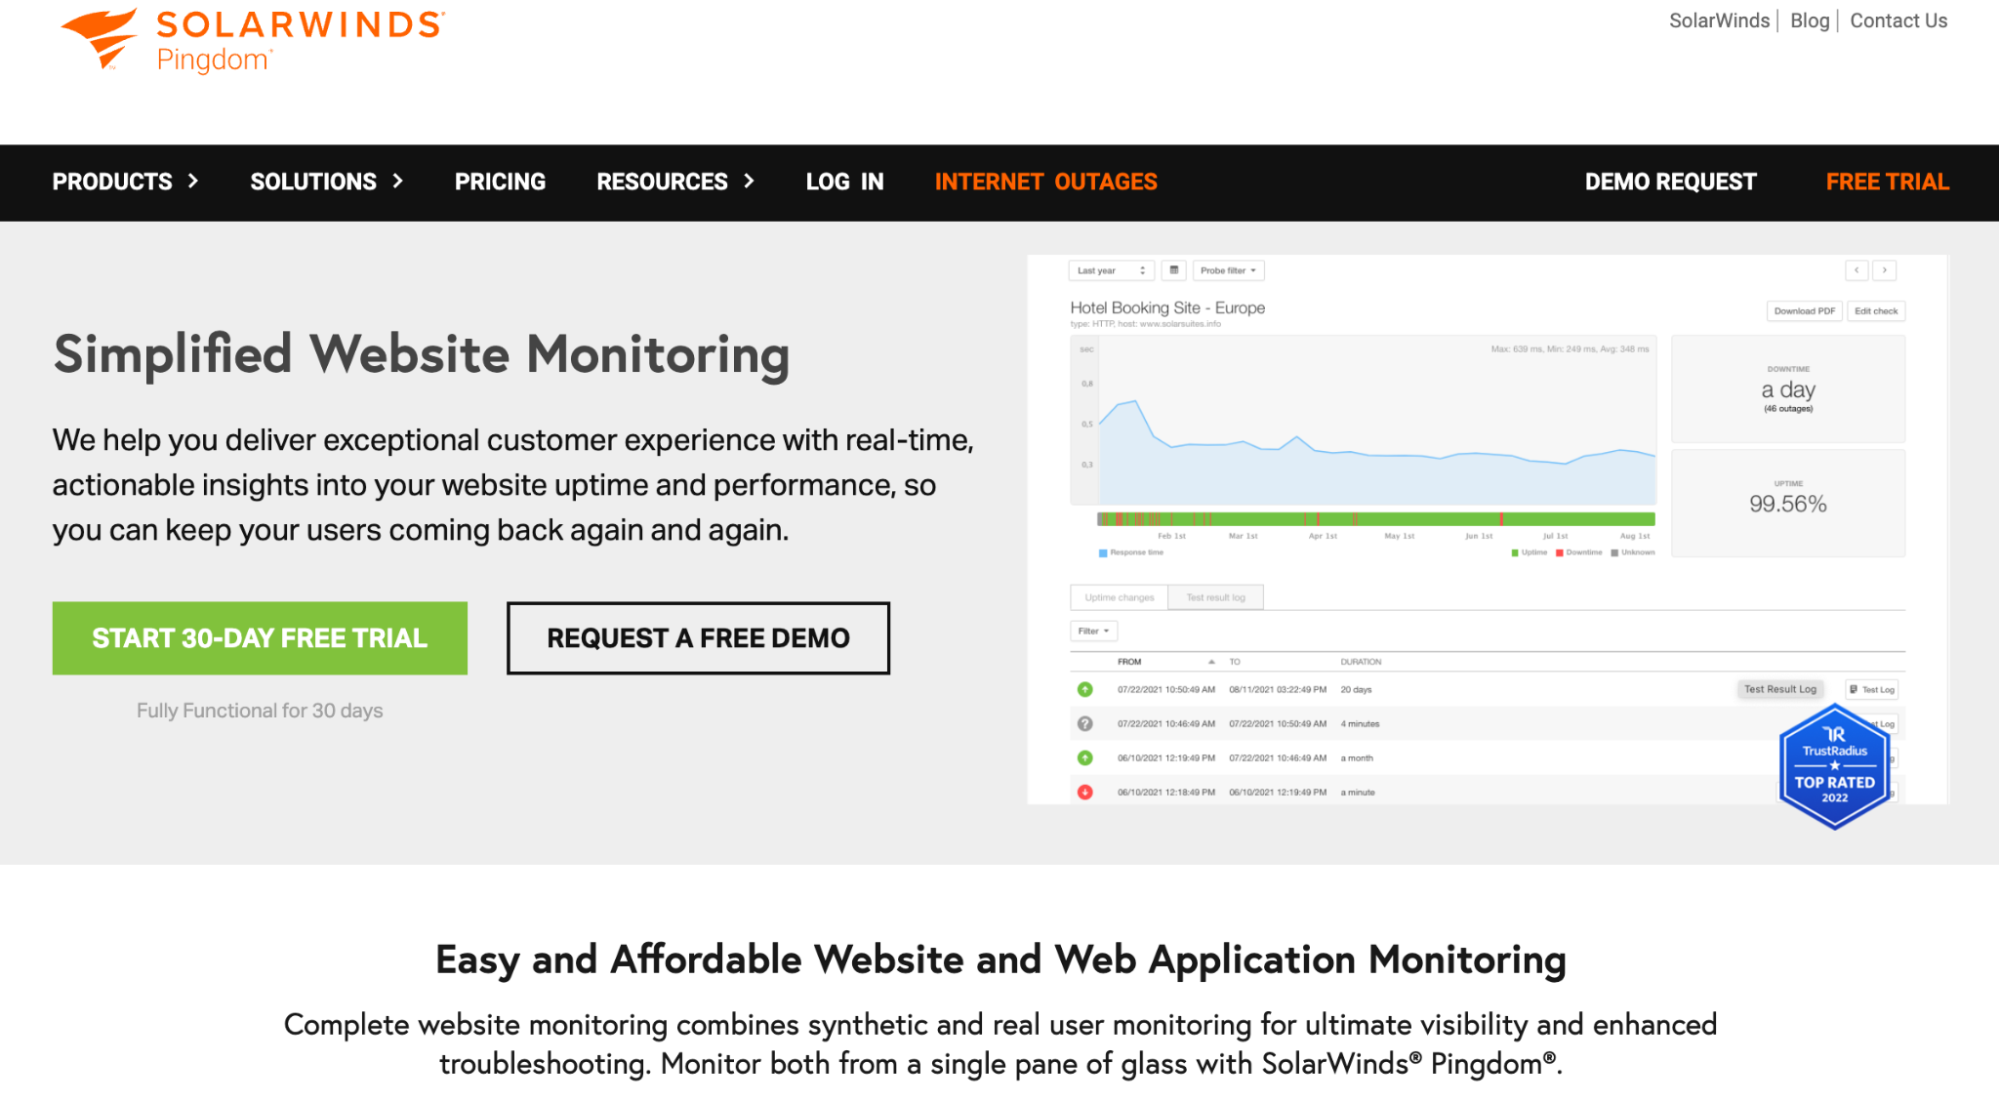
7. Solarwinds
SolarWinds Observability SaaS provides real-time monitoring of web application performance and user experience, combining website metrics with application performance monitoring.

Key Features
- Real-time tracking of page speed, uptime metrics, and user experience by region, device, and browser
- Integration with APM for combined client-side and server-side monitoring
- Performance analysis through customizable alerts and Apdex satisfaction ratings
- Root cause identification through transaction traces and database query analysis
- Single interface monitoring of end-user experience, application servers, infrastructure, and databases
Pros
Monitor user transactions and verify journey functionality while tracking logs across your application, infrastructure, and database. Analyze and filter data through customizable reporting tools.
Synthetic transaction monitoring lets you capture critical user journeys in your web application:
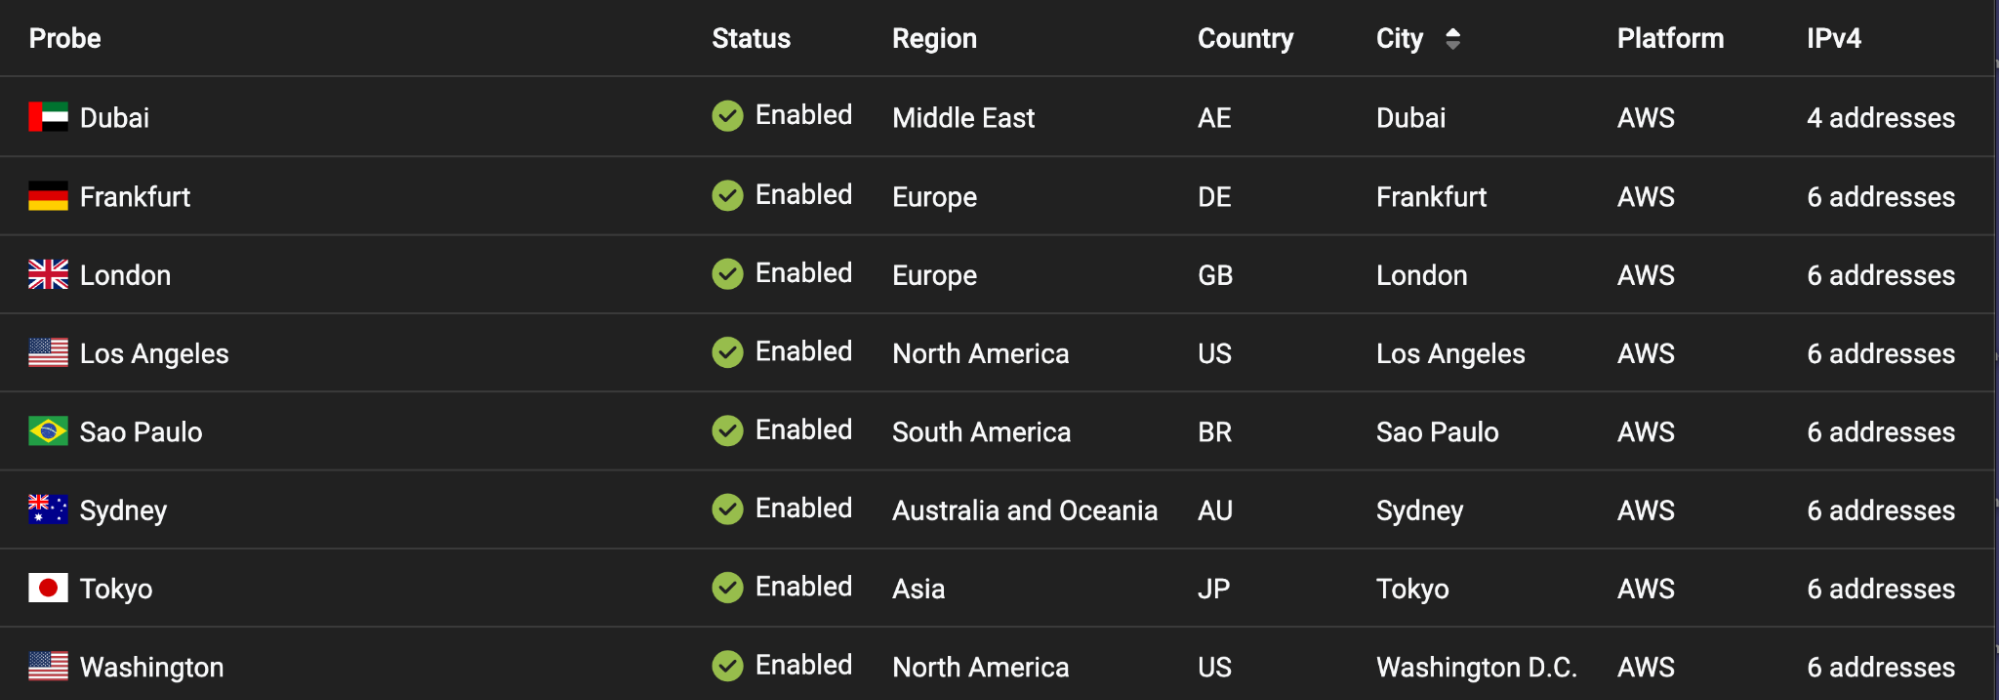
Synthetic tests can originate from a number of different regions, helping you understand what performance looks like from across the world.
Cons
The complex interface and dashboard structure hinders information discovery and access. Limited performance metrics obscure problem diagnosis and root cause analysis. Core Web Vitals data is incomplete, specifically missing Interaction to Next Paint measurements.
Pricing
Users can start with a free trial before choosing between $10/month (billed annually) for either 10 uptime checks or 2 transaction checks monthly.
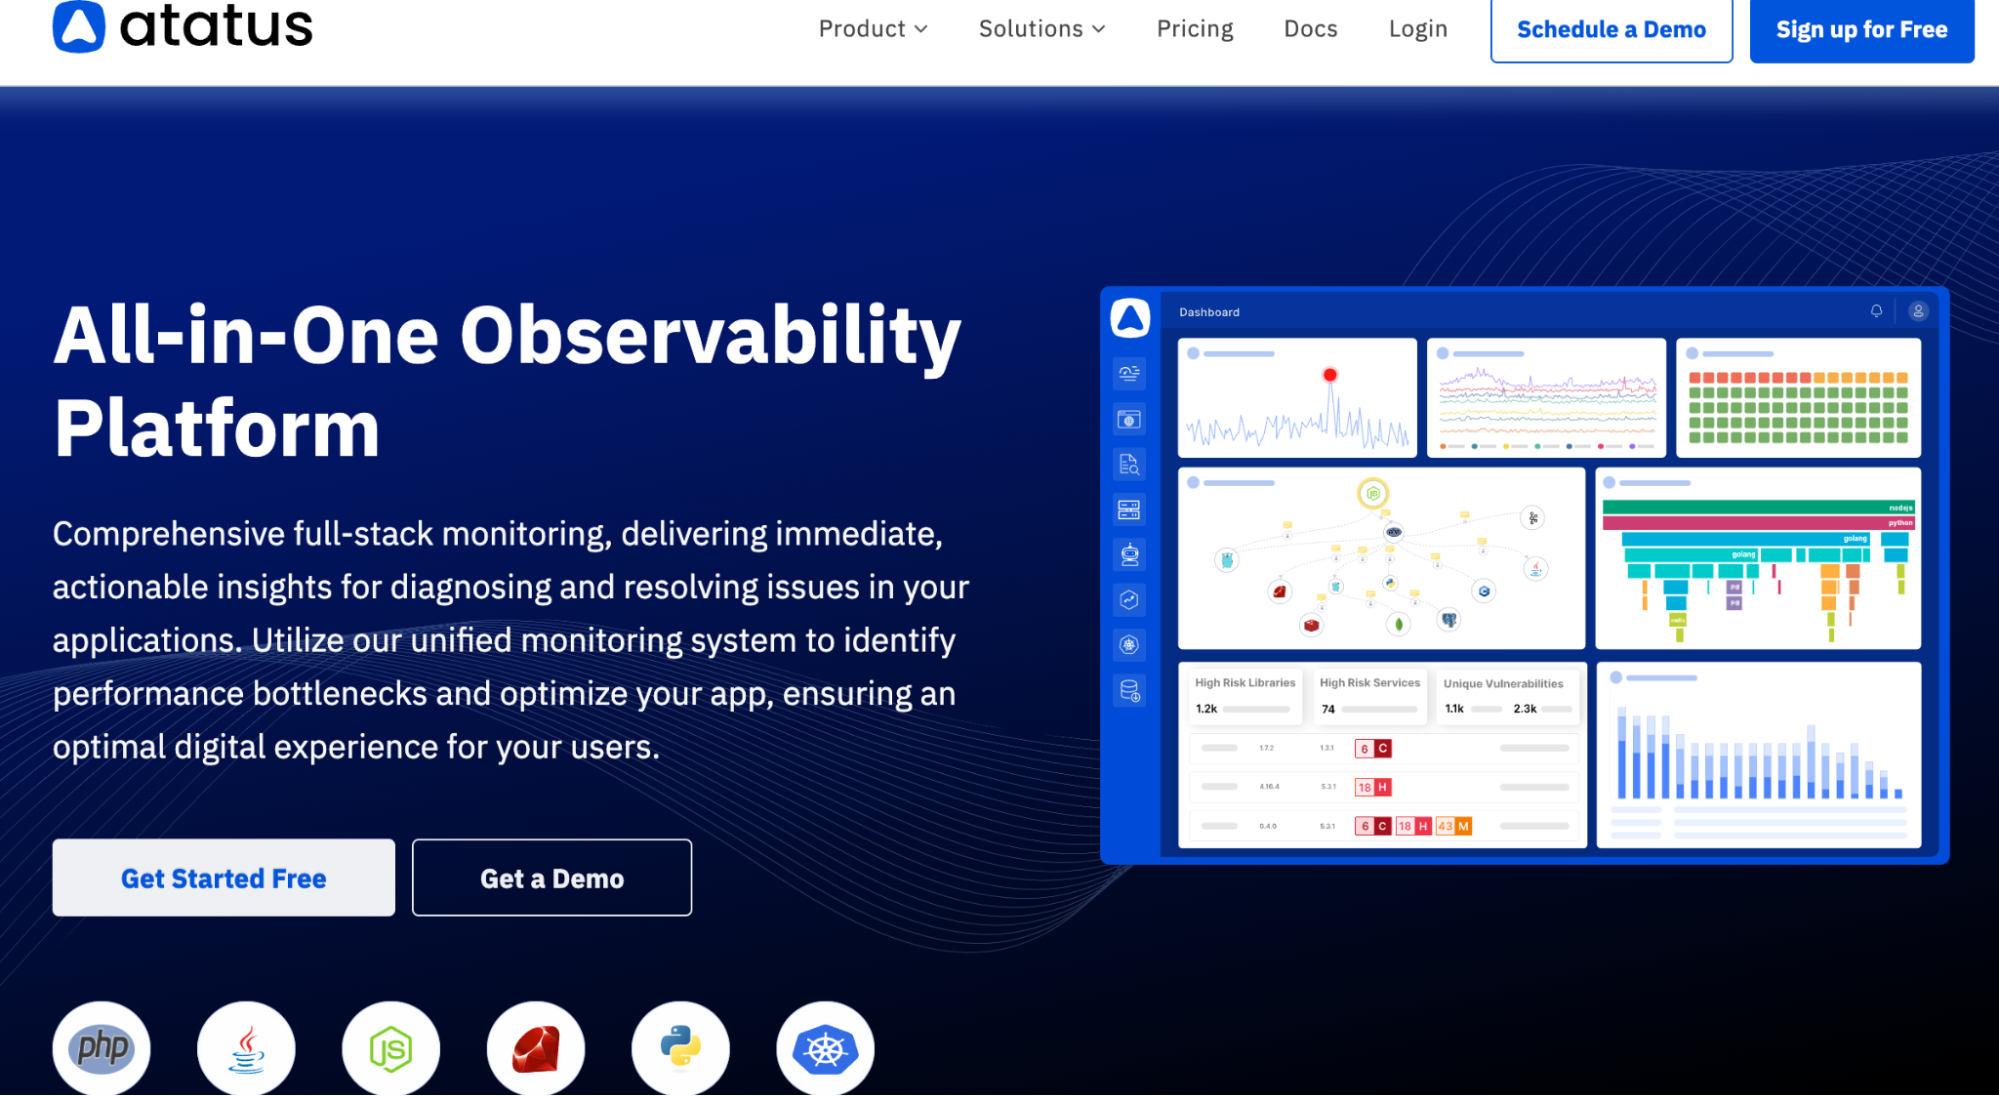
8. Atatus
A monitoring solution that tracks end-user experience and frontend performance metrics for web applications in real-time.
Key Features
- Web vitals monitoring (FID, LCP, FCP, INP, TTFB, CLS)
- Page load performance tracking with resource waterfall analysis
- Single page application (SPA) route change monitoring
- AJAX performance tracking
- JavaScript error detection and diagnosis
- User session replay and journey mapping
- Deployment impact measurement
Pros
Track website performance through analytics dashboards that monitor usage patterns, code deployments, and network statistics. Link deployment changes directly to performance regressions.
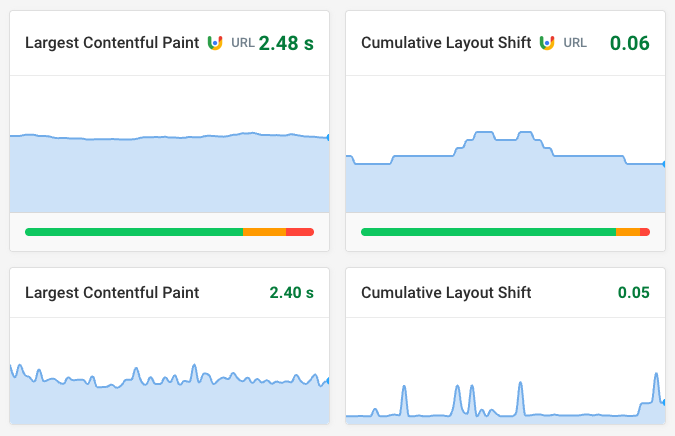
In lab-based synthetic tests, you get helpful charts and visualizations to show how your website is performing over time, when accessed from one particular location.
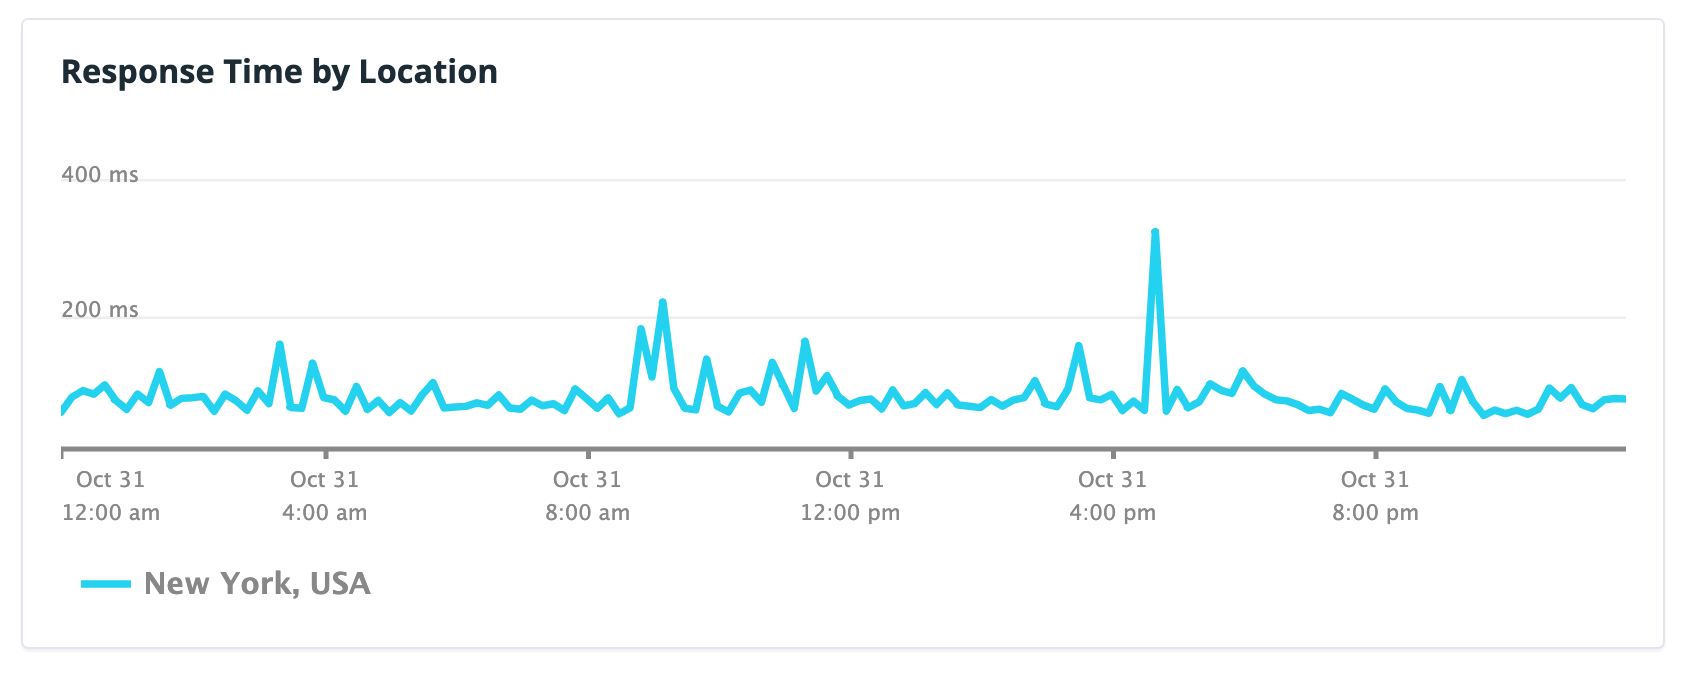
Atatus offers a number of useful synthetic test measurements:
Cons
Performance metrics, especially Core Web Vitals, lack detailed data to diagnose and troubleshoot low scores. This limited visibility hinders accurate performance analysis and improvement efforts.
Pricing
Start with a 14-day free trial, then pay $2/month for up to 10,000 synthetic checks monthly.
9. Calibre
Calibre is a web performance monitoring platform to track Core Web Vitals and other performance metrics.
Key Features
- Core Web Vitals monitoring using Chrome User Experience Report data
- Performance budgets with alerts via email and Slack
- CI/CD integration for pull request performance reviews
- Third-party impact analysis and JavaScript task monitoring
- API access through Node.js and CLI tools for automation
Pros
Includes a simple user interface to view basic performance data of the specified website.
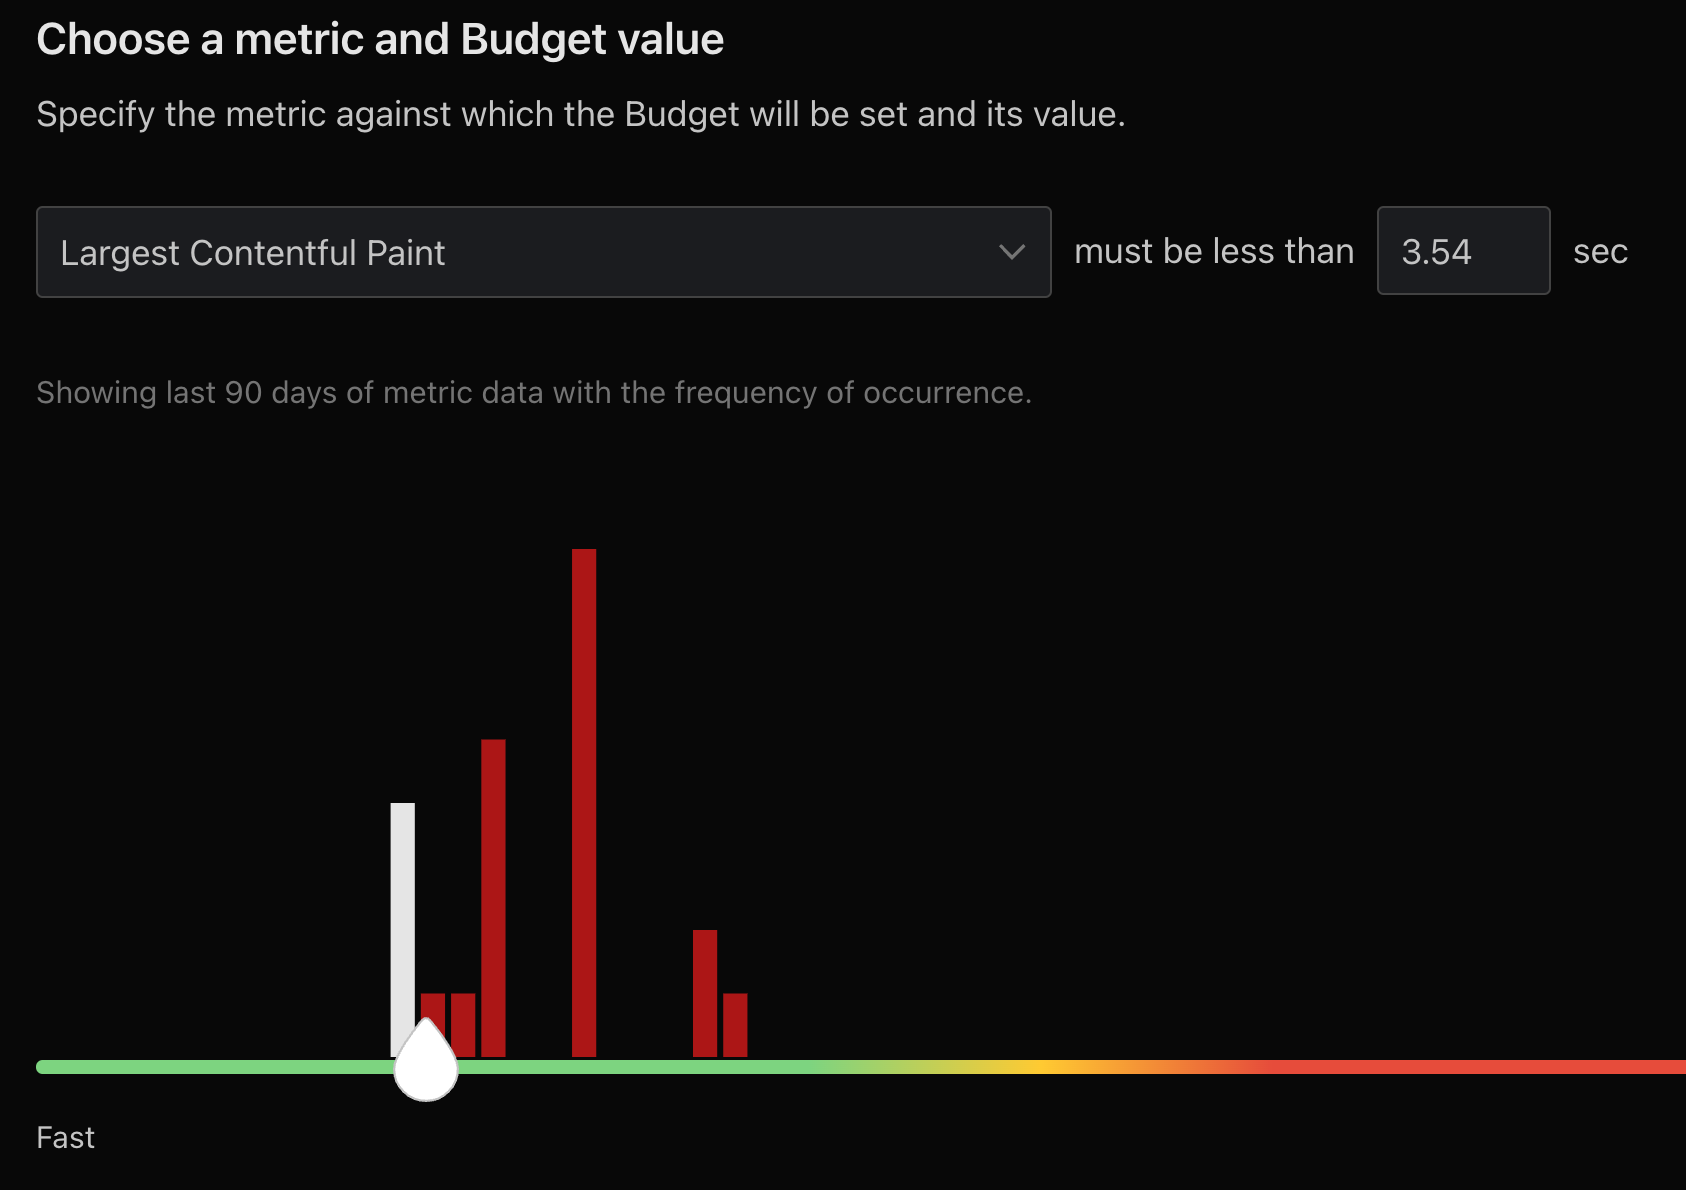
Synthetic monitoring in Calibre gives a big focus on performance metrics, such as Core Web Vitals.
You can set budgets for your synthetic tests. This can alert you when scores are below a certain threshold.
Cons
The service displays limited real-user data from Google CrUX dataset and shows nothing if your site isn't included there. Performance insights don't extend beyond basic Lighthouse metrics.
Pricing
Start with a free trial, then pay $75 USD monthly for up to 5000 synthetic checks.
How to choose a synthetic monitoring tool
When choosing a synthetic monitoring tool, consider the following factors:
- Supported metrics
- Global test locations
- Data quality
- Reporting depth
- Alerting support
- Available integrations
Supported metrics
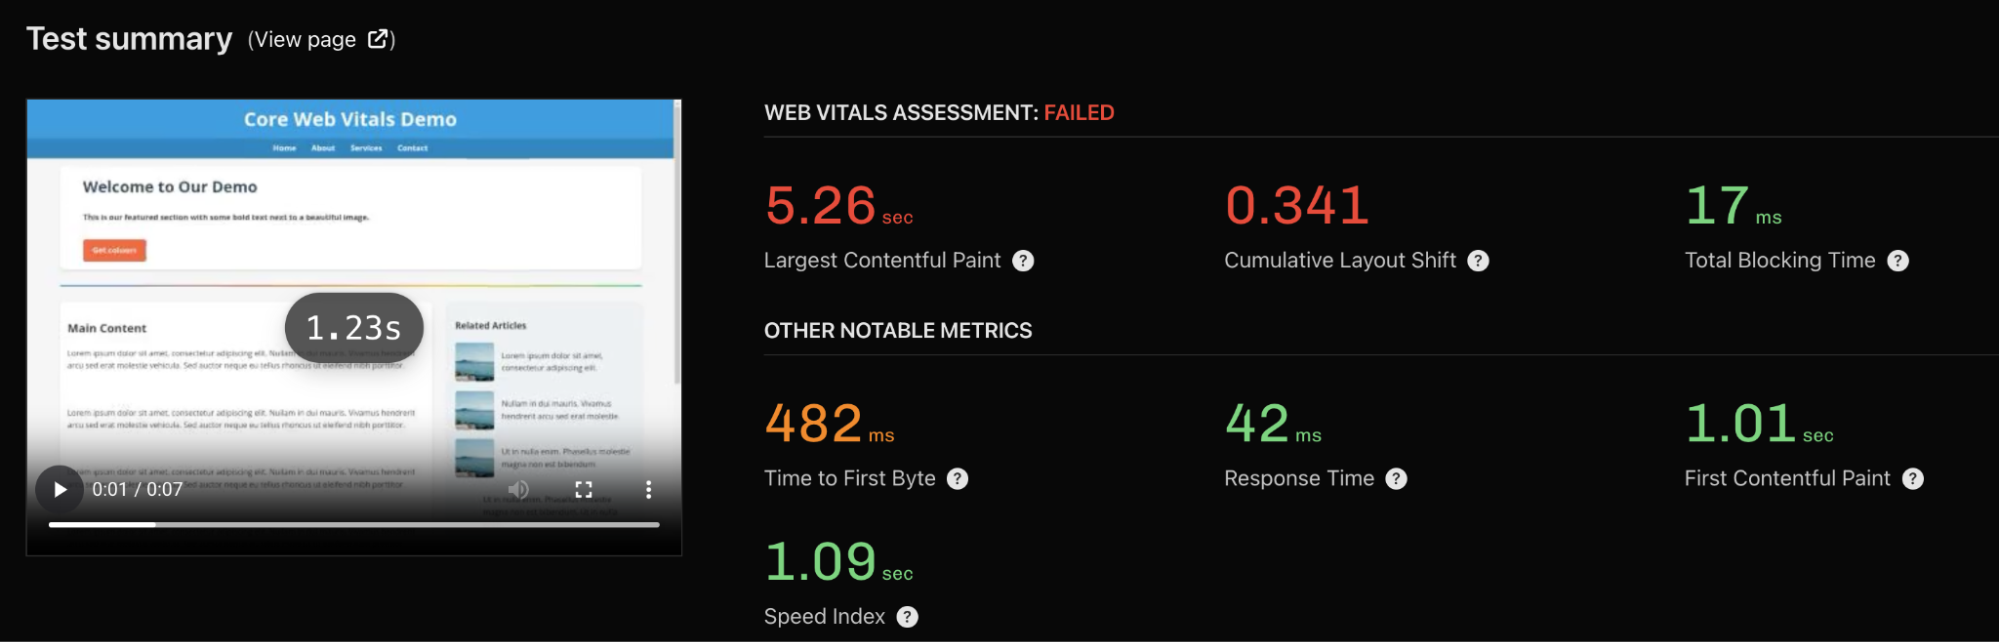
When testing website performance it's important to measure modern user-centric metrics. That includes Google's Core Web Vitals, especially the Largest Contentful Paint metric that measures page load time.
Cumulative Layout Shift, another Core Web Vital, is also important to measure during the initial load of a website. It indicates whether content shifts around on the page after rendering. Visual instability is confusing to the user and can result in accidental clicks.
Time to First Byte and First Contentful Paint are also important metrics for understanding your page speed.
Many synthetic monitoring tools go far beyond that, providing detailed metrics on page load milestones, page weight, CPU processing, and on-page errors.
Monitoring Lighthouse scores is also a good practice, as it can quickly highlight regressions in the Performance, SEO, and Accessibility categories.
Finally, a few tools complement their synthetic metrics with real user Core Web Vitals data from the Chrome User Experience Report (CrUX). This tells you how fast your website is for actual visitors. CrUX data is also important for SEO, as Google uses it as a ranking factor.
Global test locations
Another factor to check is whether the monitoring tool allows you to test your website from different locations across the globe. Website speed varies depending on where you website is accessed from, so testing from a location close to your visitors lets you make sure your website is fast enough for them.
The location doesn't have to match exactly – you won't see a big difference between a test run from France or Belgium – but should be reasonably close.
Data quality
Another question to consider is whether you can trust the reported data. One common issue with Lighthouse-based tools like PageSpeed Insights is that they are unreliable.
Check that the tool actually throttles the network when running a test, rather than collecting data on a fast connection before simulating a slow interaction. If a Lighthouse report is provided you can check the test settings to see whether the network data includes the word "Simulated".
Tools with simulated throttling usually don't provide request waterfall, so if you see one that's a good sign.
Unreliable tools may give you a poor performance score even when your website is fast.
Reporting depth
Another challenge is how much data is available to investigate performance issues. Many tools just present data from Google's free Lighthouse report without providing additional detail.
Some things to look out for:
- Request waterfalls
- Rendering video view
- Custom recommendations
- Comparisons across tests
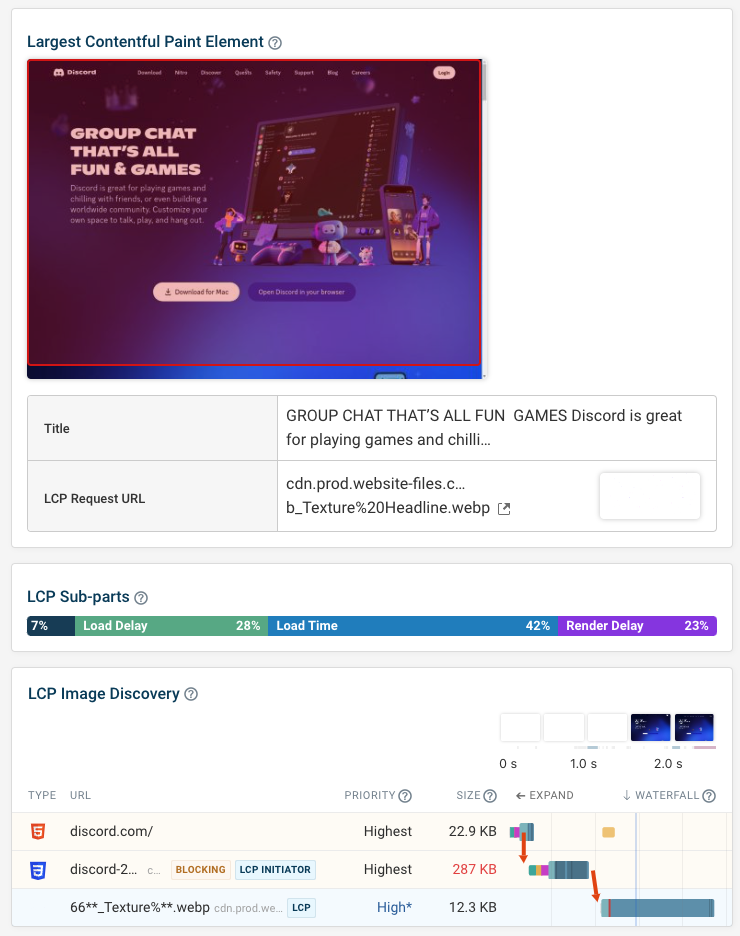
For example, DebugBear provides a lot of additional insight when inspecting a metric like the Largest Contentful Paint.
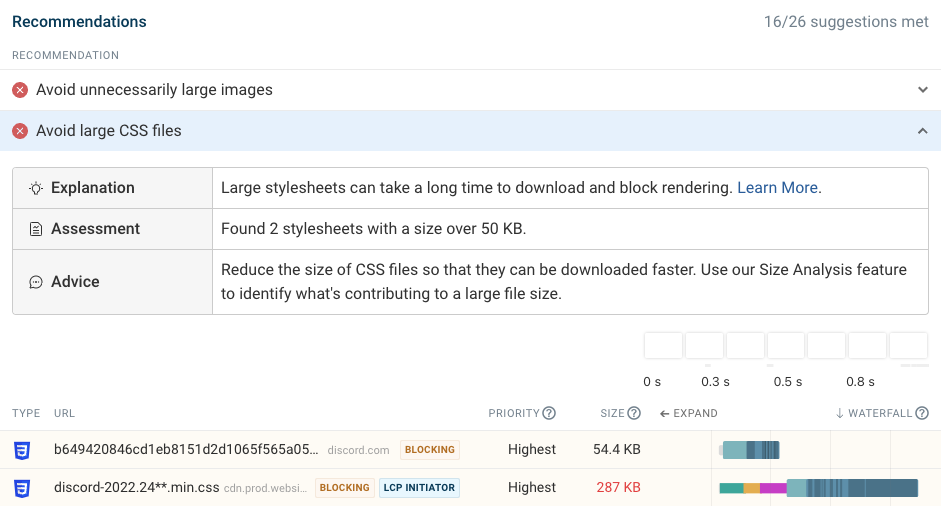
You also get custom performance recommendations that go beyond Lighthouse audits. For example, you can identify and debug large CSS files, or avoid excessive font preloading.
Alerting support
A big benefit of having synthetic monitoring in place is that you'll get automated alerts when a new deployment, third-party change, or content update starts to impact your performance metrics.
Check that you can configure custom performance budgets to control alerts and configure what pages are included in alerts.
Available integrations
Integrations make it easy for your team to access performance data where you're already working. Whether that's Slack, Microsoft Teams, or GitHub, having page speed metrics quickly available and noticing alerts early helps you deliver a fast website.
What are the limitations of synthetic monitoring tools?
Synthetic tools are a great help when improving your website, but there are certain types of information you can't get from them:
- Real user experience: lab tests don't tell you how fast your website is for your actual visitors. It may be that they tend to have particularly slow or fast connections, and you won't be able to know.
- User interactions on the website: a big part of how fast a website feels depends not on the initial load speed but on how quickly it responds to user input. While many tools allow you to script interactions, there's no guarantee that those interactions match what users most commonly do on the page.
To address these issues you can use real user monitoring. It will show you how performance varies across your visitor base and what a typical experience looks like. You can also use this data to debug issues with Google's Interaction to Next Paint (INP) metric.
Get started with website performance monitoring
There are lots of website performance monitoring tools out there. Most of them offer a free trial, so you can see how well they work for your use case.
Ready to get started? Sign up for DebugBear to get a detailed analysis of your website and see how fast it performs in our controlled lab environment.


Monitor Page Speed & Core Web Vitals
DebugBear monitoring includes:
- In-depth Page Speed Reports
- Automated Recommendations
- Real User Analytics Data