Web performance monitoring is key for maintaining a fast, reliable website. Real User Monitoring (RUM) tools track how actual visitors experience your site, while synthetic monitoring simulates user interactions in controlled environments.
This guide compares a number of RUM solutions. We evaluate some key features and limitations to help you choose the right tool.
DebugBear
DebugBear is a web performance monitoring service that tracks Core Web Vitals, site speed metrics, and user experience data to help optimize website performance and SEO rankings.
It has a particular focus on Google's Core Web Vitals metrics, providing detailed debug data for Largest Contentful Paint, Cumulative Layout Shift, and Interaction to Next Paint.
Key Features
- Real user monitoring across entire websites
- Reporting on what elements cause slow INP interactions
- Automatic alerts for performance regressions
- Track user engagement and business impact
- Support for synthetic testing and data from Google's Chrome User Experience Report (CrUX)
Pros
- Detailed performance metrics for Core Web Vitals, and more
- Intuitive high-level dashboards
- A wizard to guide you through locating, investigating, and fixing performance issues
- Advanced segmentation functionality based on device data and custom tags
- API integration and support for custom metrics
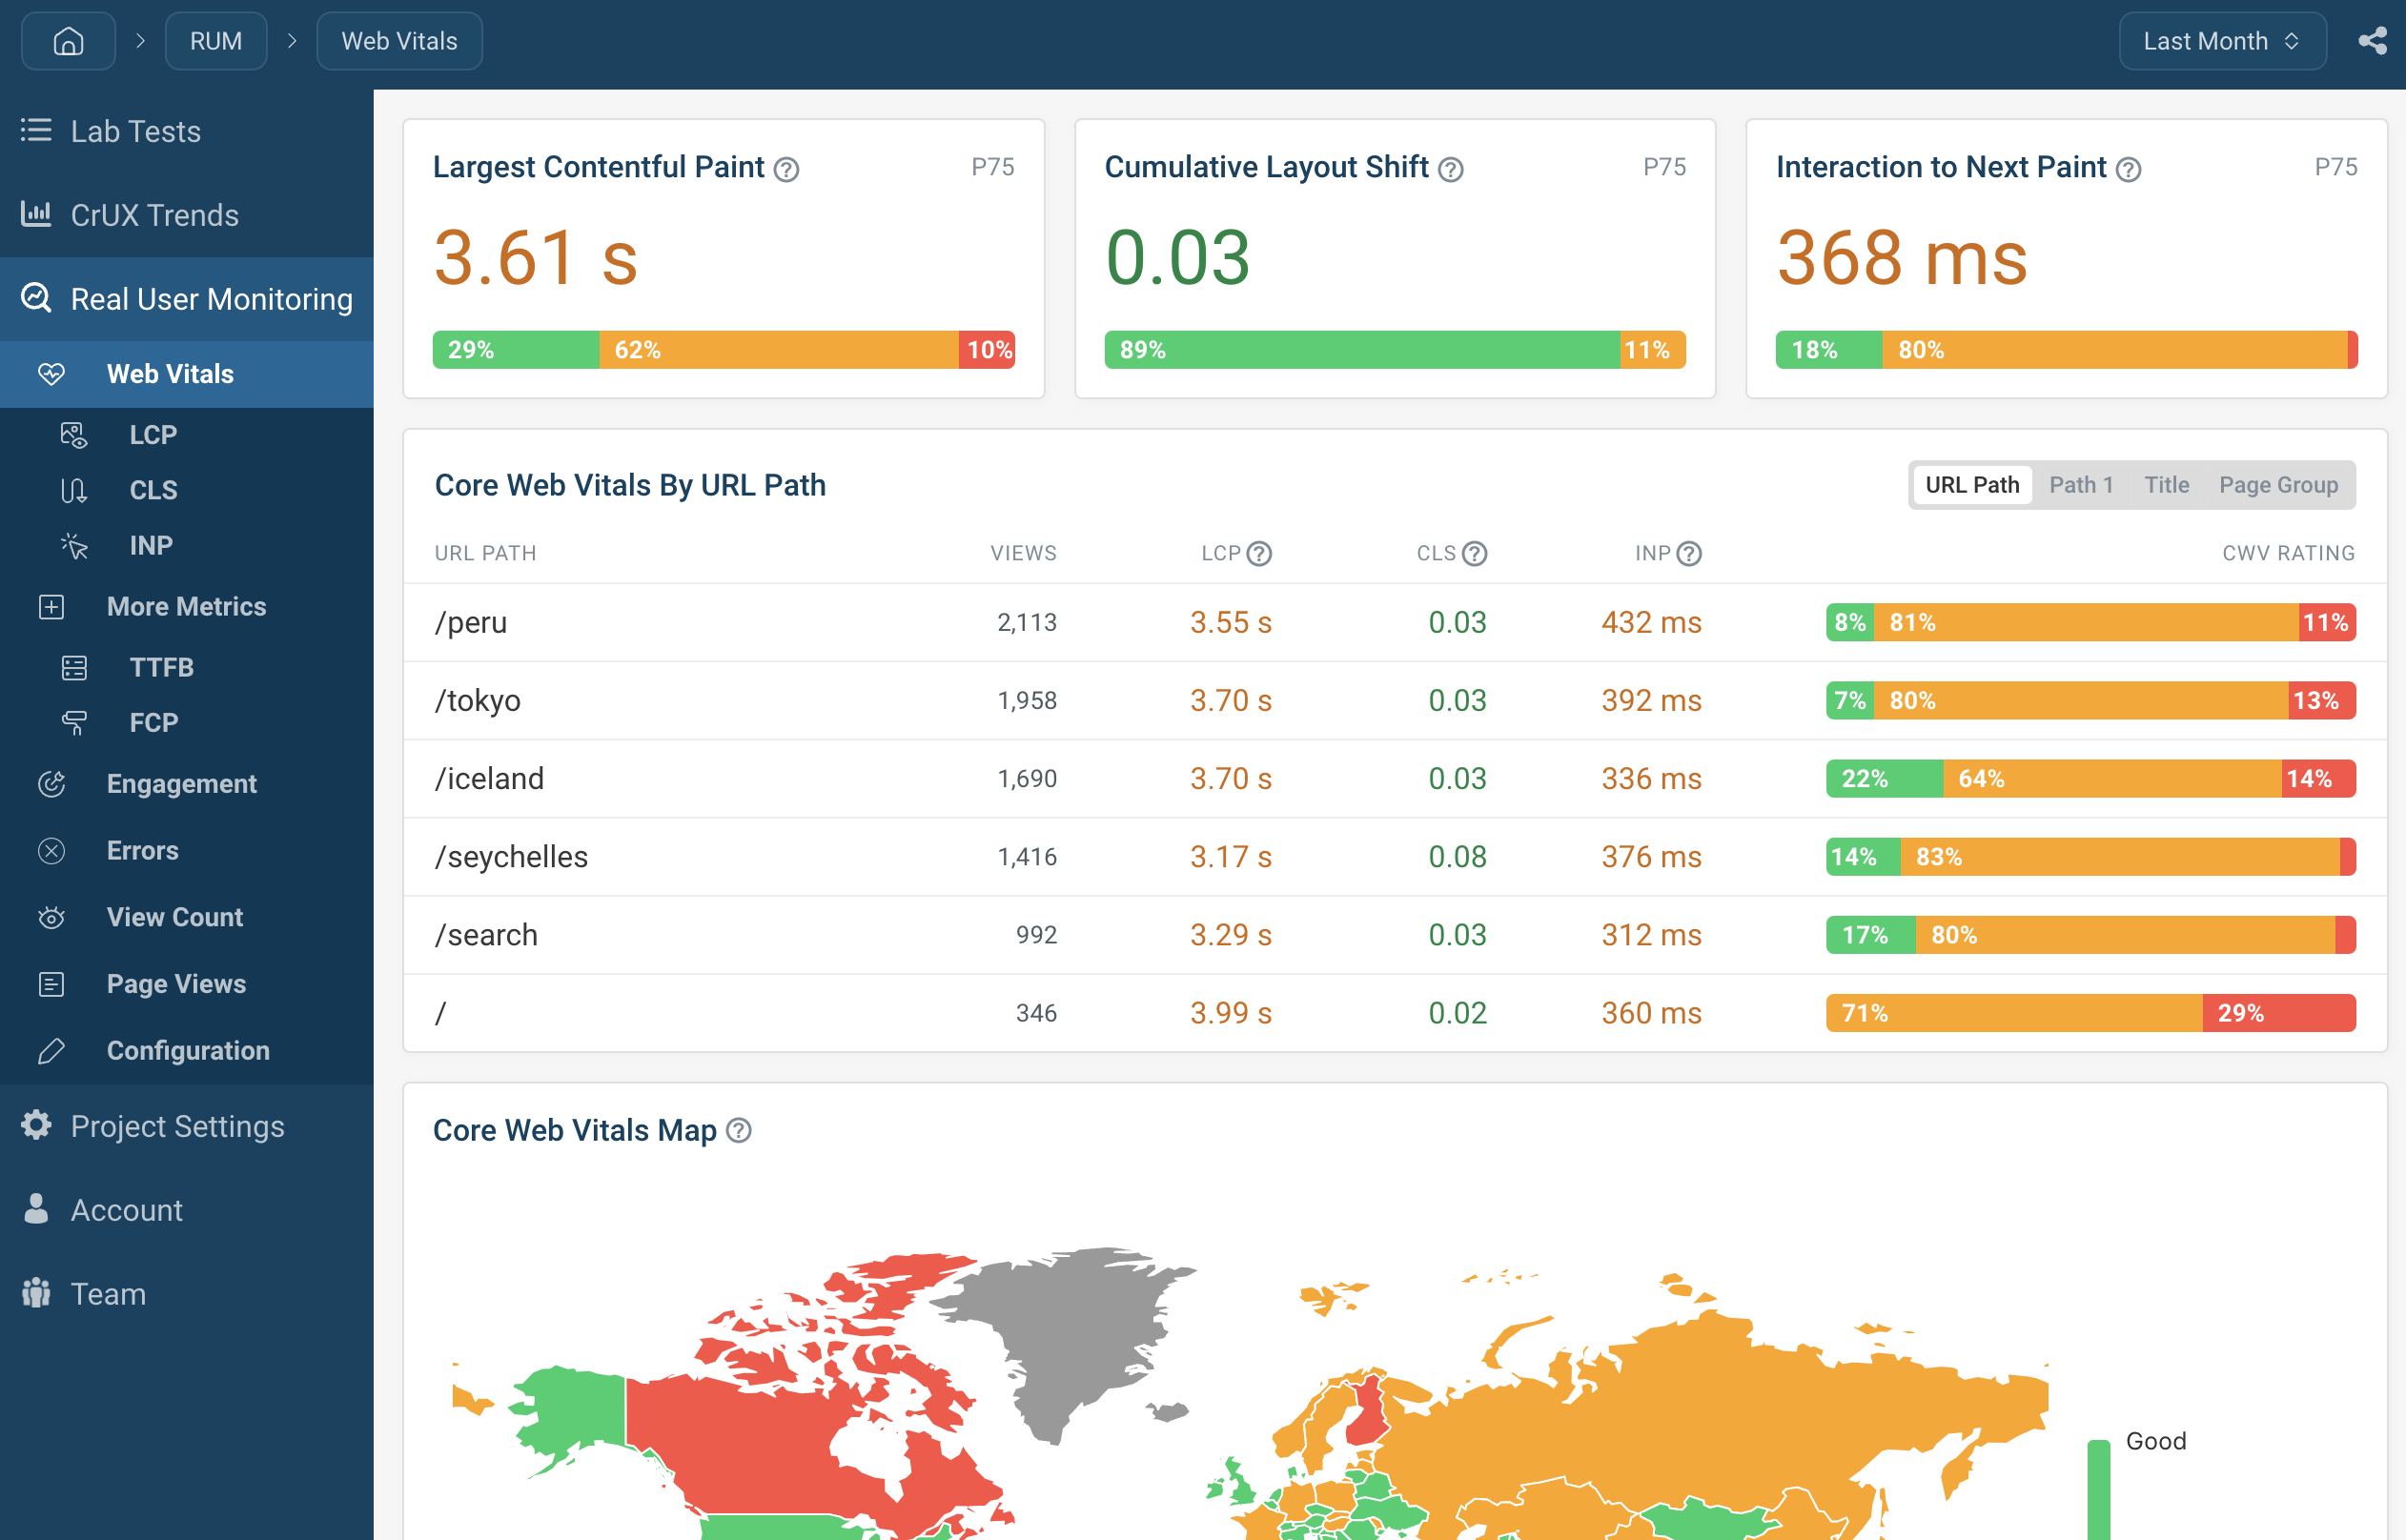
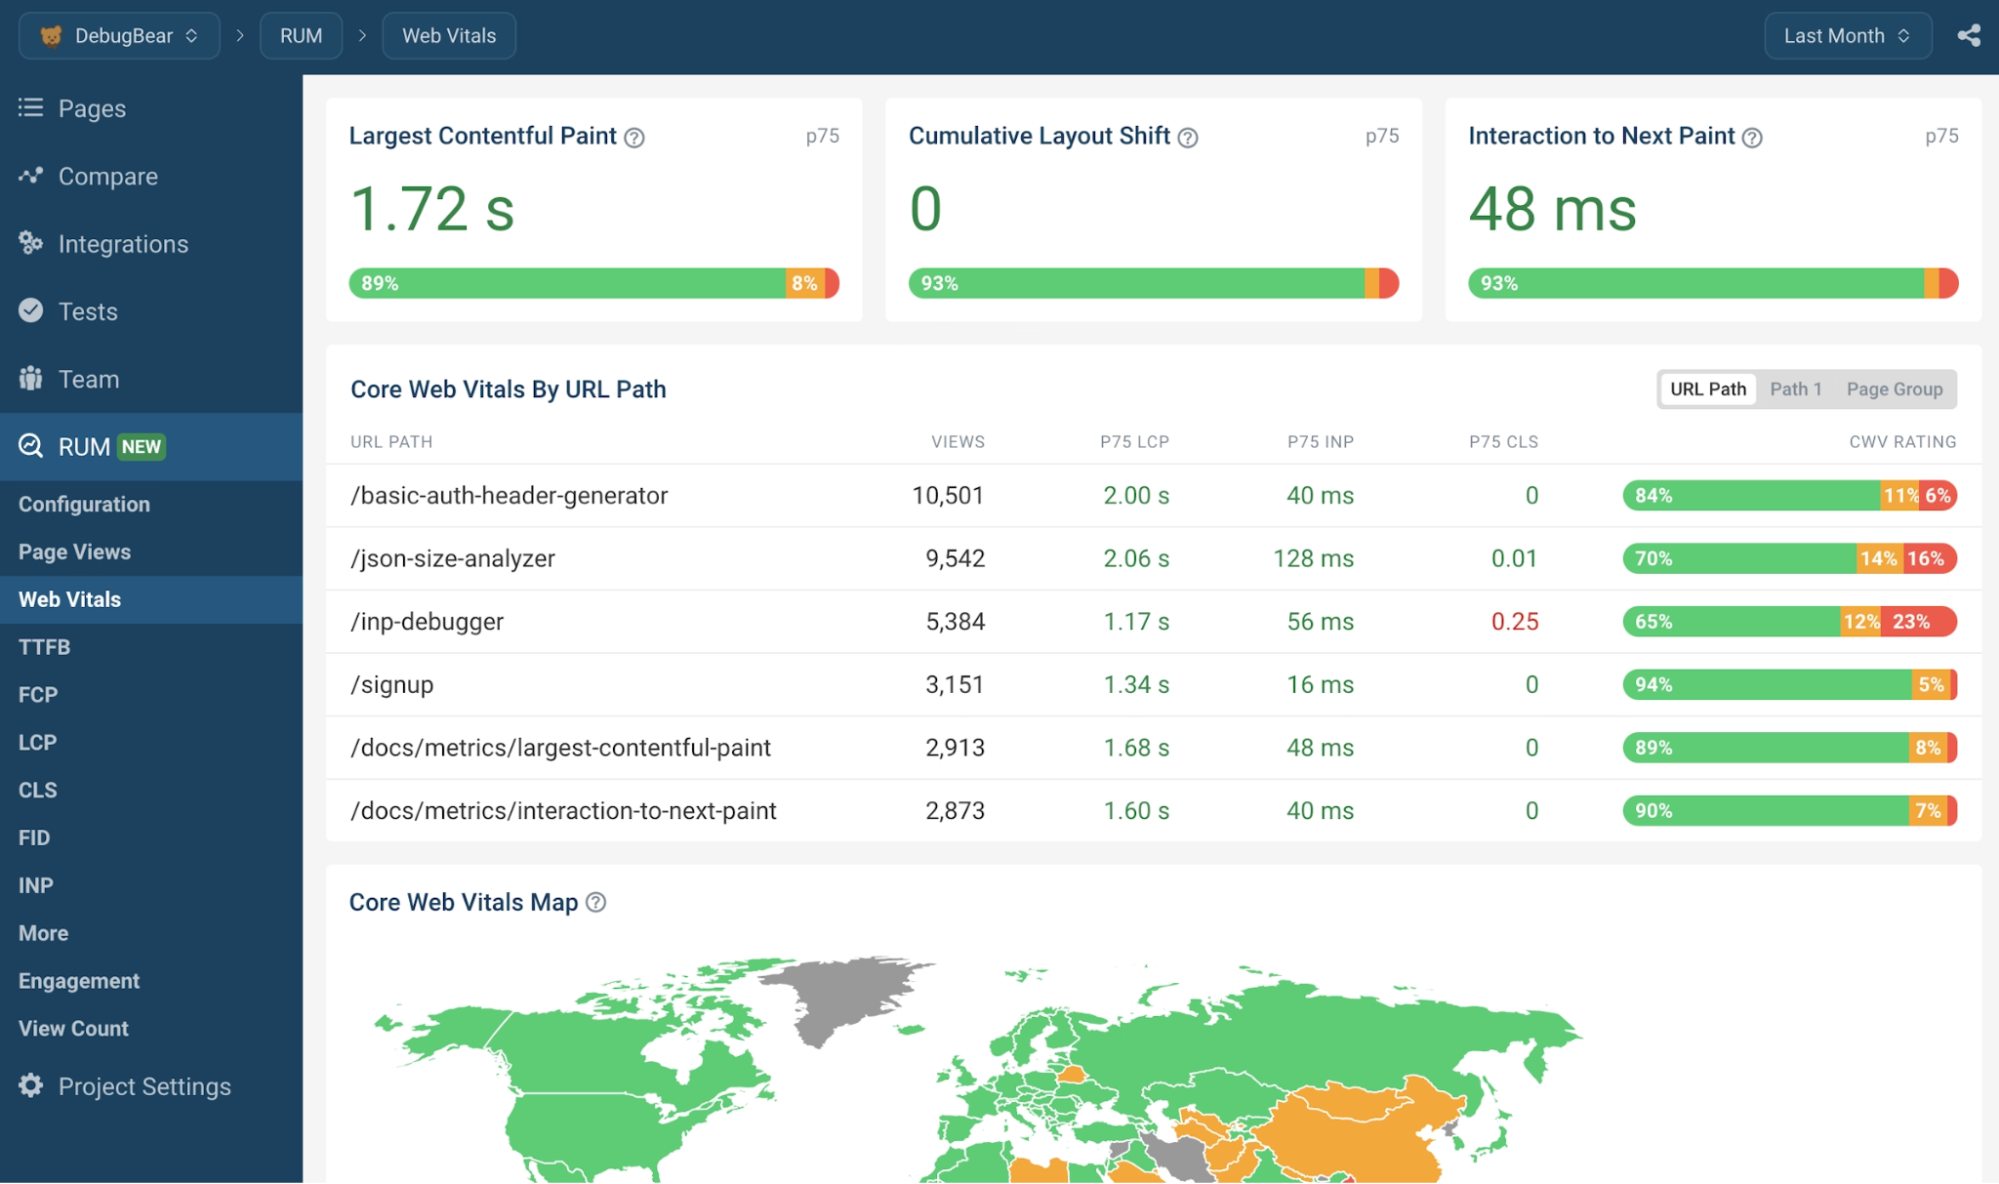
The real user monitoring dashboard on DebugBear provides an overview of Core Web Vitals across your site and for your most popular pages.
You can also see how performance varies across the world and how your page speed has changed over time.
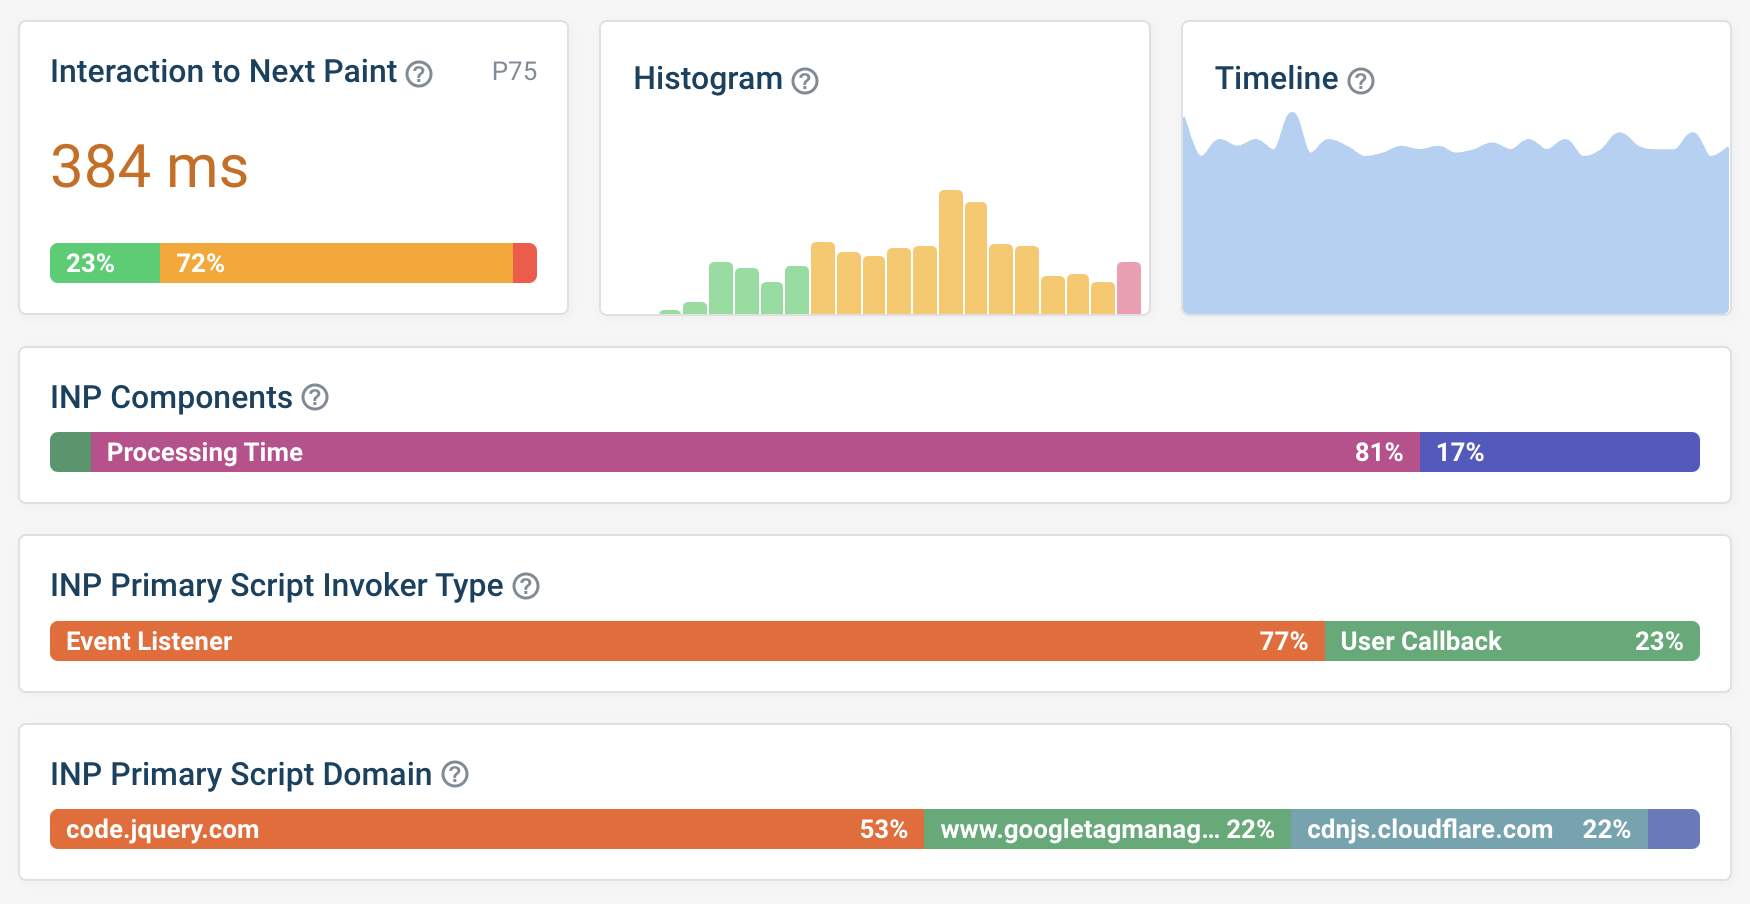
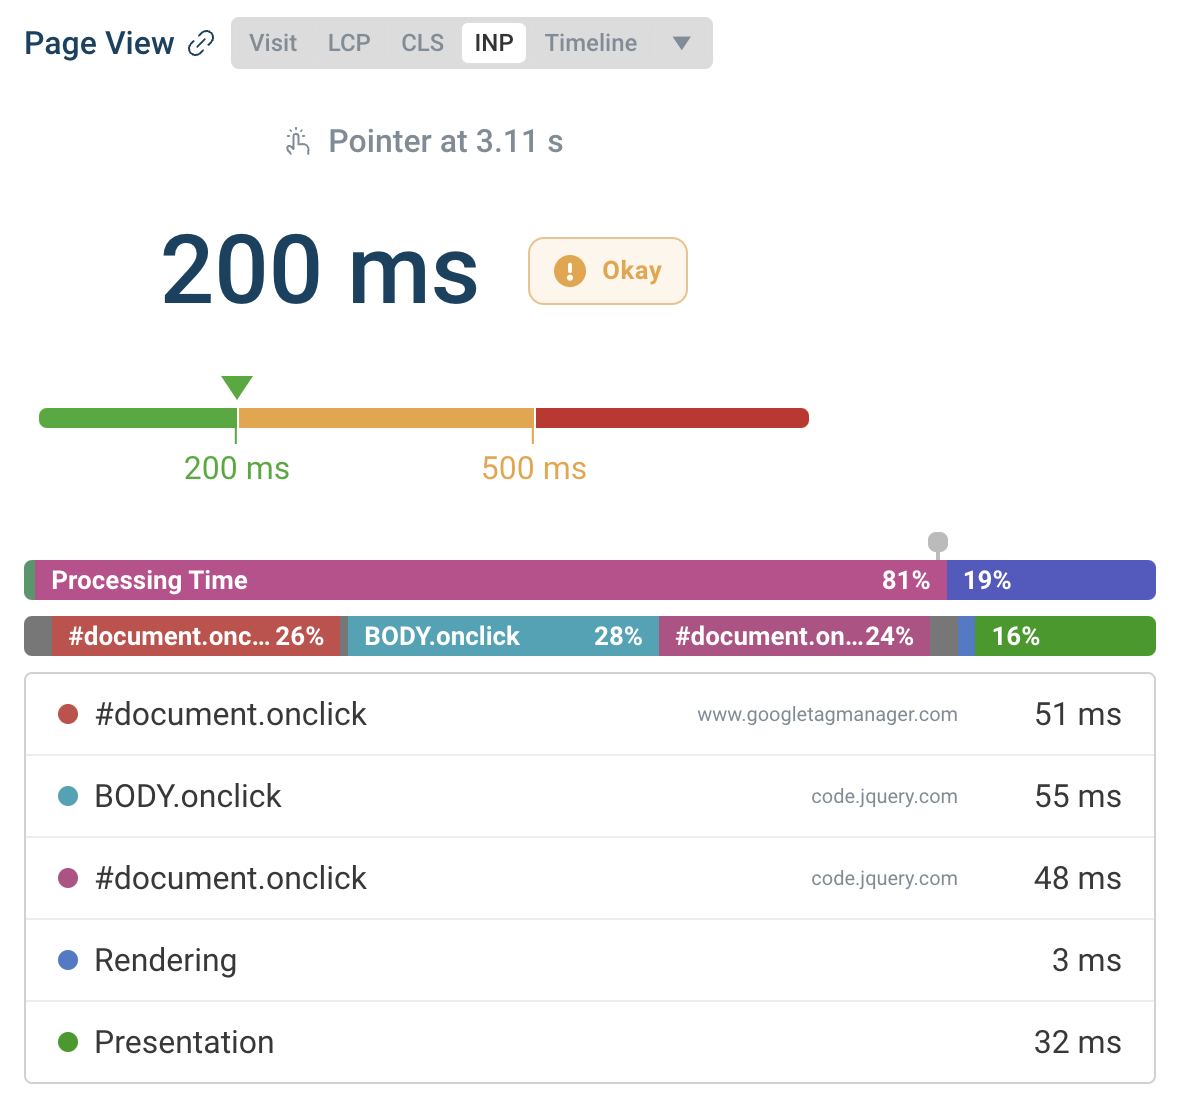
On the Interaction to Next Paint metric dashboard you can see what types of interaction delays happen on your website and what scripts are causing those delays.
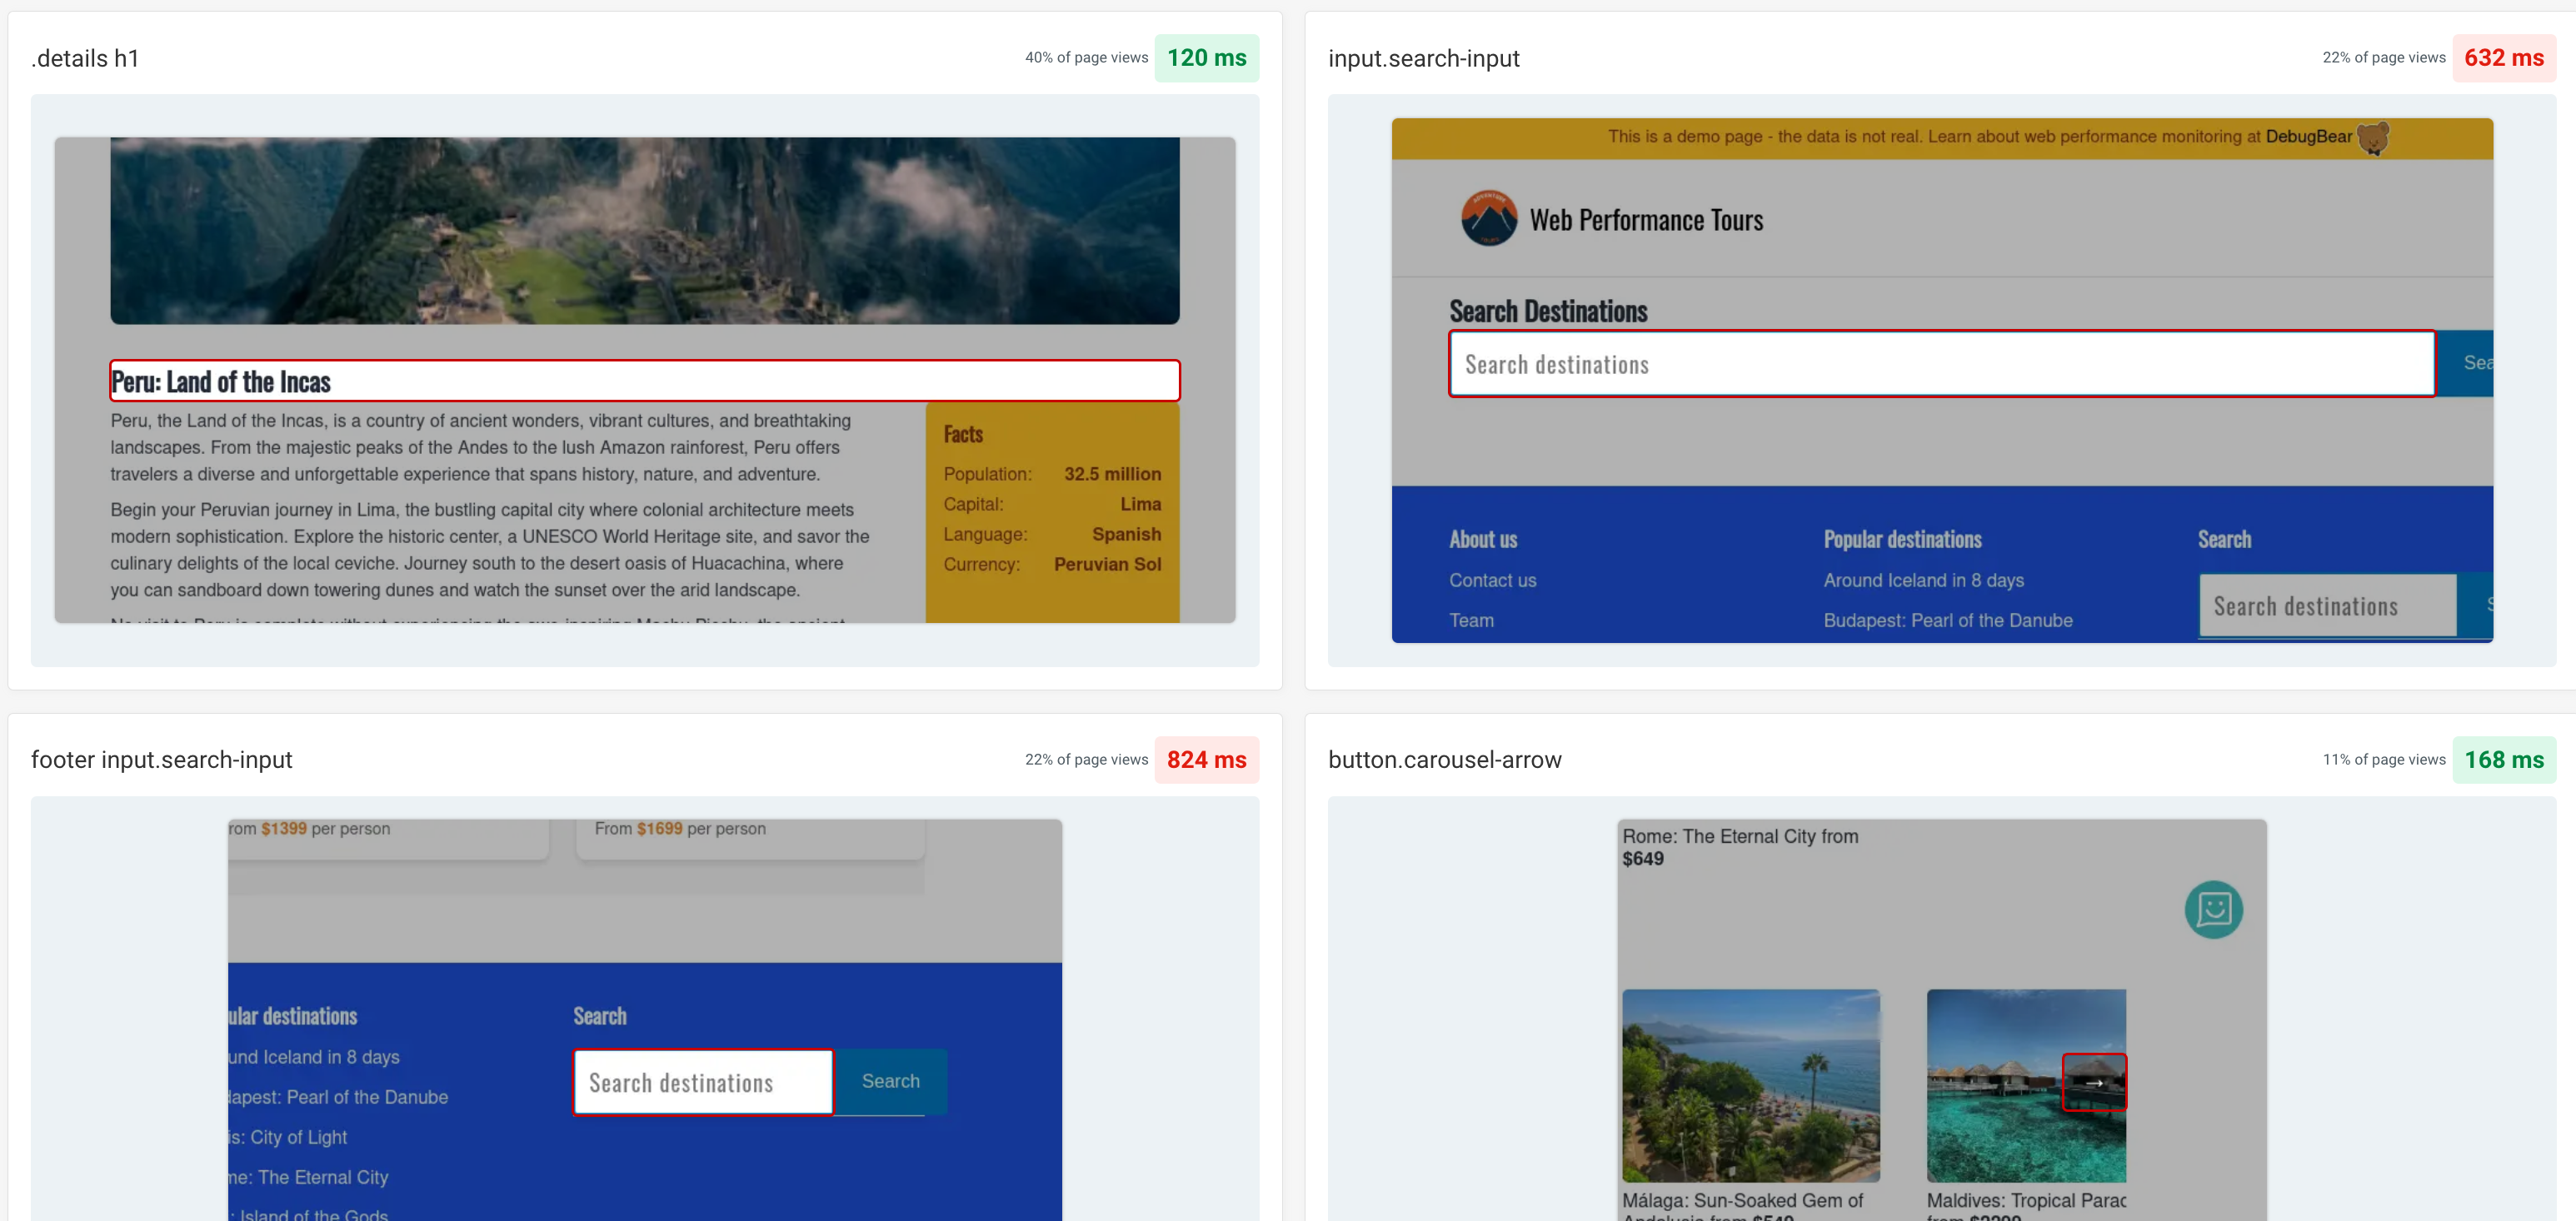
To debug INP it's also important to know what page interactions are slow. In the INP Elements dashboard you can see how often users interact with different elements and what the performance is for those interactions.
When looking at individual visits with slow interactions you can check:
- What page element the user interacted with
- What specific scripts ran during the page elements
- Why those scripts were running
Cons
- Mainly focussed on frontend performance
Pricing
- Free trial is available - 14 days, no credit card required
- Price with real user monitoring costs $200 USD per month (Startup plan + RUM addon)
- Real user monitoring included in cheapest plan is 500,000 page views per month
SpeedCurve
SpeedCurve monitors website performance through real user monitoring (RUM), helping to identify and fix speed issues that affect user experience.
Key Features
- Tracks 100+ performance metrics including Core Web Vitals, Lighthouse scores, and custom metrics
- Provides competitor benchmarking capabilities
- Integrates with CI/CD workflows through API and performance budgets
- Offers real-time alerts for performance threshold violations
Pros
- Easy to understand visualizations and charts, all in a clear user interface
- Compare performance between your website changes, with their Deployments integration
- Includes a Lighthouse report
Real user monitoring visualization of page views for a monitored site within SpeedCurve:
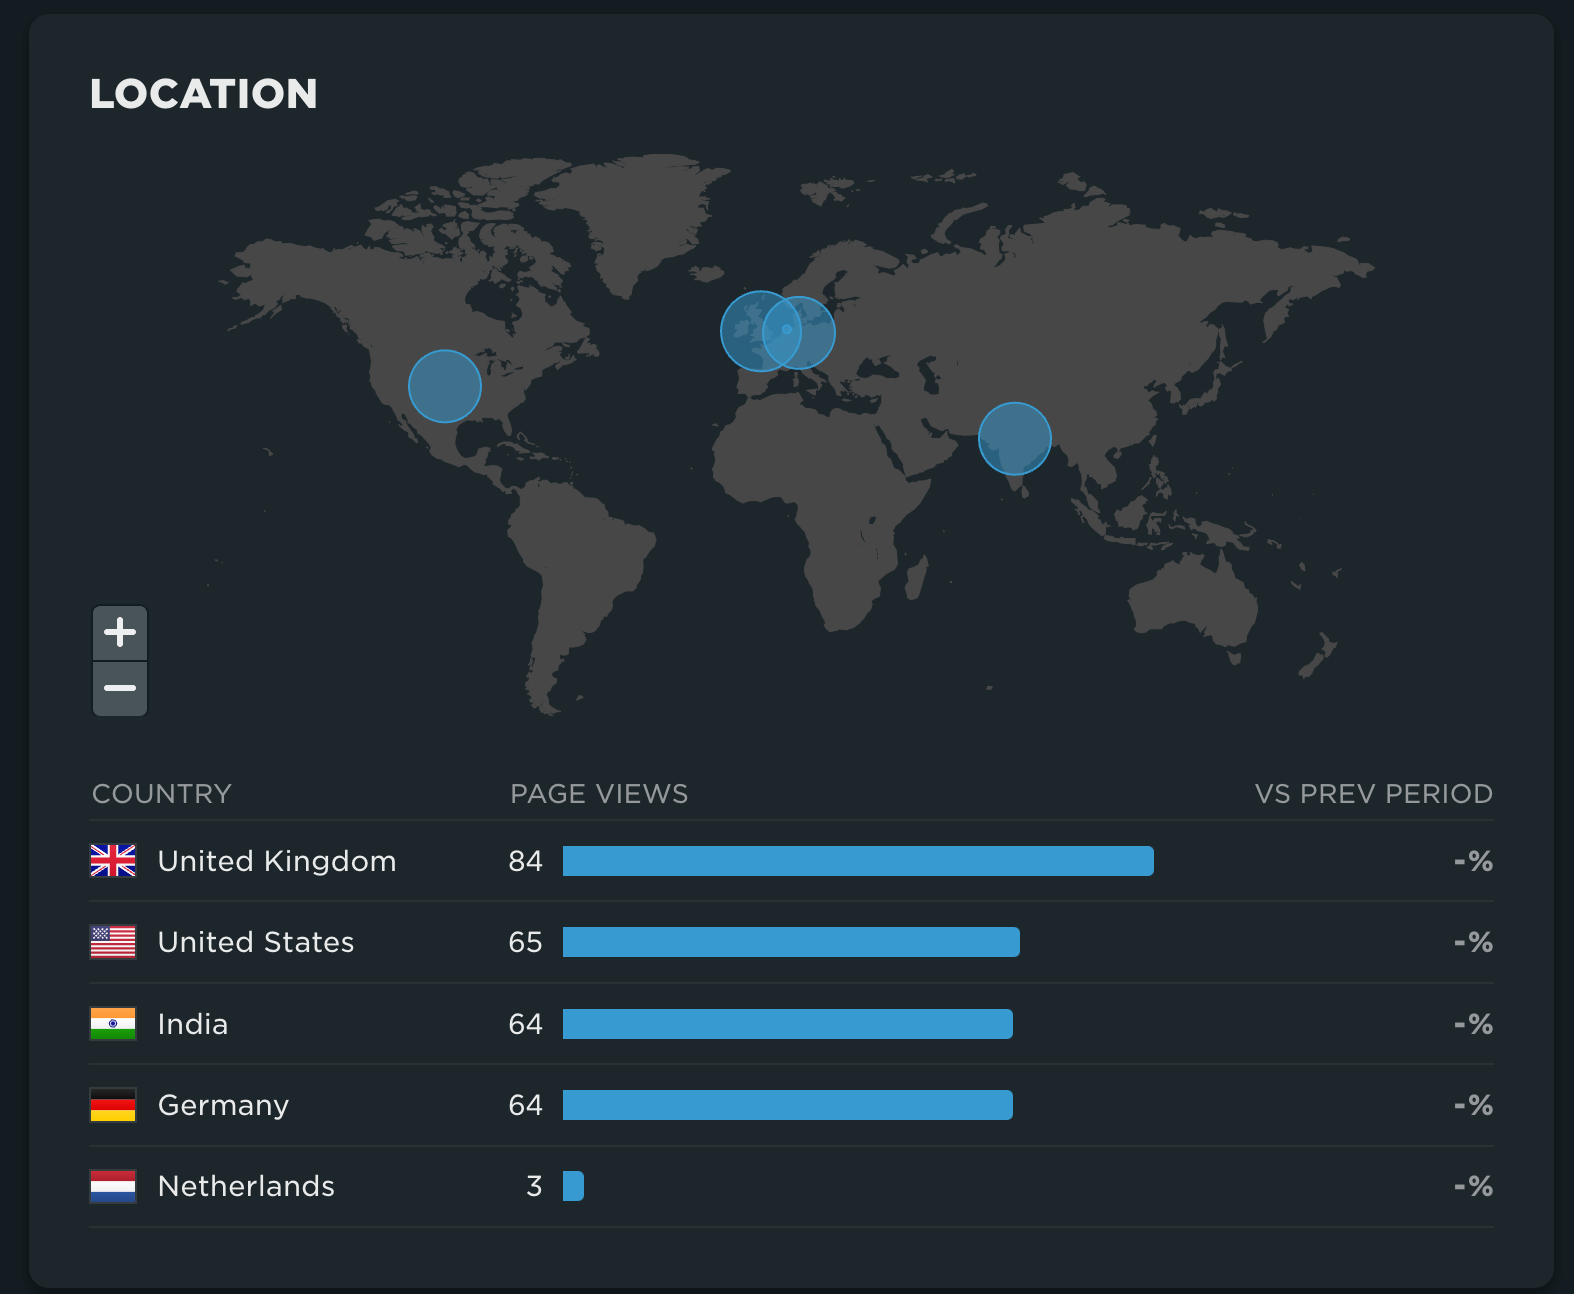
While the available data is sometimes presented in its raw form, you at least have access to the underlying performance data to understand why a metric may be poor performing.

Cons
- Lack of detail in performance metrics making it difficult to track down the root cause of performance issues
- Limited functionality coupled with a simplistic interface
Pricing
- Free trial is available
- Price with real user monitoring costs $83 USD per month
- Real user monitoring included in cheapest plan is 500,000 page views per month
- RUM costs $68/month for 0.5M page views
Datadog
Datadog RUM and synthetic monitoring service that can track and analyze how users interact with web applications in real-time.
Key Features
- Monitors core web vitals and load times across web applications
- Tracks user sessions with replay capability and error tracking
- Collects custom metrics and user behavioral data
- Correlates frontend issues with backend traces and logs
Pros
- Watch video recordings of the web browsing experience of your users
- Comprehensive set of monitoring features within the Datadog ecosystem
- Helpful tool to record website interactions that you want tested on a regular basis
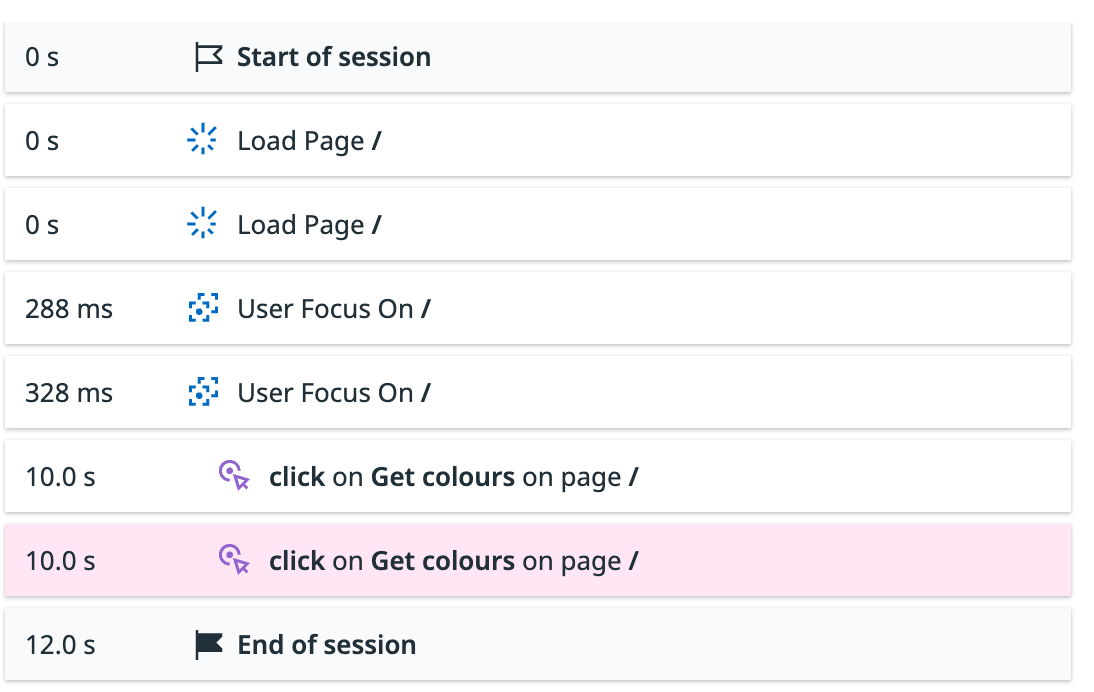
Real user monitoring within Datadog shows the exact steps a user took in their session:
Real user monitoring captures the largest contentful paint metric over time. LCP is a Core Web Vitals metric.

Cons
- Setup can be confusing as you are requested to install their software (“agent”) to track data during onboarding
Pricing
- Free trial is available
- Price with real user monitoring is $2.20 USD per 1000 sessions per month
- Real user monitoring included in cheapest plan is 1000 sessions per month
Pingdom
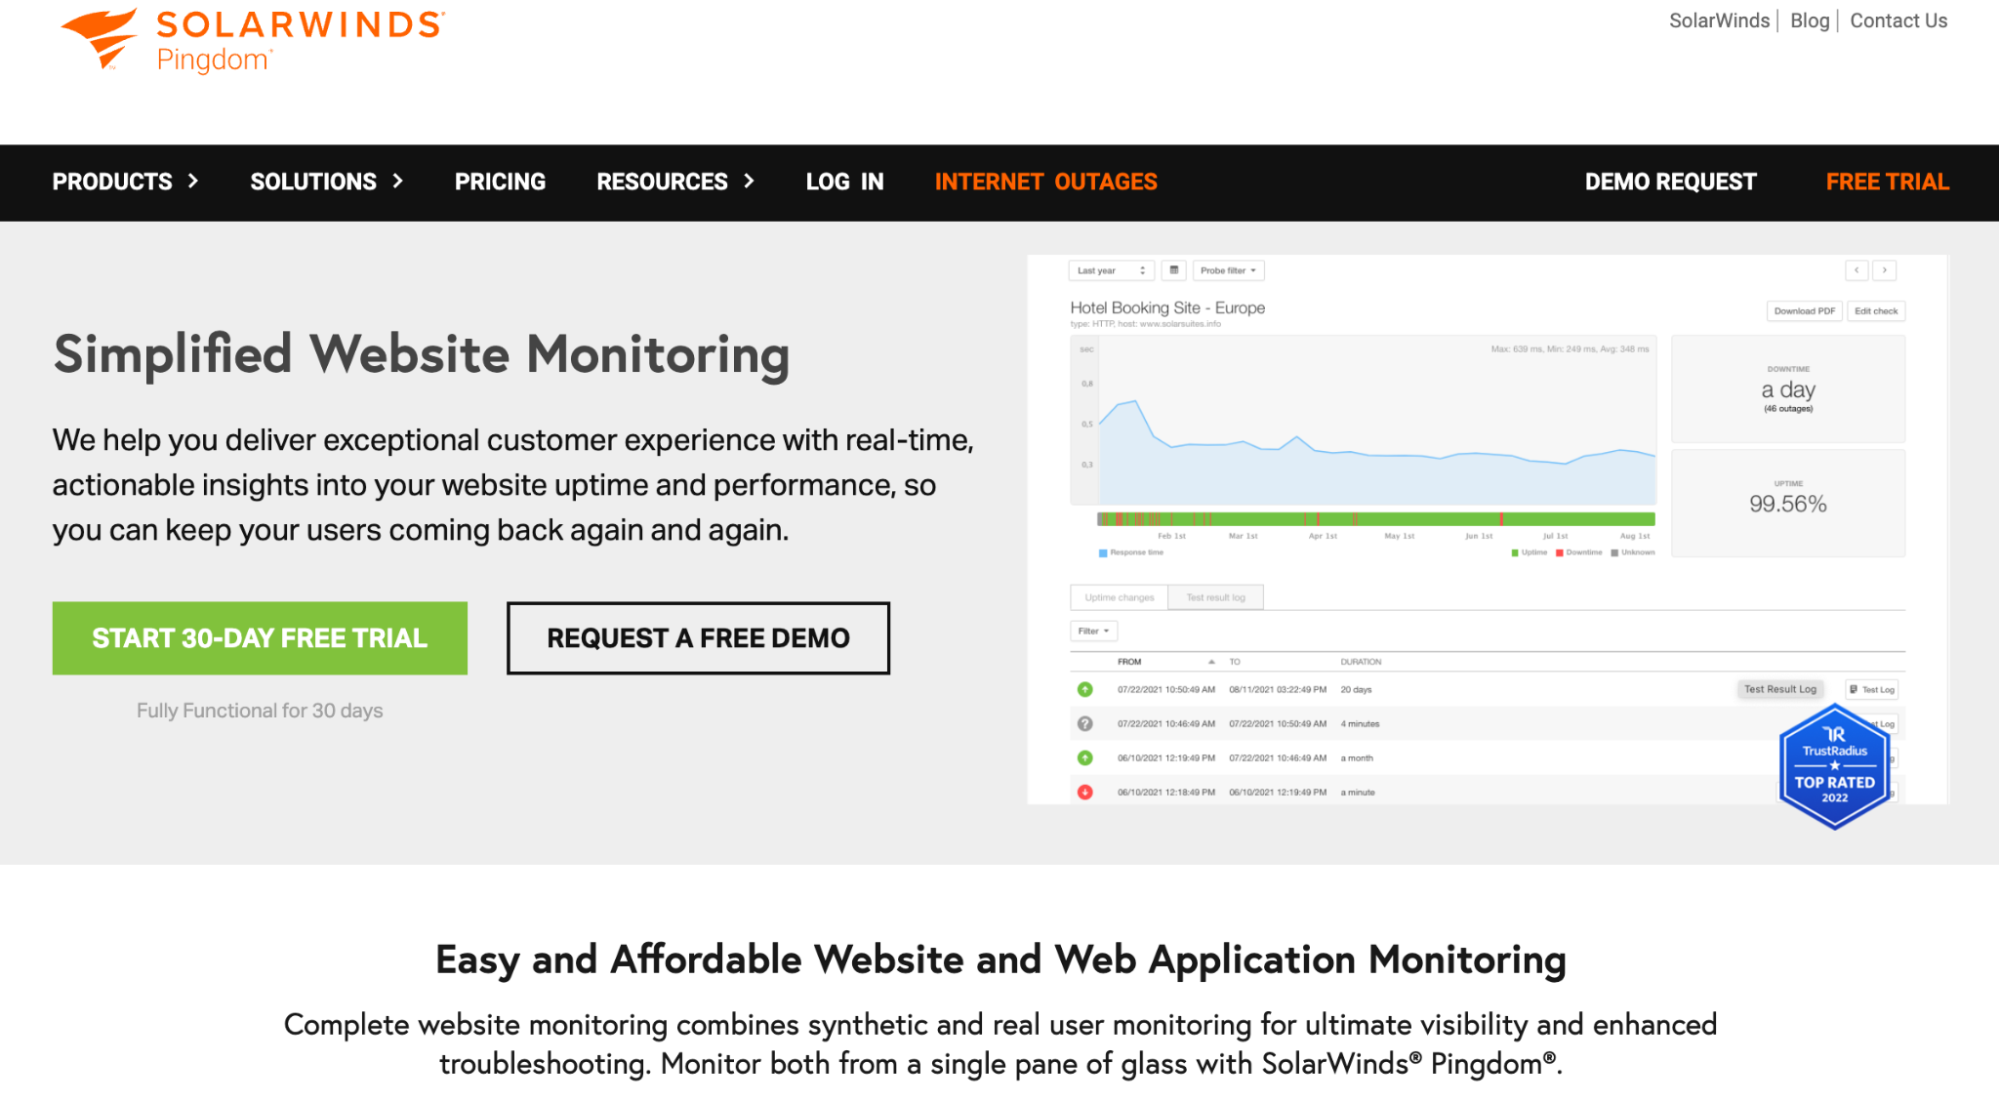
Pingdom is a website monitoring service that includes a real user monitoring offering that tracks end-user interactions and performance metrics on websites, priced starting at $10 per month.
Key Features
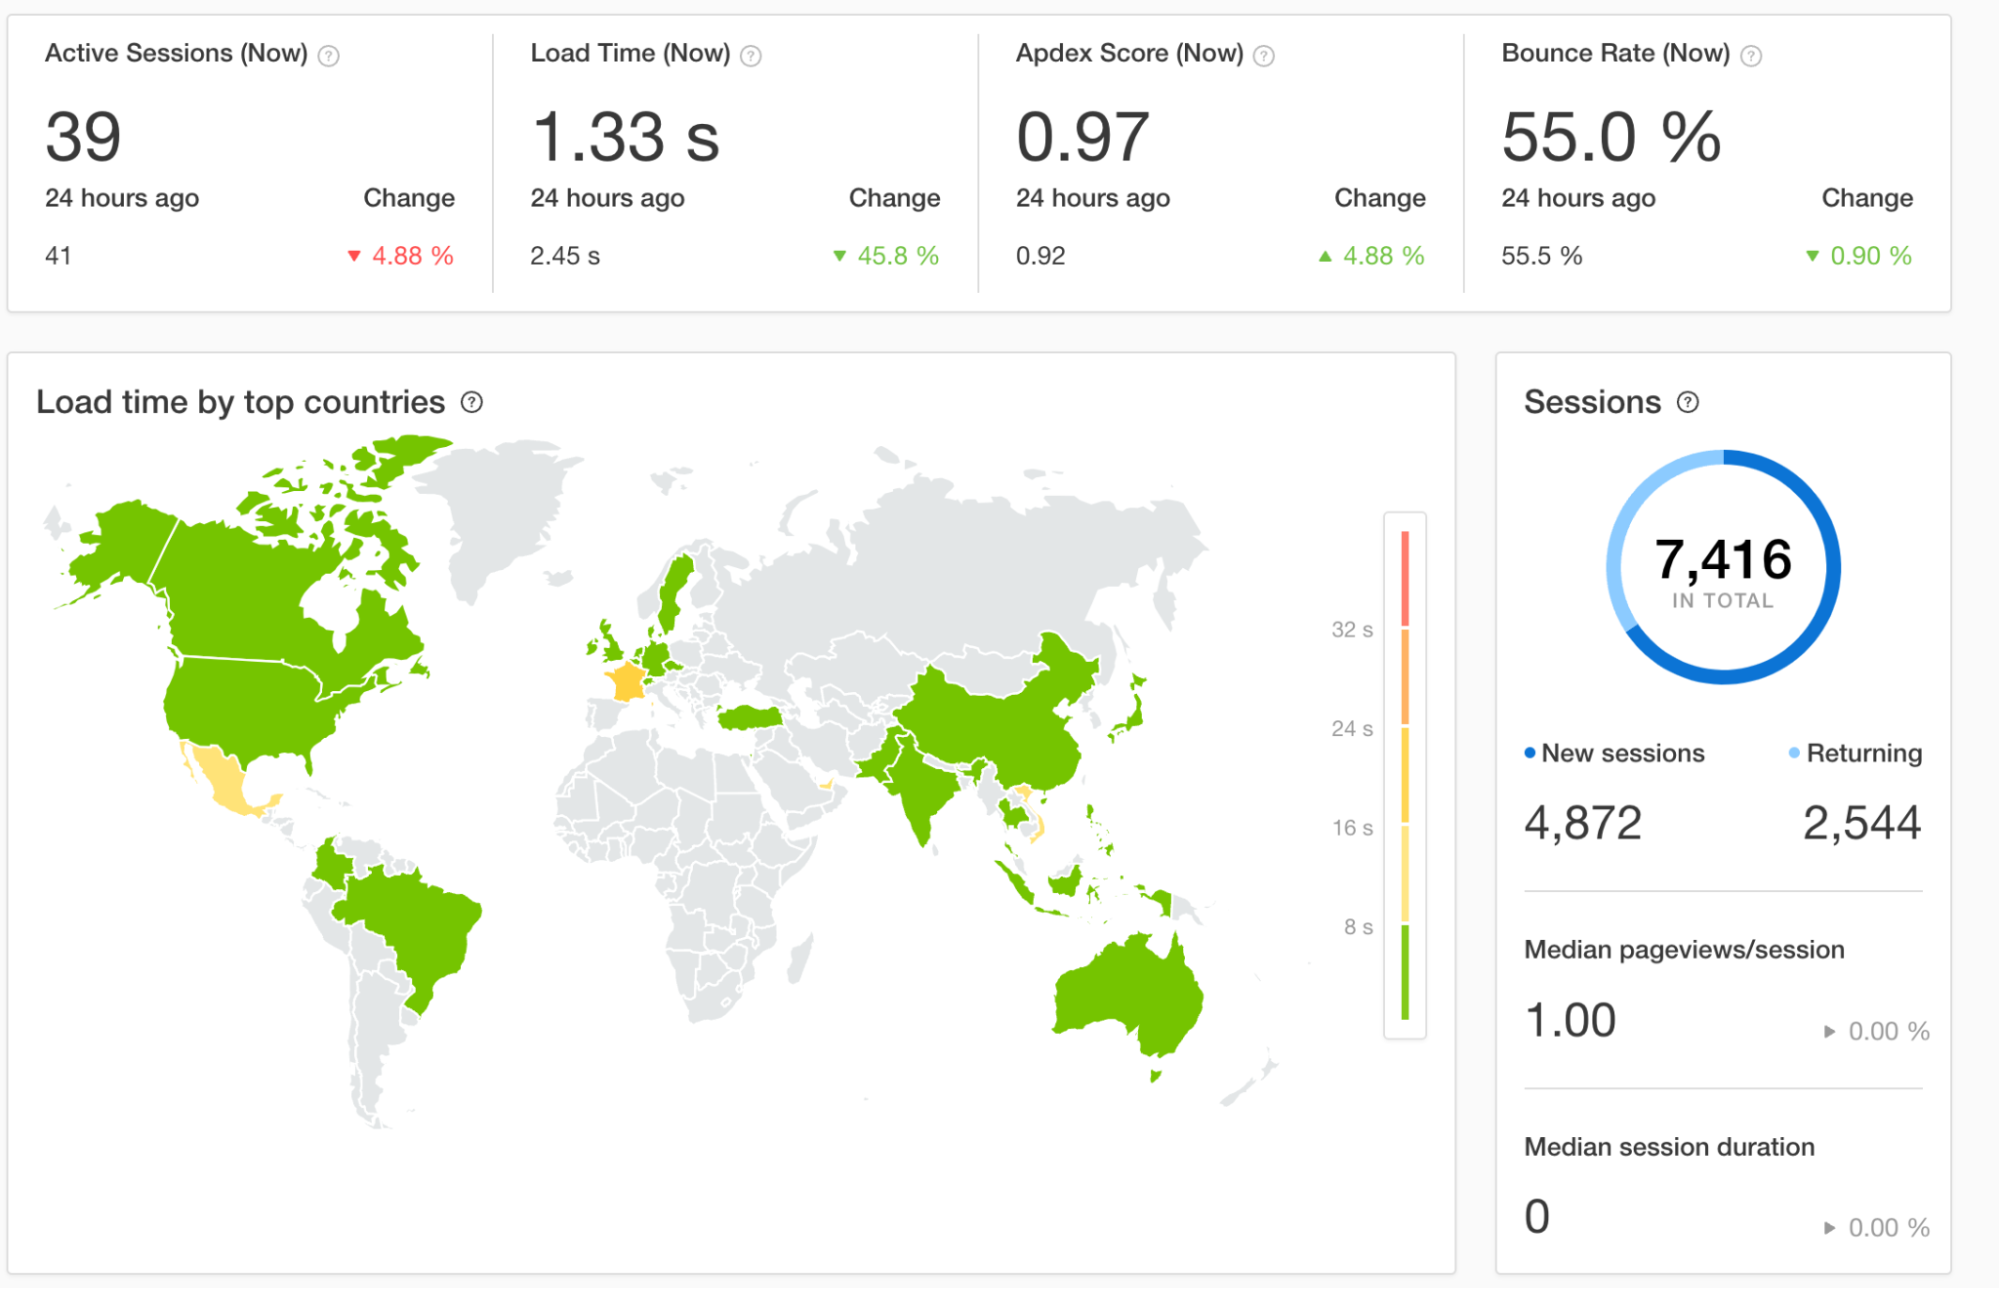
- Geographic tracking of user activity with live mapping
- Performance metrics including load time, time to first byte, and Apdex score
- Browser, device, and platform-specific analytics
- Customizable performance threshold alerts
- Historical trend analysis and comparison
- Deployment via single code snippet
Pros
- Offers an interaction recorder to capture interactions, and then run those recordings as tests
- Offers a built-in Uptime status page that you can share with users
- Simple integration between their Appoptics which also offers infrastructure metrics and code level visibility
Real user monitoring dashboard
Cons
- Limited web performance monitoring data available
- For the performance metrics which are available, there’s limited breakdown making it hard to debug performance regressions
Pricing
- Free trial is available
- Price for just real user monitoring is $10 USD per month (when paid annually)
- Real user monitoring limits on the cheapest plan = 100,000 page views per month
New Relic
New Relic is a suite of monitoring tools, including a synthetic monitoring service and a real user monitoring service that tracks and analyzes web application performance from the end-user's perspective through browser-side data collection.
Key Features
- Core web vitals tracking (LCP, INP, CLS) for SEO optimization
- Error rate monitoring with deployment correlation
- Geographic usage patterns and device-specific performance metrics
- Browser-specific performance tracking and troubleshooting
- Backend service connection through distributed tracing
- Real-time alerting for performance indicators
Pros
- Offers a comprehensive monitoring solution for your website and infrastructure
- Shows video recordings of user sessions so you can connect certain logs and performance milestones with what was happening on the page
- Useful as a general analytics platform, offering page view data with filtering capabilities
- Interesting “New Relic AI” feature where you can ask AI questions about the data you see on a dashboard
These Core Web Vitals metrics come from real users, as part of a Real User monitoring feature

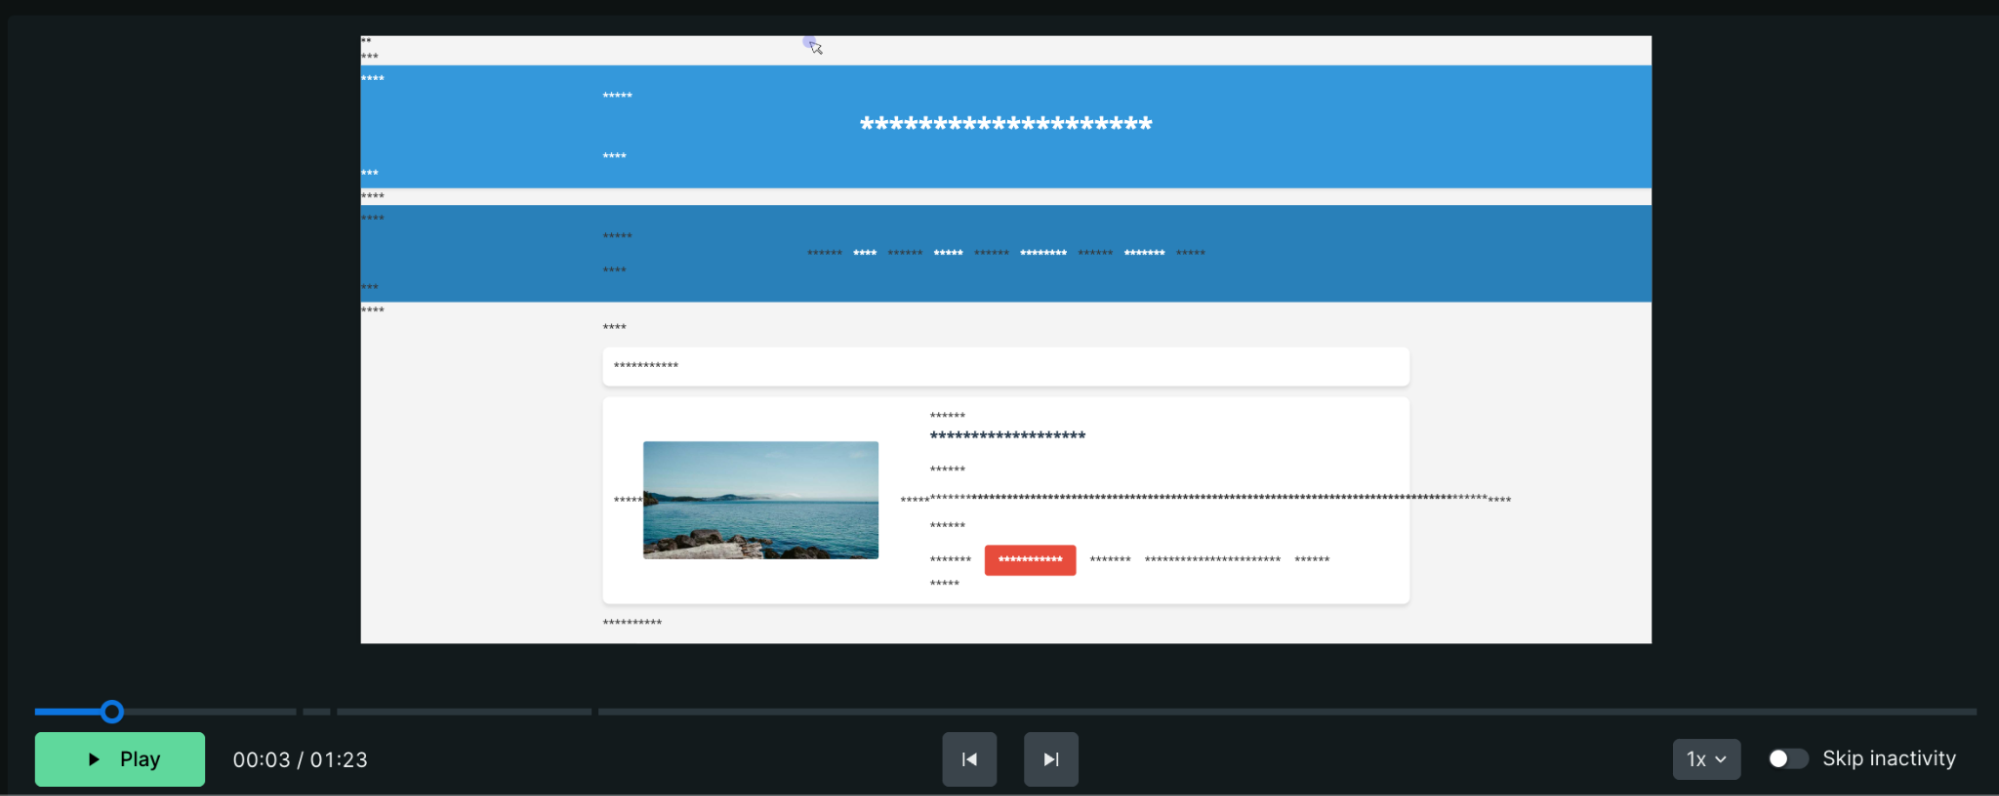
The real user monitoring feature saves users interactions to your dashboard, so you can watch them later to diagnose issues
Cons
- Doesn’t offer granular insights into certain data, such as Core Web Vitals
- Complex user interface can make it difficult to find the information you need
Pricing
- Free trial is available
- Pricing is based on usage
Request Metrics
Request Metrics is primarily a RUM service that tracks website performance metrics and Core Web Vitals to identify speed issues affecting actual users. It also has some synthetic monitoring capabilities.

Key Features
- Real-time performance monitoring of page loads and user interactions
- Automatic URL pattern detection and page grouping
- Resource waterfall analysis to identify slow-loading assets
- Core Web Vitals tracking for SEO optimization
- Third-party script impact analysis
- Regional performance tracking by country
- No-code trial option with performance scanning
Pros
- Useful features for debugging Core Web Vitals metrics, such as Interaction to Next Paint Analysis
- Powerful session explorer feature, showing the exact steps the user took in the website journey
- A simple and friendly dashboard interface for understanding your website performance metrics
The real user monitoring feature of Request Metrics captures user statistics of your users experience:

Lots of helpful metrics and data are captured from real user sessions:

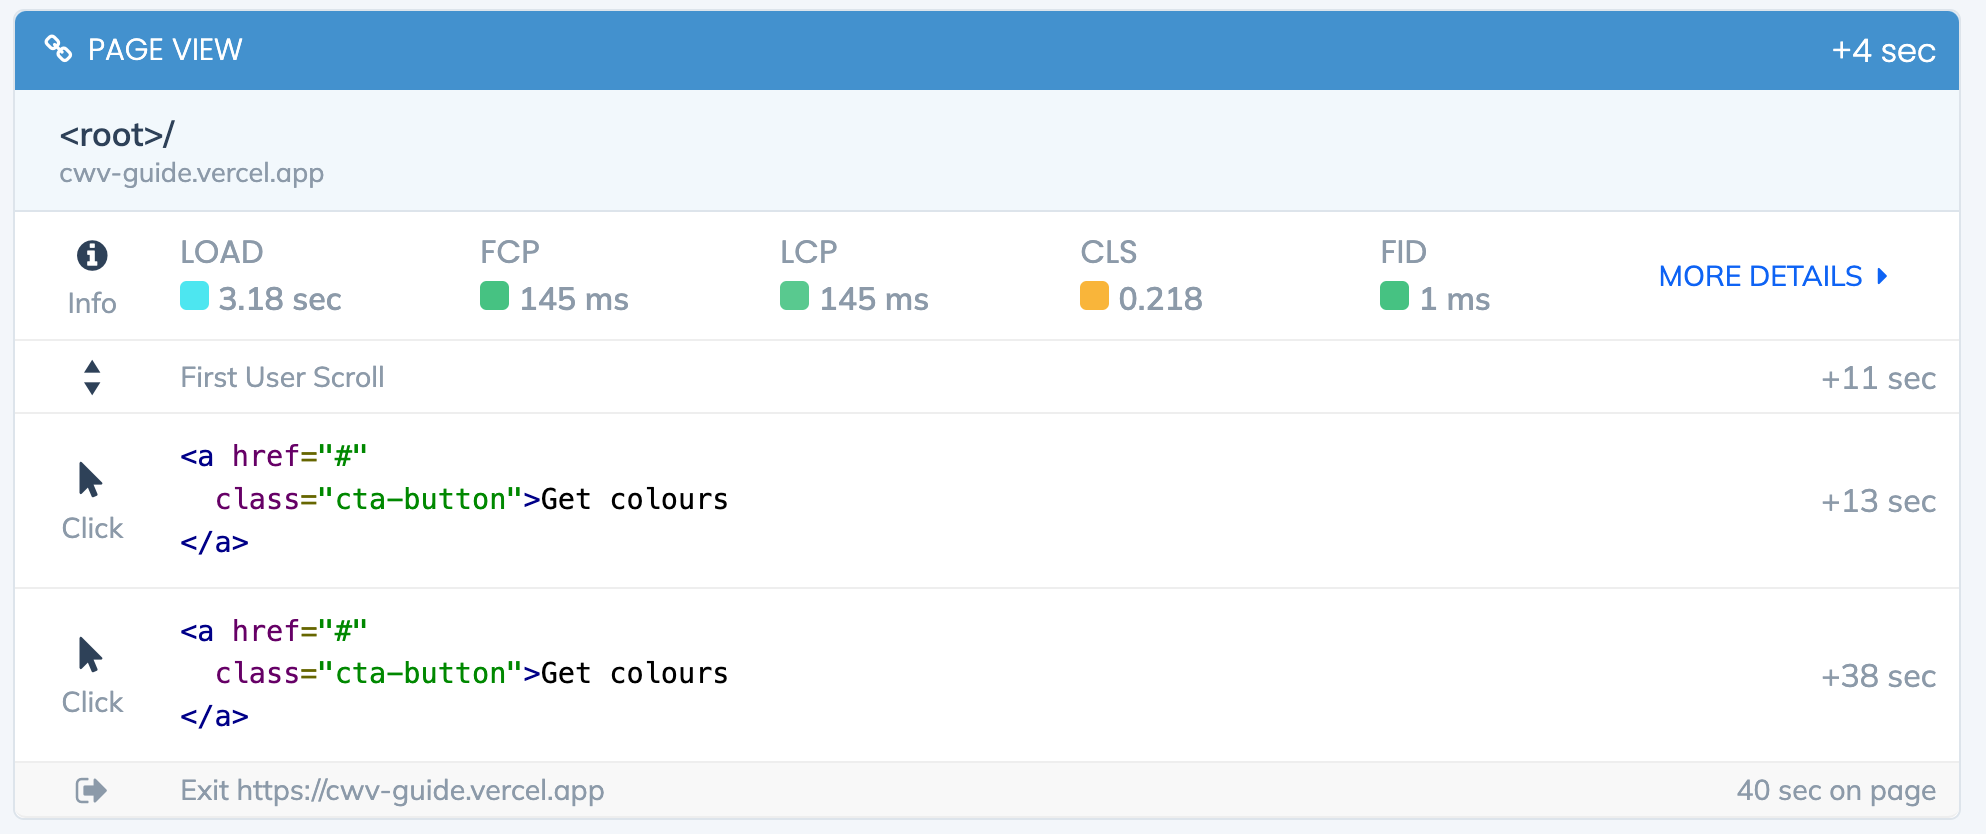
When monitoring real user interactions, snippets of code are shown for interaction elements:
Cons
- Many important features are locked behind certain pricing plans, and may require a subscription upgrade
Pricing
- Free trial is available
- Price with real user monitoring = $37 USD per month (Essentials plan)
- Real user monitoring limits on the cheapest plan = 75,000 page views per month (for up to 3 websites)
Solarwinds
SolarWinds Observability SaaS provides real-time monitoring of web application performance and user experience, combining website metrics with application performance monitoring.

Key Features
- Real-time tracking of page speed, uptime metrics, and user experience by region, device, and browser
- Integration with APM for combined client-side and server-side monitoring
- Performance analysis through customizable alerts and Apdex satisfaction ratings
- Root cause identification through transaction traces and database query analysis
- Single interface monitoring of end-user experience, application servers, infrastructure, and databases
Pros
- Offers useful transaction monitoring to help check user journeys are working as expected
- Offers a comprehensive monitoring ecosystem for logging throughout your application, infrastructure and database
- Includes many reporting and filtering capabilities, helping you to analyze data in a way that makes sense to you
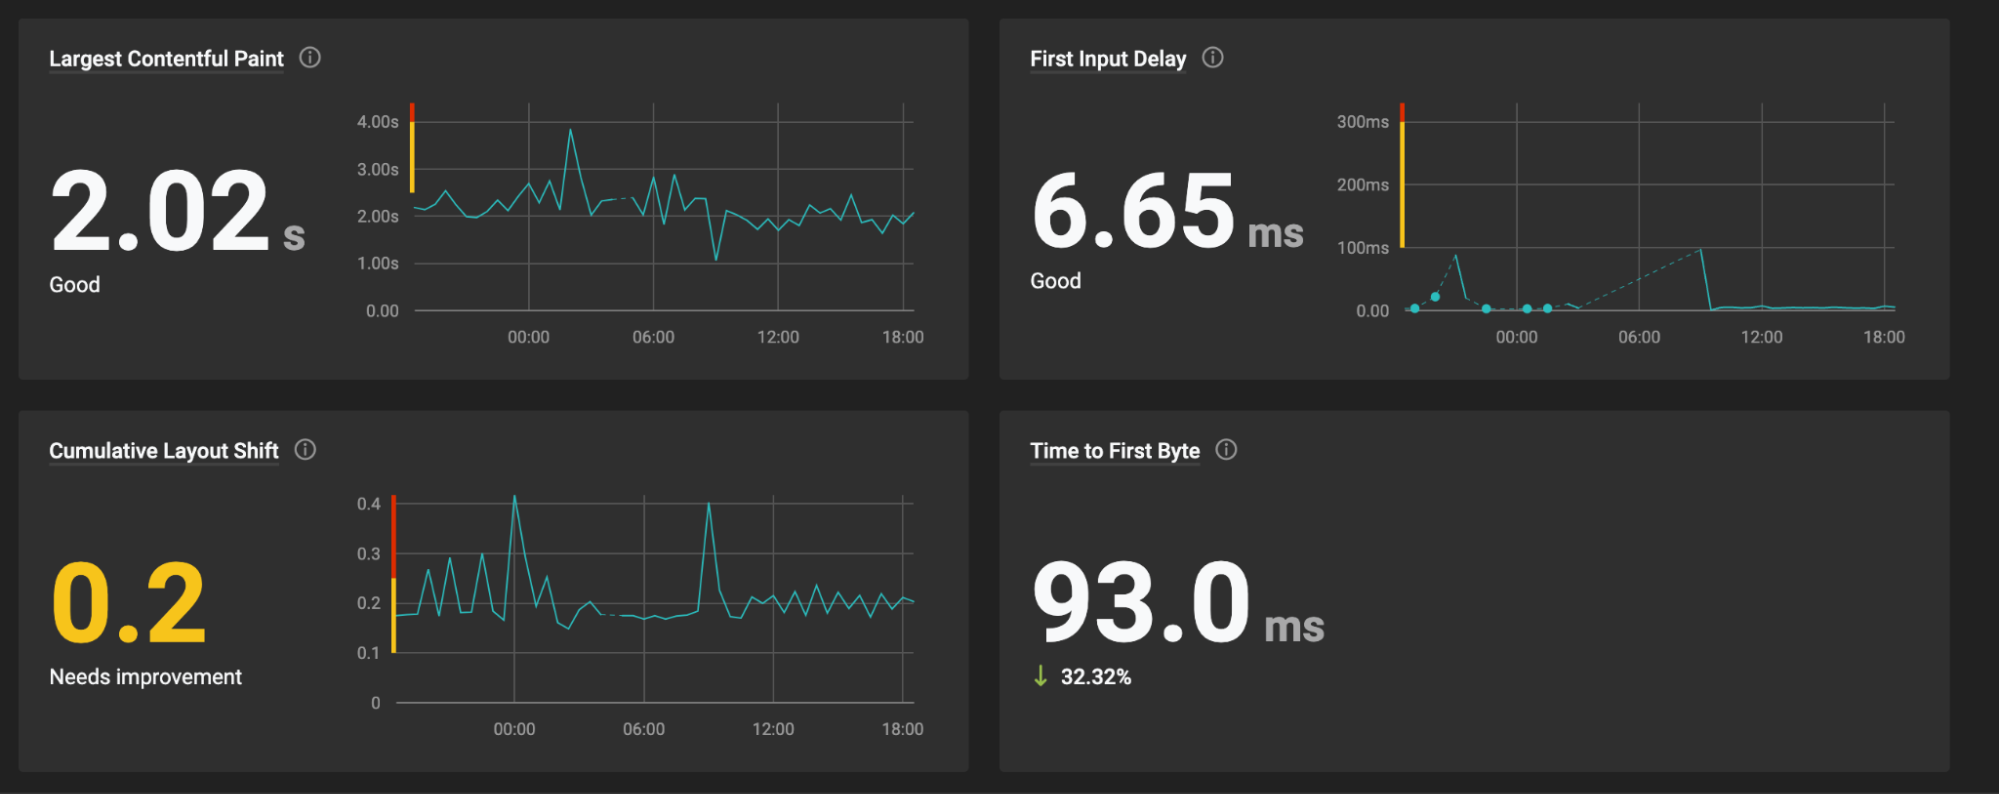
Web performance metrics coming from the Real User Monitoring feature.
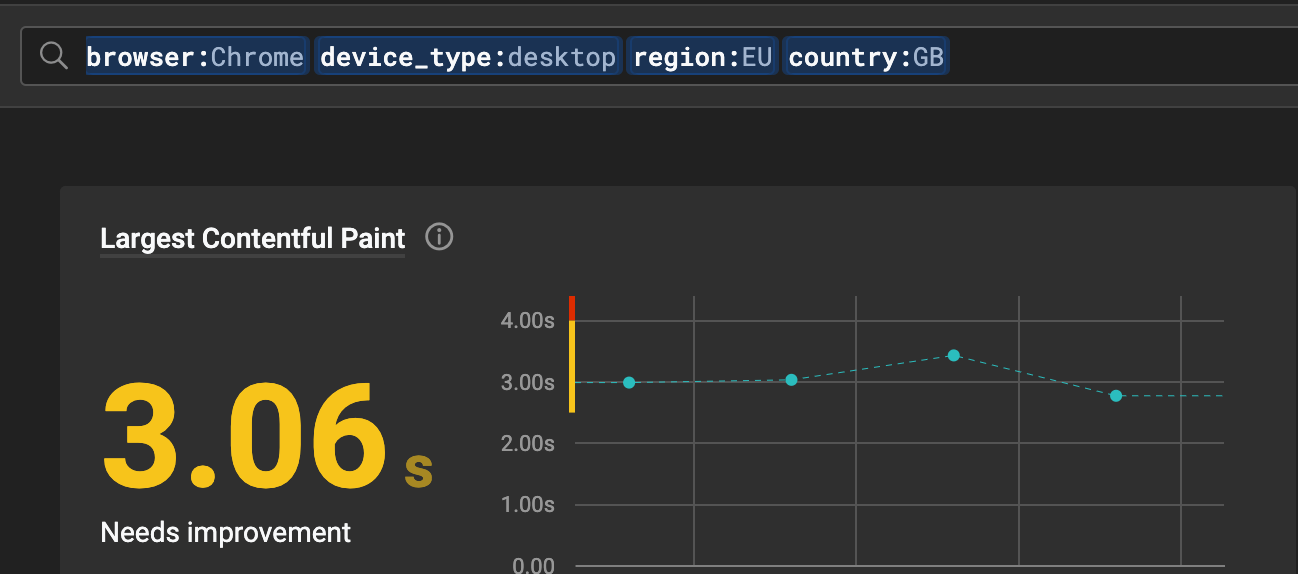
Applying filtering capabilities helps narrow down performance issues, for users in certain geographic areas for example.
Cons
- Complex user interface and dashboard can make finding certain information difficult
- Limited insight into performance metrics, making it difficult to diagnose problems and identify the root cause of issues
- Interaction to Next Paint, a Core Web Vitals metric, is unavailable
Pricing
- Free trial is available
- Price for just real user monitoring is $10 USD per month (when paid annually)
- Real user monitoring limits on the cheapest plan = 100,000 page views per month
Atatus
A monitoring solution that tracks end-user experience and frontend performance metrics for web applications in real-time.
Key Features
- Web vitals monitoring (FID, LCP, FCP, INP, TTFB, CLS)
- Page load performance tracking with resource waterfall analysis
- Single page application (SPA) route change monitoring
- AJAX performance tracking
- JavaScript error detection and diagnosis
- User session replay and journey mapping
- Deployment impact measurement
Pros
- Useful analytics dashboards to help you understand overall website usage
- Includes a deployment tracking feature to link code changes to regressions
- Good breakdown of network related statistics
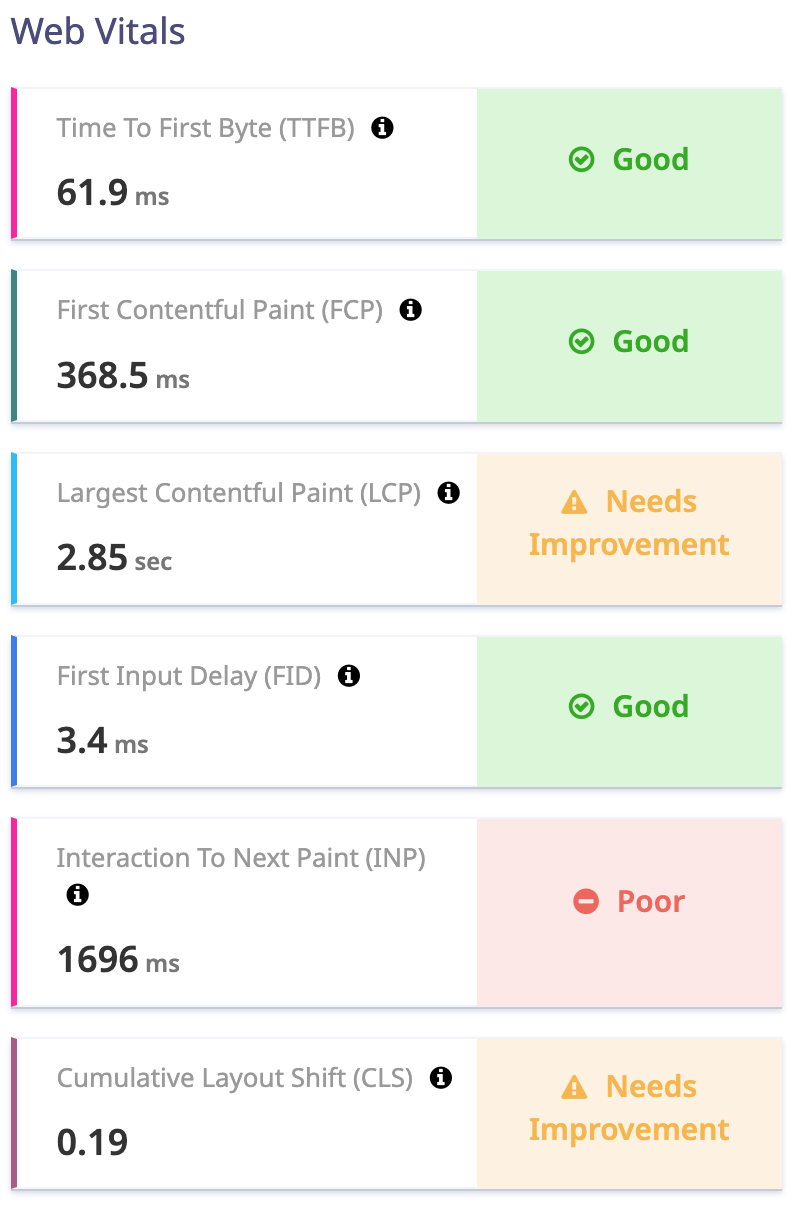
Where available and applicable, the Real User Monitoring feature logs useful performance metrics for individual user sessions.
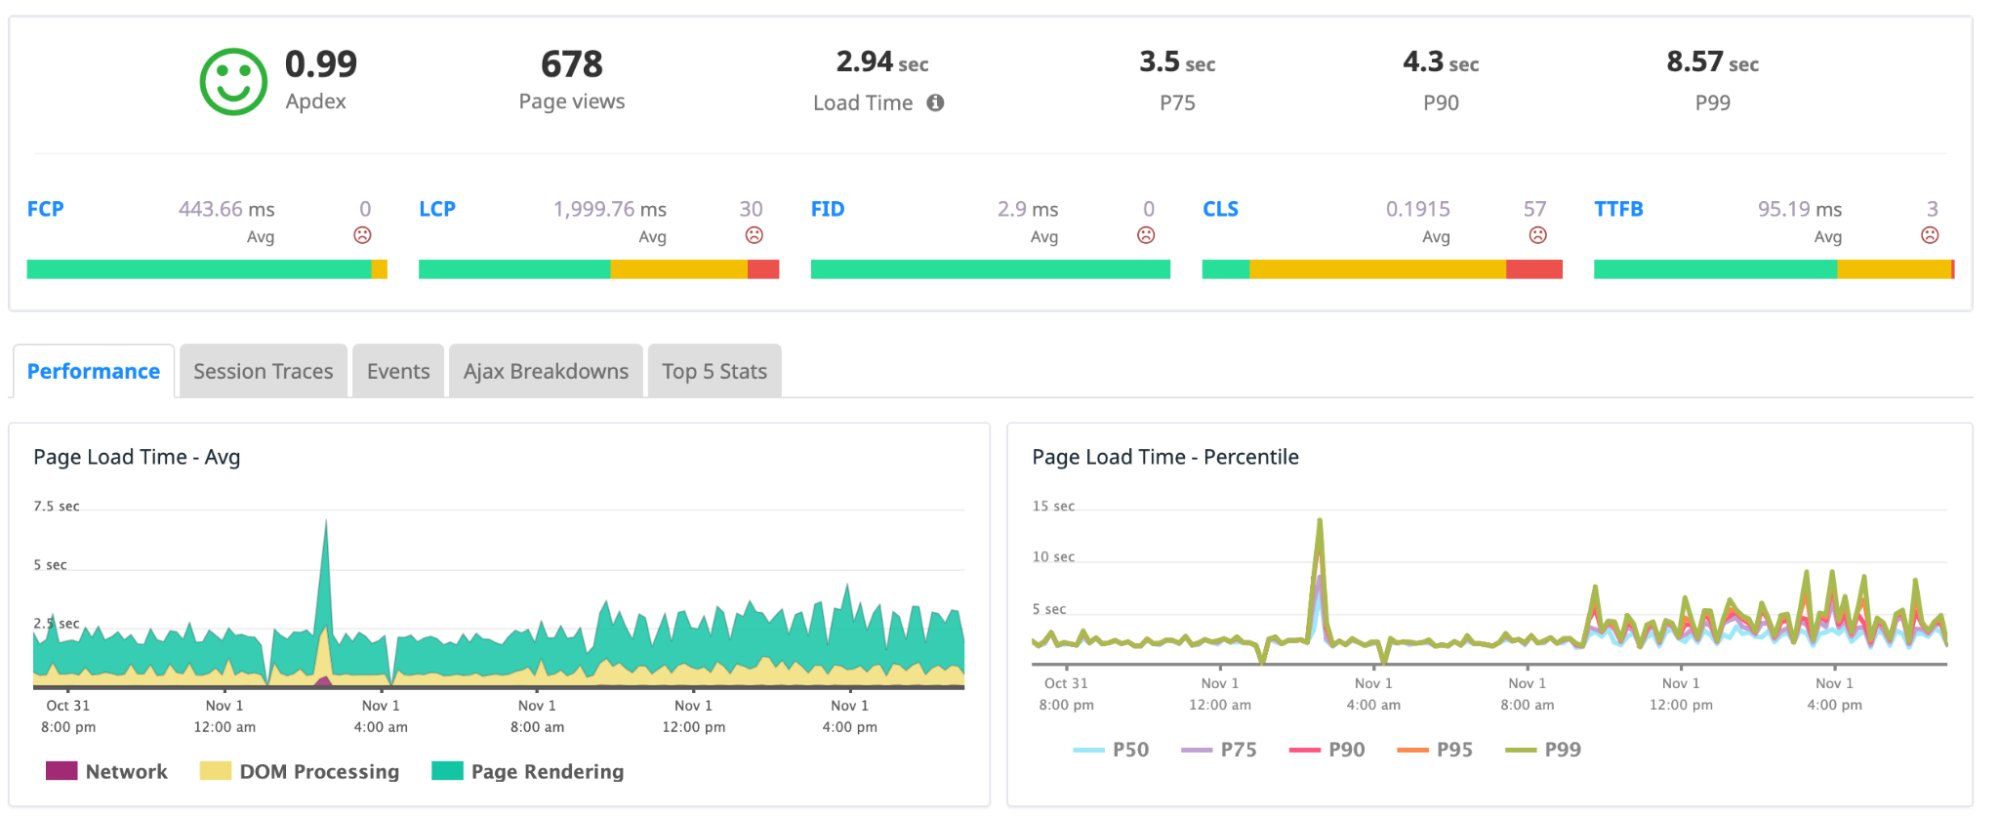
You can also view percentiles for combined real user visits.
Cons
- Little detail for certain performance metrics, like Core Web Vitals, making it difficult to investigate and diagnose poor performance scores
Pricing
- Free trial is available (14 days)
- Price for real user monitoring is $2.60 USD per month
- Real user monitoring limits on the cheapest plan is 10,000 page views per month
Sentry
Sentry is an error tracking and real user monitoring service that helps developers identify and fix performance issues in web applications by tracking user experience metrics and tracing slow requests.
Key Features:
- Tracks web vitals and browser performance metrics
- Traces frontend performance issues to backend calls
- Provides performance insights based on actual user impact
- Integrates error tracking with performance monitoring
- Supports Next.js and other web frameworks
- Alerts developers to latency issues affecting users
Pros
- A well known developer tool in the monitoring space
- Offers powerful error and performance tracking functionality, on both the frontend and backend of your web application
- Displays video recordings of user sessions which embed performance milestones and web application errors so you can understand what the user was doing during a certain milestone
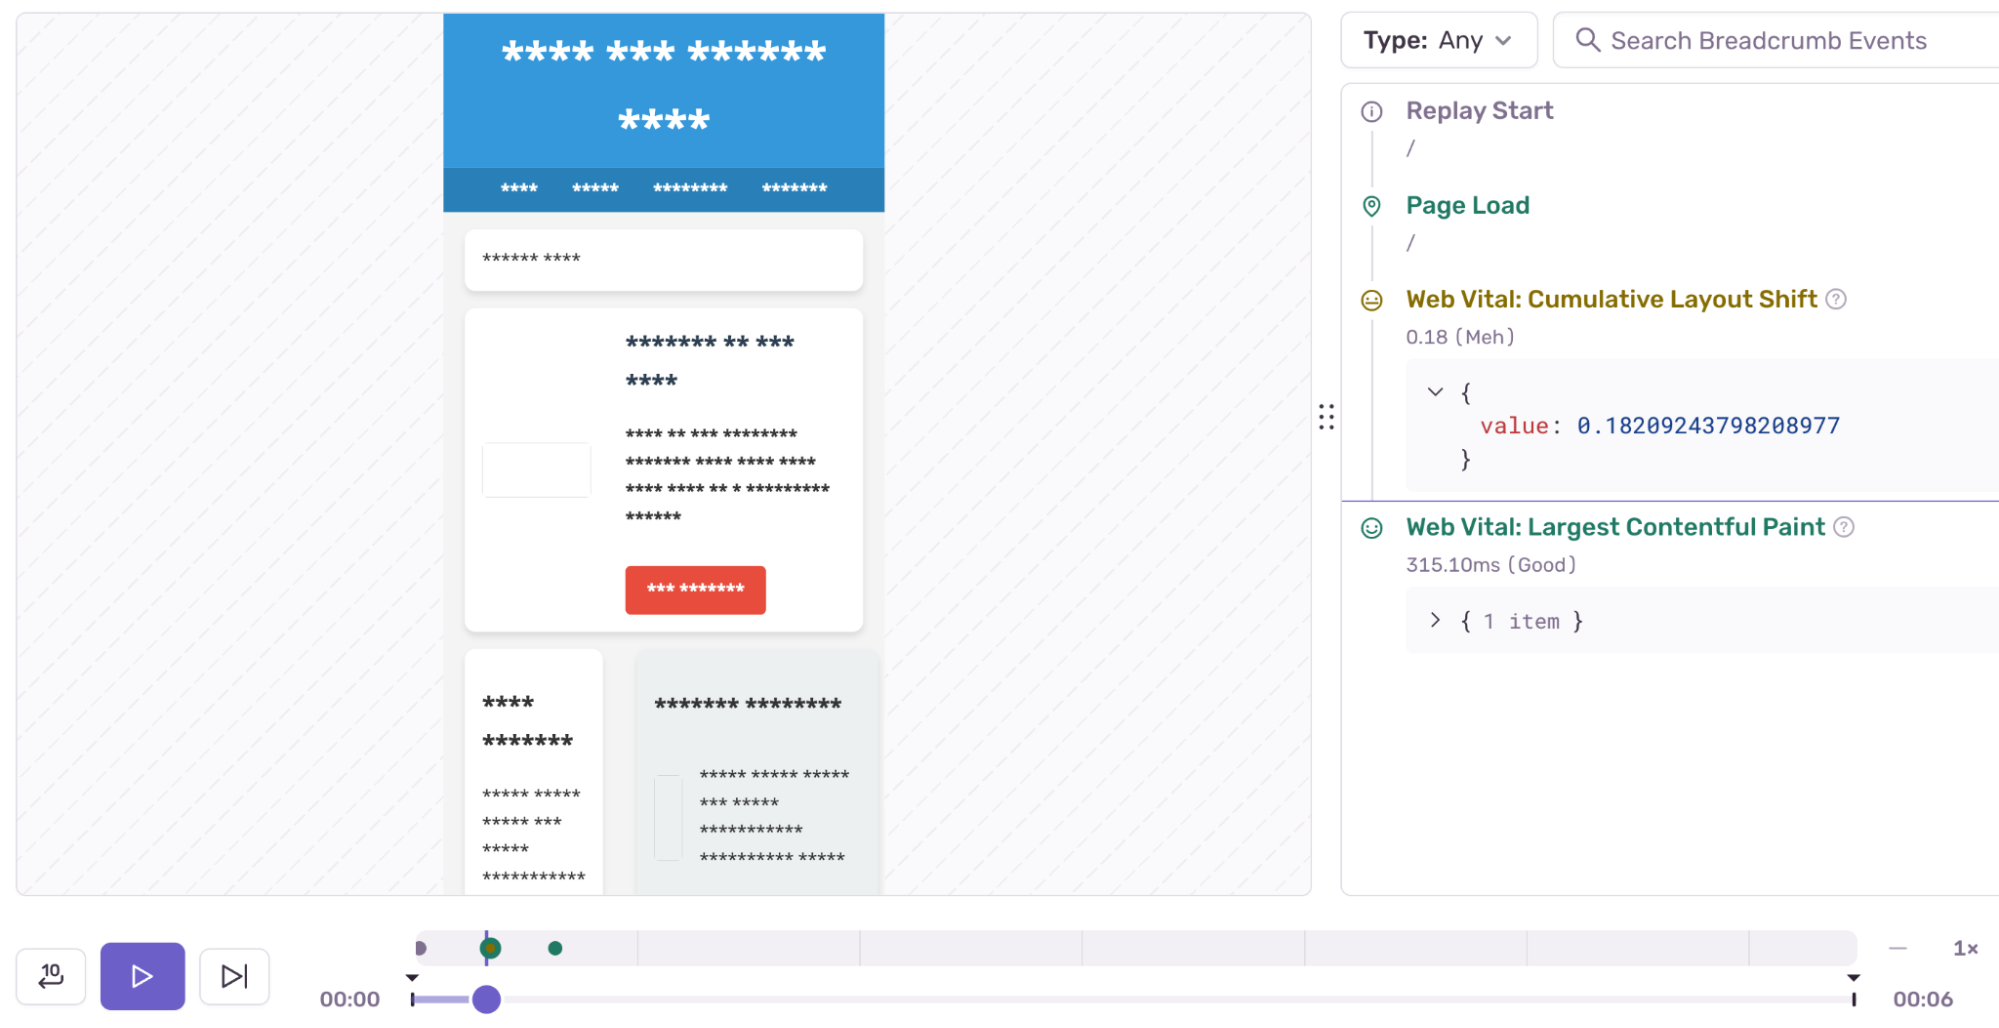
Sentry’s real user monitoring presents web performance data in their dashboard:

You can record user sessions with Sentry’s JavaScript code, and then watch those sessions in the Sentry dashboard.
Cons
- Web Vitals monitoring is locked behind a Business or Enterprise plan
Pricing
- Free trial is available
- Price for real user monitoring is $26 USD per month, or if you $89 for the business plan which includes Core Web Vitals monitoring
Raygun
Raygun Real User Monitoring is a front-end performance monitoring service that tracks and analyzes how users interact with websites and applications in real-time.

Key Features:
- Performance metrics tracking across DNS, latency, SSL, server, and transfer times
- Core Web Vitals monitoring with user segmentation by location, browser, and device
- Integration with error monitoring and crash reporting tools
- Support for JavaScript, Angular, Xamarin, React, iOS, and Android
- Individual user session tracking with page-level diagnostics
Pros
- Marks metrics with a helpful “user satisfaction” score
- Offers application monitoring, so you can log data from the frontend and backend of your application
- Lets you link commits and deployments on their dashboard so you can understand what changes caused regressions
You can get a high level overview of real user sessions on your website.
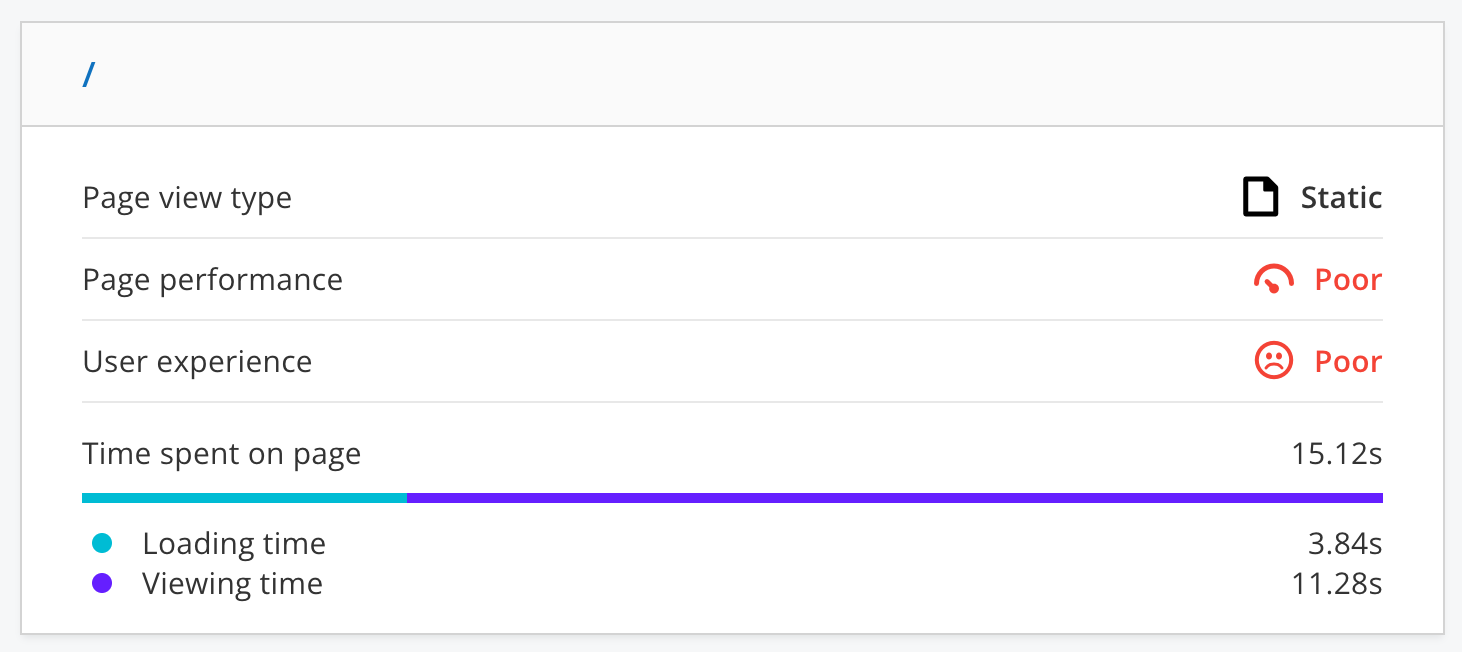
Raygun’s real user monitoring feature lets you dive into individual user sessions to understand exactly what their experience is like.

Cons
- Limited performance debugging capabilities, hard to diagnose the root cause of a poor performance metric
- Custom timings is locked behind the team or business plans
Pricing
- Free trial is available (14 days)
- Price with real user monitoring = $120 USD per month
- Real user monitoring limits on the cheapest plan is 100,000 page views per month
How to choose a real user monitoring tool
When choosing a real user website monitoring service there are a few factors to consider:
- Core Web Vitals support
- Ease of use
- Detailed page view data
- Support for business metrics
Core Web Vitals support
Does the tool support all three Core Web Vitals, including Google's new Interaction to Next Paint metric? What debug data is provided to analyze these user experience and optimize the web vitals metrics?
Ease of use
Real user data is often complex and hard to analyze. A good RUM tool will guide you through the data, point out problems on your website and help you identify what's causing them. That then puts you and your development team into a position where you can successfully improve your website speed.
Detailed page view data
Looking at an individual page view tells you how one real person experienced your website. While aggregated data is often difficult to interpret, data for individual visits is much simpler.
But can you actually understand why someone had the experience they had? With detailed RUM data you can see exactly what happened when someone visited your website and how their device and network speed impacted their experience. You can also use technical reporting like timelines and request waterfalls to find out what you need to do to make your website faster.
Support for business metrics
RUM tools report a wide range of metrics. Some are purely technical, some provide insight on user experience, and others can tell you how your website performance is impacting your business. For example, you can track bounce rates or conversions.
Get started with real user monitoring for your website
There are lots of monitoring tools out there. Most of them offer a free trial, so you can see how well they work for your use case.
Ready to get started? Sign up for DebugBear to get a detailed analysis of your website and see how fast it is for real users.


Monitor Page Speed & Core Web Vitals
DebugBear monitoring includes:
- In-depth Page Speed Reports
- Automated Recommendations
- Real User Analytics Data
