Frontend Performance Monitoring: The Complete Guide
Monitoring frontend performance is important to ensure your website is fast and reliable. Without it you might not notice issues impacting your website until your customers report them to you.
In this article we'll take a closer look at why you need to monitor frontend website performance and what you need to do to set it up.
What is frontend performance monitoring?
Frontend monitoring means continually measuring various aspects of website performance to ensure overall site health. For example, you want to check that your website loads quickly, handles user interactions well, and doesn't have any errors.
The frontend of a website is the part that a visitor experiences in the browser. It stands in contrast to the backend, which is where servers in a data center process incoming requests from the browser.
Monitoring frontend performance is usually the job of the frontend development team, as it's the developer's job to fix any issues that are discovered. But marketing or product people are often also involved in making sure that metrics stay in the green, that the website ranks well in search results, and that users are happy.
One part of monitoring is alerting: notifying team members when there's a problem with the website. This way issues can be fixed quickly before they negatively impact the business.
What is the difference between frontend and backend monitoring?
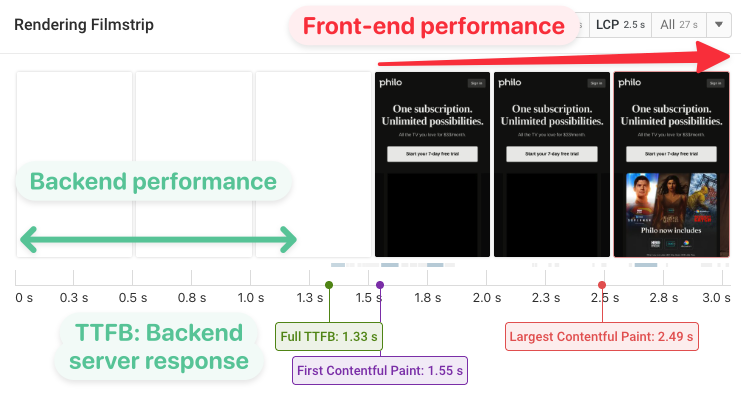
Frontend monitoring is about what happens in the user's browser. For example, it involves measuring how long a website takes to load and become useful for the visitor.
In contrast, backend performance monitoring focuses on what happens on the server. This is where data is stored and processed.
Backend performance impacts frontend performance, because browsers need to load data from the backend in order to display content.
While a fast backend is necessary for a fast frontend, it's not enough. Client-side performance factors like loading too much data or spending too much time on JavaScript processing can still slow down pages.
What are the different types of frontend monitoring?
You can monitor your website for several issues on the frontend, for example:
- Speed
- Errors and reliability
- Lighthouse scores
- Conversions
- Uptime
Speed is about loading your website quickly and making sure it responds quickly to user interactions.
Error monitoring means logging any errors that occur on your website so that they get fixed quickly and the website works reliably for the vast majority of users.
Lighthouse monitoring means tracking website quality scores for Performance as well as SEO and Accessibility. Google's Lighthouse tool reports these scores and can help you build an overall optimized website.
Conversion tracking lets you see whether visitors achieve the results that the business cares about. That could be trial signups or ecommerce purchases. You can also correlate conversions with performance metrics to see how visitor experience impacts conversion rates.
Uptime monitoring means checking your website can be reached by your visitors so that downtime can be minimized.
Read our article on different types of website monitoring to learn what else you can keep track of beyond the frontend.
Different types of page speed data
Website performance metrics can be collected in different ways:
- Synthetic monitoring: measuring page load time on a schedule and in a controlled lab environment
- Real user monitoring: using analytics to track how fast your website is for your actual visitors
- CrUX monitoring: track data from Google's Chrome User Experience report
Each type of monitoring has different advantages and you need to combine different data sources for a comprehensive view.
Real user data is great because it describes actual visitor experiences and lets you see how those vary by country or device type. In contrast, synthetic test results provide more in-depth reporting and automated recommendations for optimization.
Why is frontend performance important?
There are a lot of different priorities in every company, so why should you care about frontend performance? Here are a few advantages of an optimized website:
- Deliver a good user experience
- Convert more customers
- Rank higher in search results
Benefits of having frontend monitoring in place
Frontend monitoring provides a baseline to improve your website, and ensures that you can quickly identify and fix regressions.
Having historical data available means that when a metric changes you can identify exactly what caused the change. Once you understand the issues it's often easy to fix.
Having numbers readily available also makes it easier for your business to prioritize performance, as you can continuously review your data and identify new opportunities.
Technical depth in a monitoring tool helps your team identify the root cause of poor performance.
How to set up frontend website monitoring
What you need to do to start monitoring frontend web performance depends on the type of monitoring you're setting up.
For synthetic monitoring you just need to enter your website URL into a synthetic monitoring tool and start tracking page load time, Lighthouse scores, CrUX data and more.
For real user monitoring (RUM) you'll need to install a snippet on your website. This code is then loaded by your visitors and data can be reported back to the monitoring tool.
Sign up for a free DebugBear trial to start collecting comprehensive performance insights for your website.
What performance metrics should I focus on?
There are a large number of website performance metrics that you can track and optimize. So where should you start?
For a few reasons, we recommend starting with Google's Core Web Vitals metrics:
- They focus on user experience, instead of technical metrics
- Google provides real user web vitals data in the CrUX dataset
- Web vitals impact SEO
- They cover more than just the initial page load
Website performance tools like DebugBear include support for all the web vitals metrics as well as detailed technical data for debugging.
Web performance data beyond metrics
While the web vitals are a great starting point to assess your website, as you start optimizing you'll want to get more technical depth. That includes:
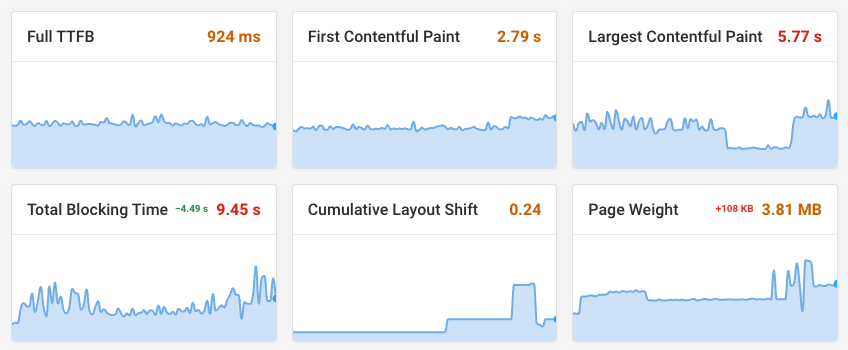
- Additional metrics that break down the high level metrics, allowing you to pin down where an issue comes from
- Detailed reporting and analysis that goes beyond just numbers
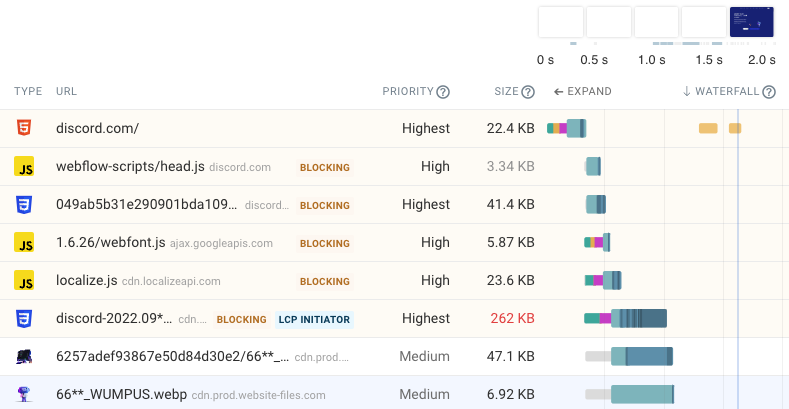
For example, request waterfalls like this one are important to understand how your website loads and why content appears when it does.
What are the best tools to monitor frontend website performance?
What tools are best to monitor your website performance depends on your website, what your team needs, and what your budget is. However, here are a few of our favorite tools.
DebugBear
DebugBear is the tool we've built to help development and marketing teams keep track of website speed and make optimizing their website easy.
Pros:
- Combines synthetic, real user, and CrUX monitoring
- High-level dashboards as well as in-depth technical reports
- Focus on speed and Core Web Vitals
Cons:
- No uptime monitoring
- Limited transaction monitoring
You can start a free trial here.
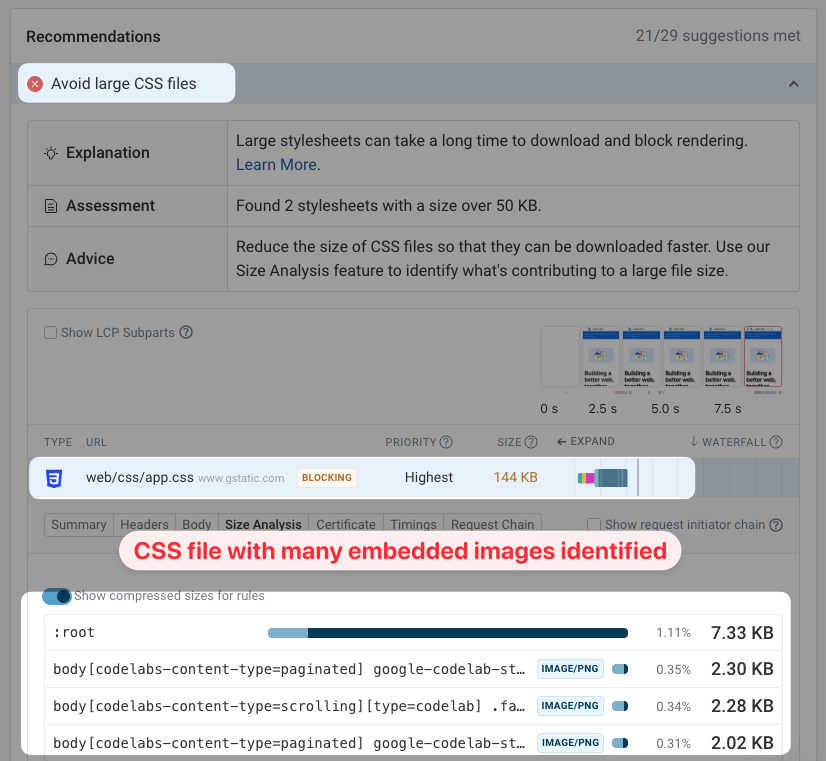
Each synthetic test result provides in-depth reports and recommendations to improve your website performance.
For example, DebugBear can identify requests that are not prioritized correctly or response data that can be made smaller. The screenshot below shows a large render-blocking CSS stylesheet that's slowing down the page load. You can see that most of the CSS file consists of embedded PNG images.
Sentry
Sentry is an application monitoring tool targeting developers, covering not just frontend monitoring but backend monitoring as well.
Pros:
- Broad coverage of frontend, error, and uptime monitoring
- Session replays to debug user experience
Cons:
- Limited Core Web Vitals data
- Fewer automated recommendations
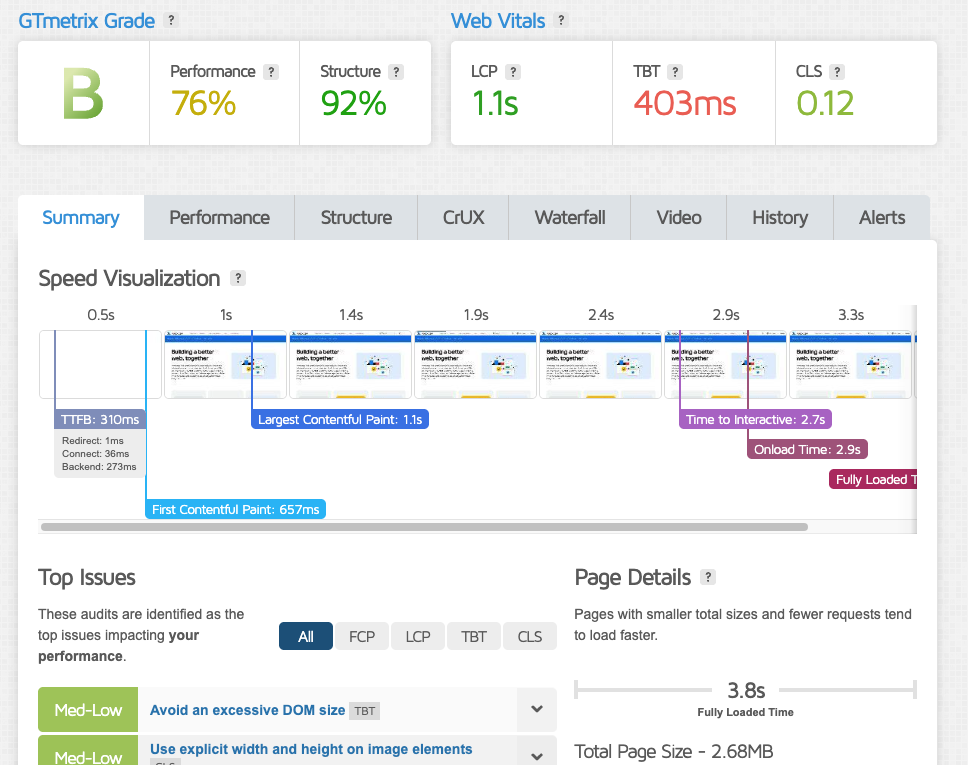
GTmetrix
GTmetrix has been around as an entry-level page speed tool for a long time. It provides reporting on frontend performance and Lighthouse scores, appealing to both developers and marketers.
Pros:
- Entry-level pricing
- Track load time and Lighthouse scores
Cons:
- Only synthetic monitoring is supported
- Less technical depth than other tools
What to look for in a frontend monitoring tool
Here are a few things to look out for when evaluating a monitoring tool for your website:
- What types of monitoring are supported, and what are the different data sources?
- Does the tool track Lighthouse scores, and does the service produce reliable data?
- How many global test locations are available?
- Is the tool easy to use?
- Does the tool provide custom performance recommendations?
- How does the pricing compare to other options?
- Does the tool support all three Core Web Vitals metrics?
- What alerting options are available? How can alerting be configured, and what channels can alerts be sent to?
- How detailed is the test result and real user data?
Monitoring single page applications
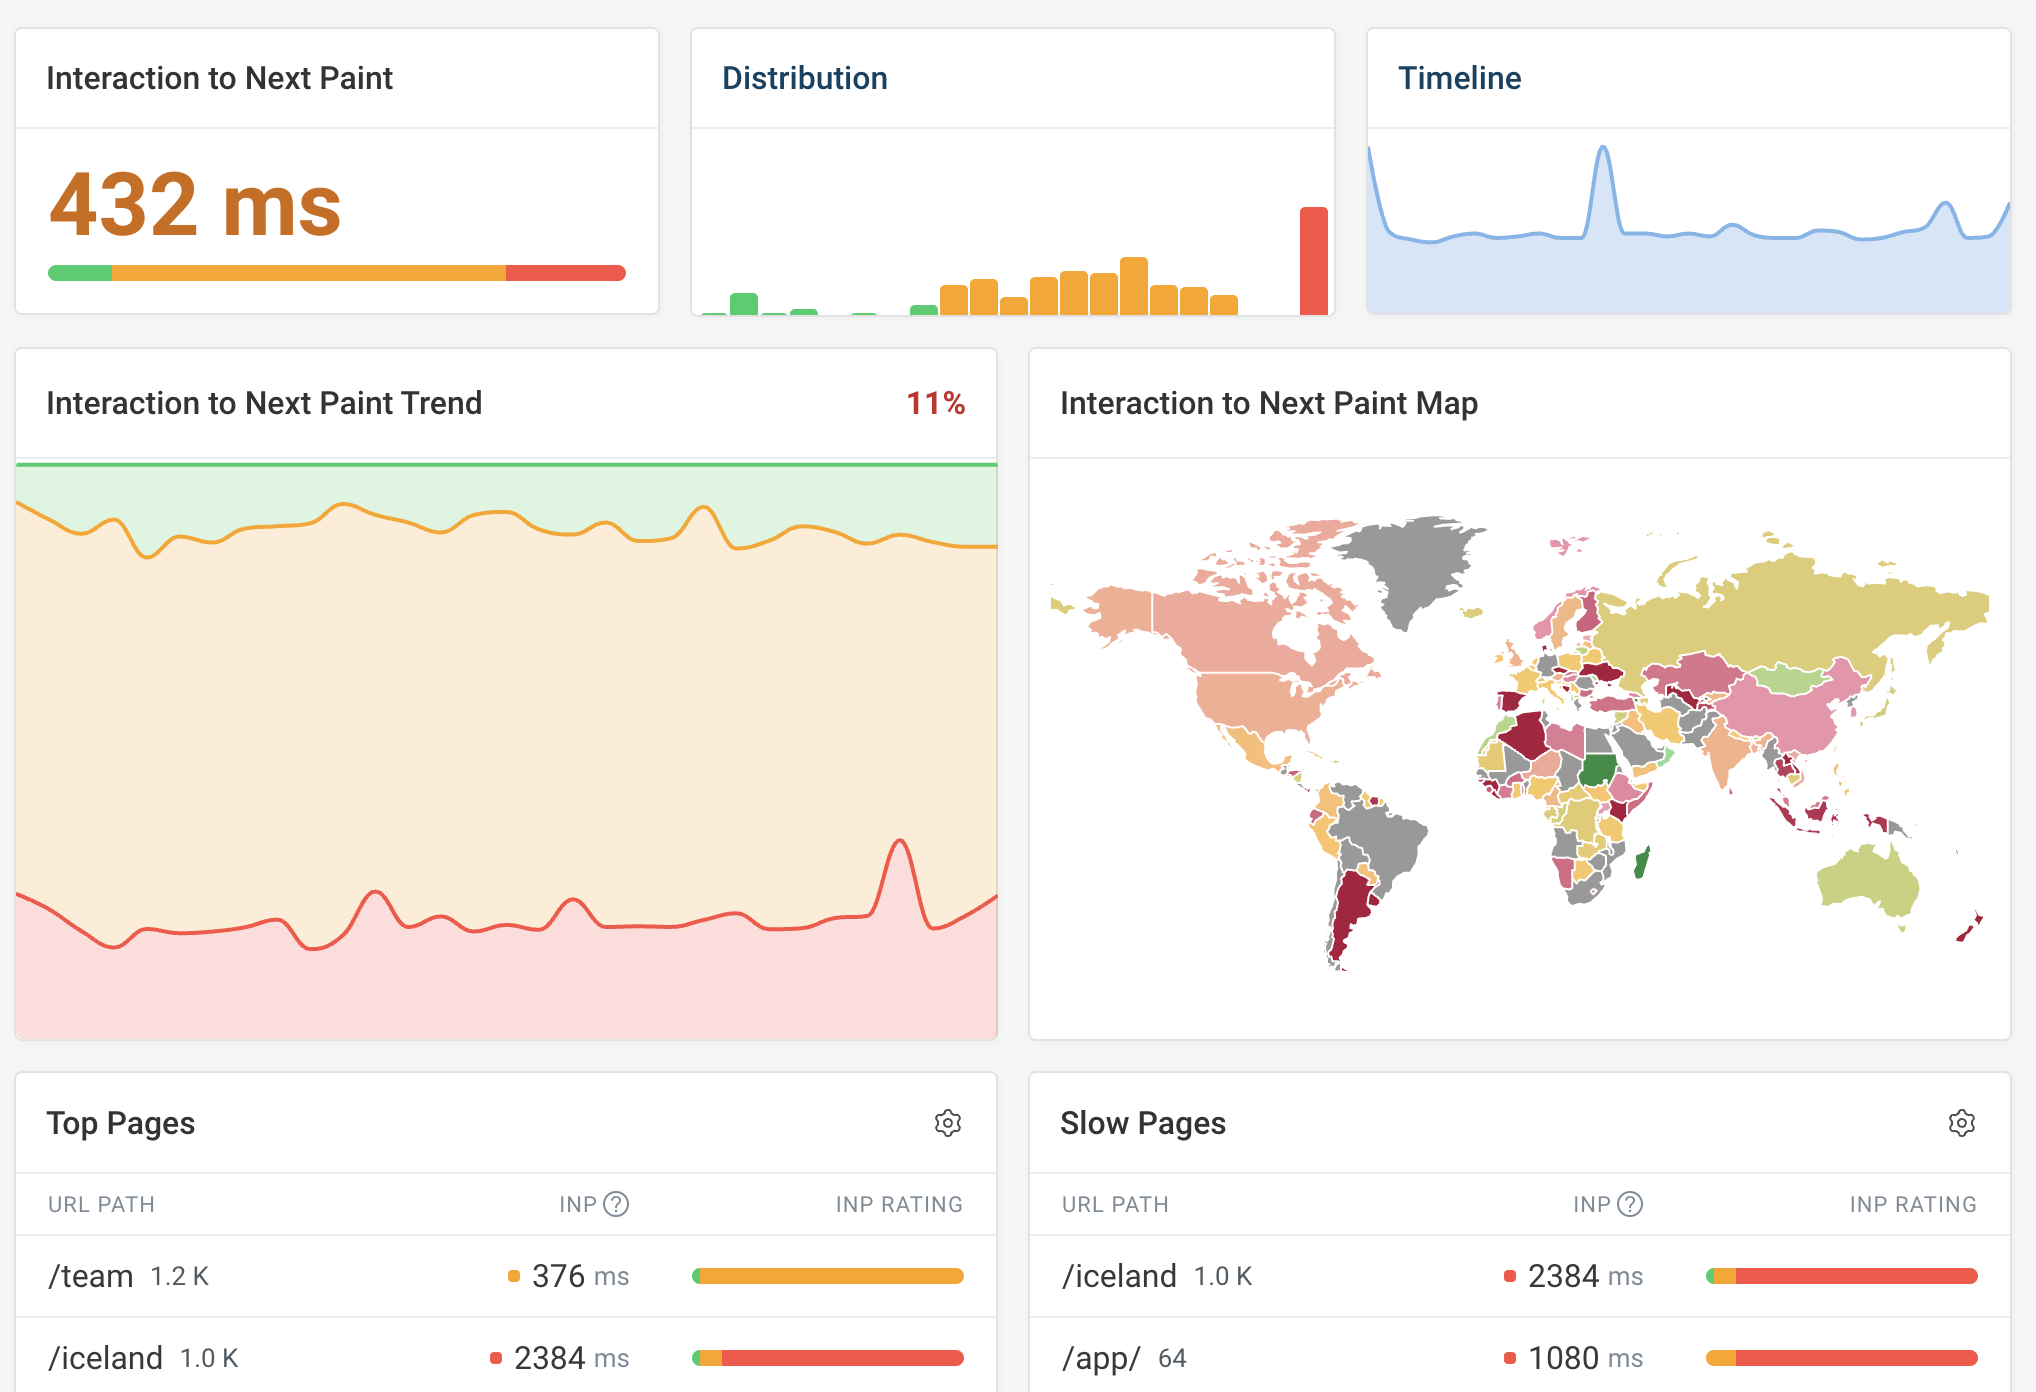
Single page applications (SPAs) pose special performance challenges. Not just for website load time, but also for making sure interactions with the application are fast after the initial load. SPAs also face unique challenges with search engine optimization that require specific monitoring approaches.
To track this, Google defined the Interaction to Next Paint (INP) metric, which measures how quickly the page is ready to update after a user interaction. Keeping your website responsive is important for a good user experience.
This metric only became a Core Web Vitals metric in early 2024, so not all frontend monitoring solutions currently provide good support for this metric.
DebugBear has in-depth support for INP, letting you see where your website has issues and what page elements cause slow user interactions.
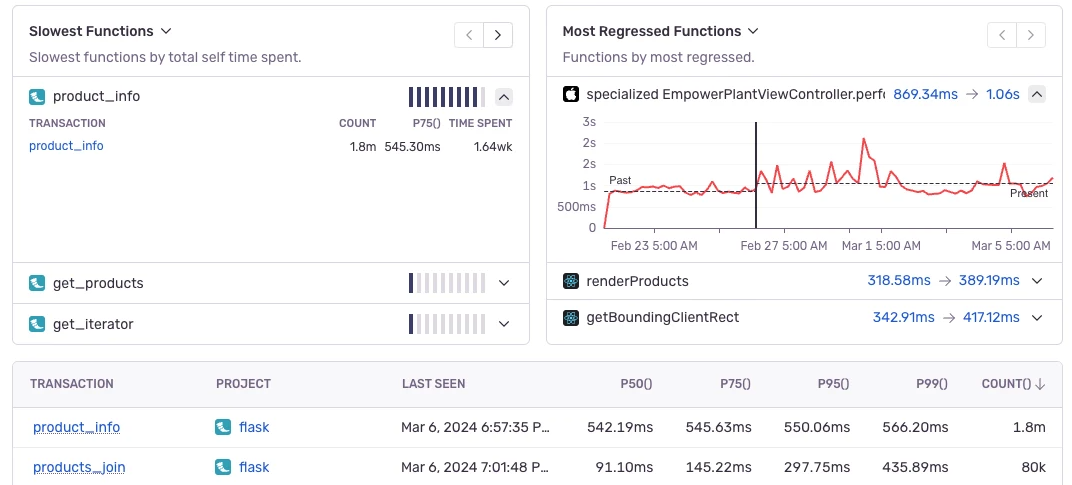
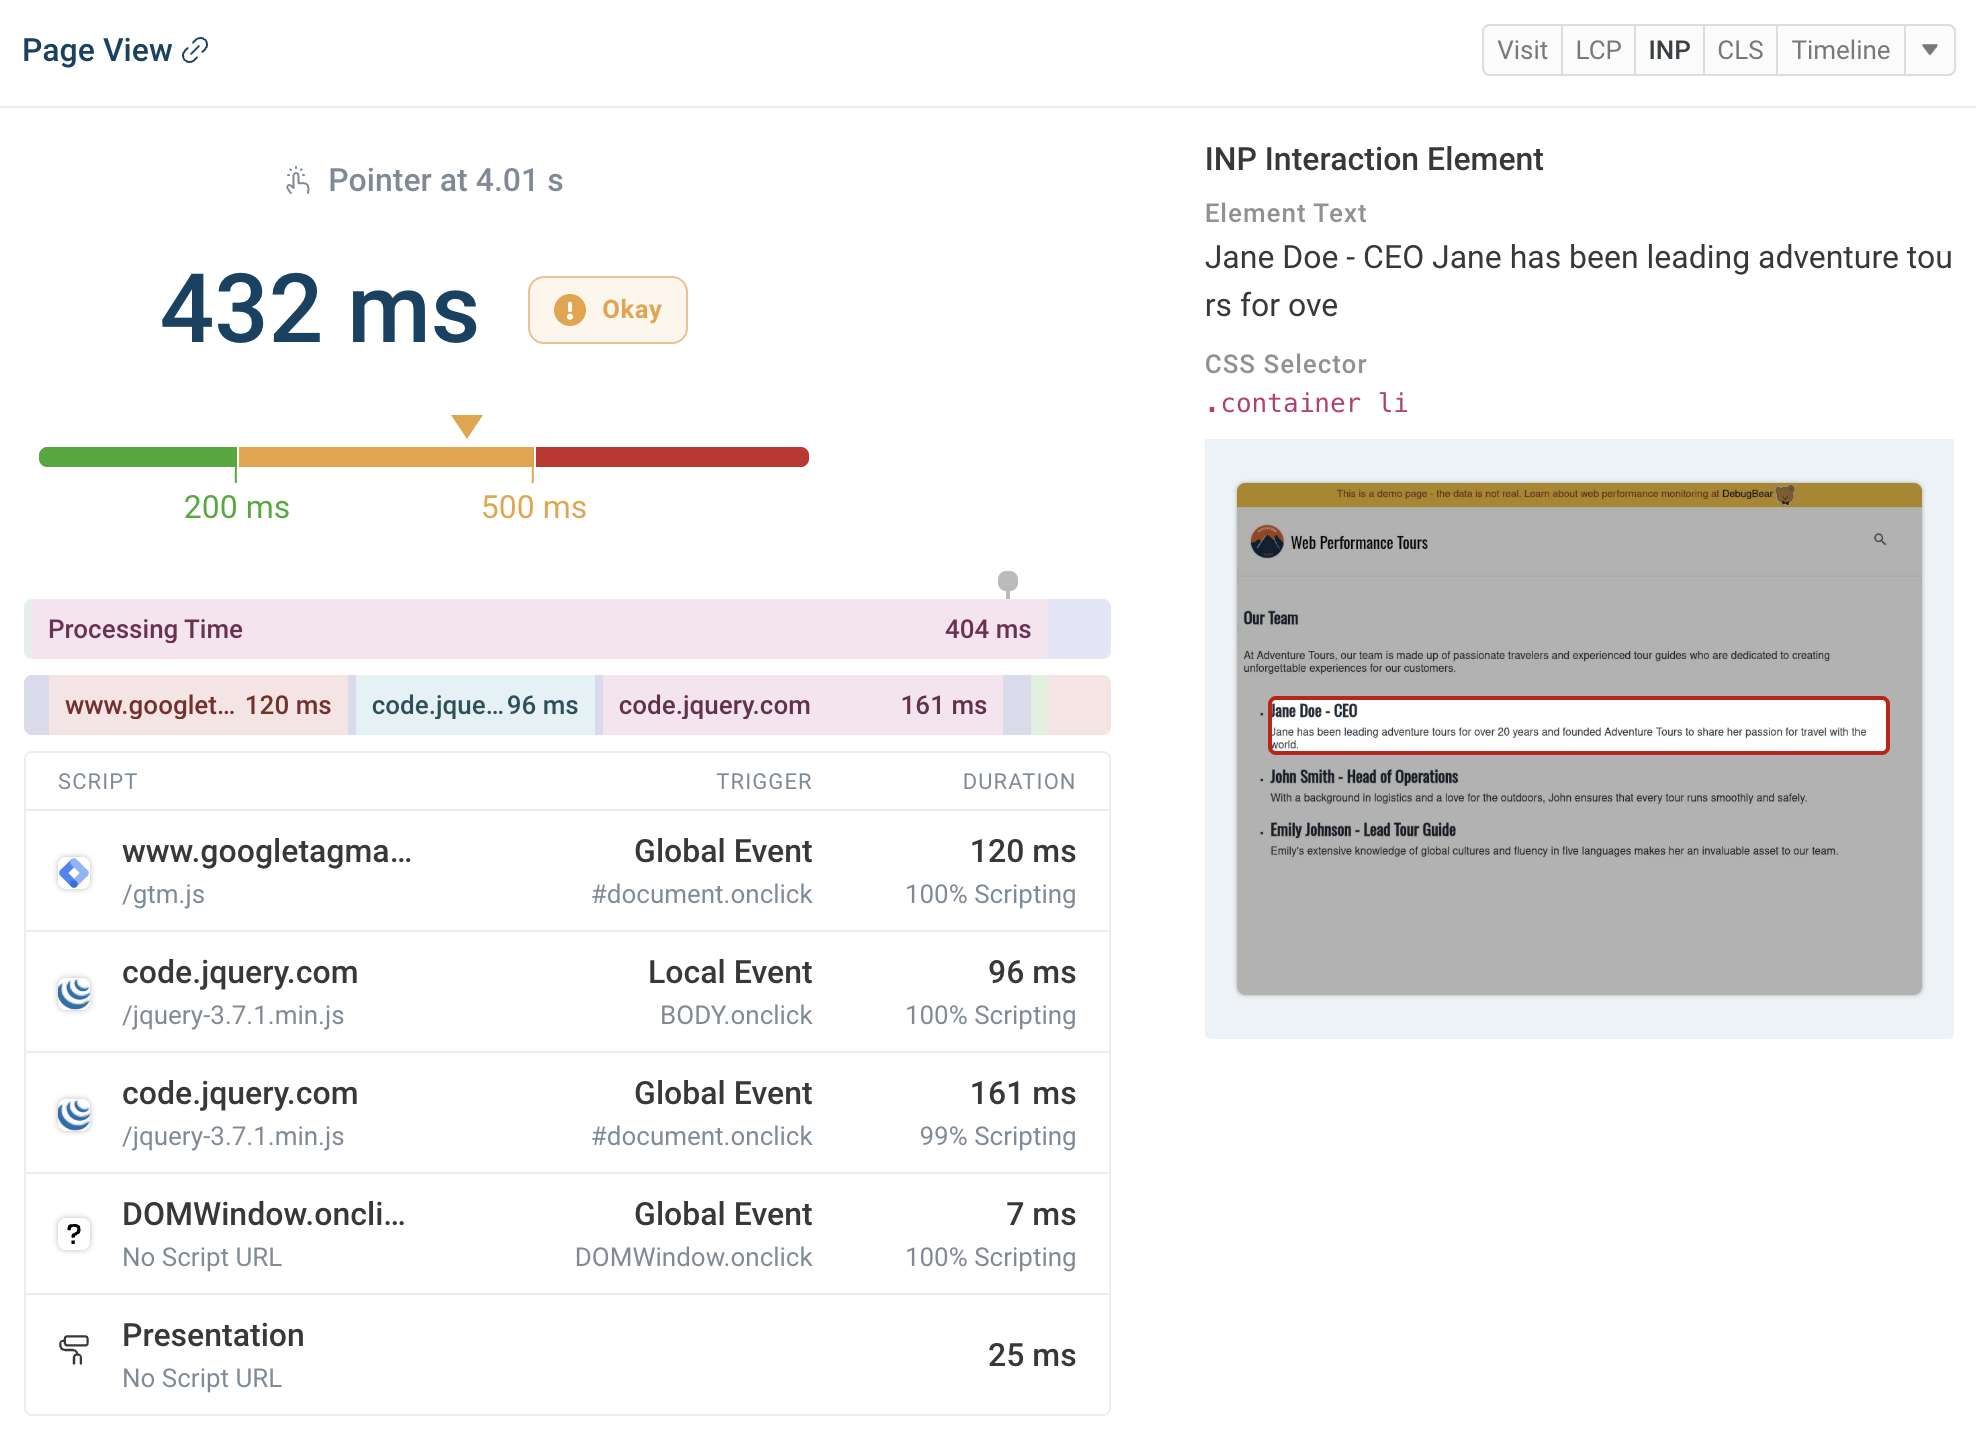
You can also debug slow interactions by checking what specific scripts are slowing them down.
DebugBear supports Chrome's Long Animation Frames API and lets you review individual page views to see how much delay different scripts contribute and why those scripts are running.
What to do once you've started collecting frontend performance data
Once you've got data coming in you can start prioritizing issues and setting your team up for success in the future:
- Identify pages that need to be optimized
- Investigate slow performance and identify solutions
- Configure alert criteria to stay ahead of issues in the future
Identify what pages need to be optimized
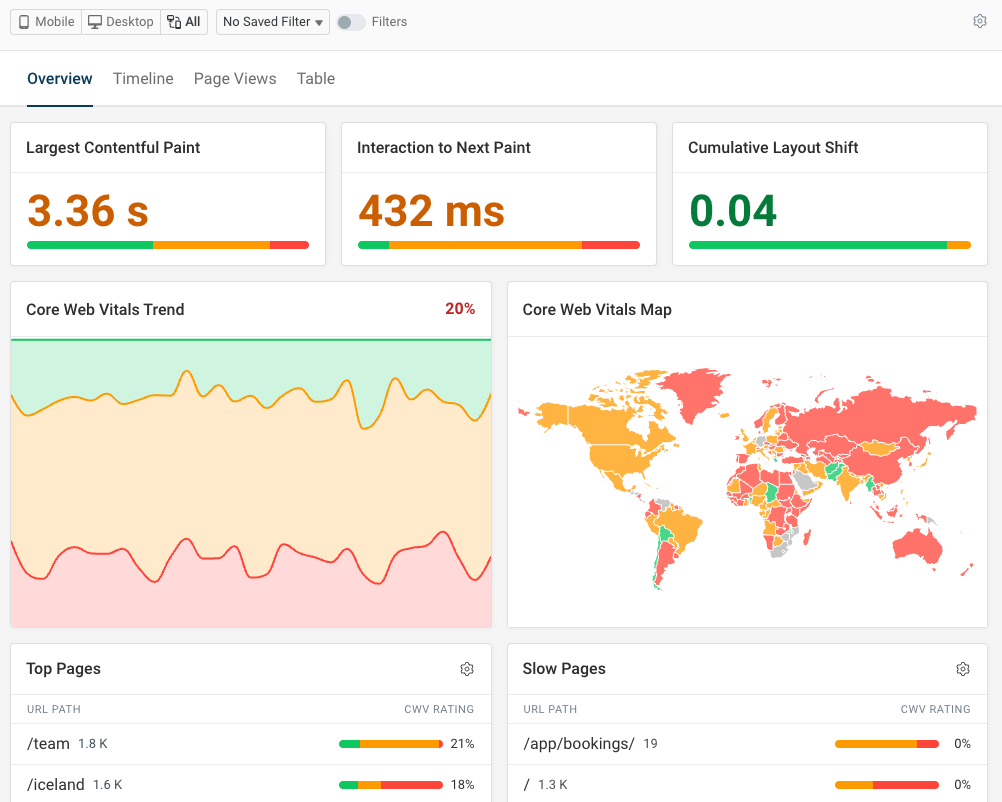
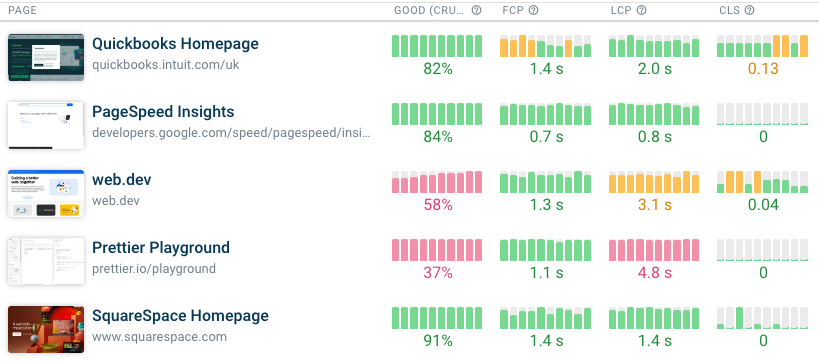
To improve your frontend performance you first need to identify where your problems are. Real user monitoring tools are great for this, as they can collect data across your entire website. Google Search Console can also point out specific slow pages.
You'll want to focus on pages with high traffic and poor performance. These fixes will impact the largest number of users.
Investigate slow performance
Once you know what page you need to optimize and what metric is causing issues, you can start investigating page issues.
Monitoring tools come with detailed reporting on what happens on the network as well as on the CPU. This can show you what's slowing down the page load or freezing the page after a user interaction.
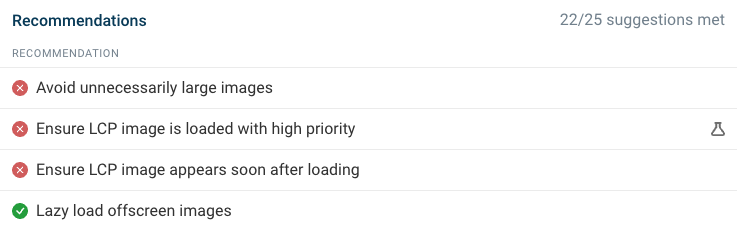
Automated recommendations are also a common frontend monitoring feature, which can help you quickly identify high-impact changes you can make on your website.
Configure performance alerts
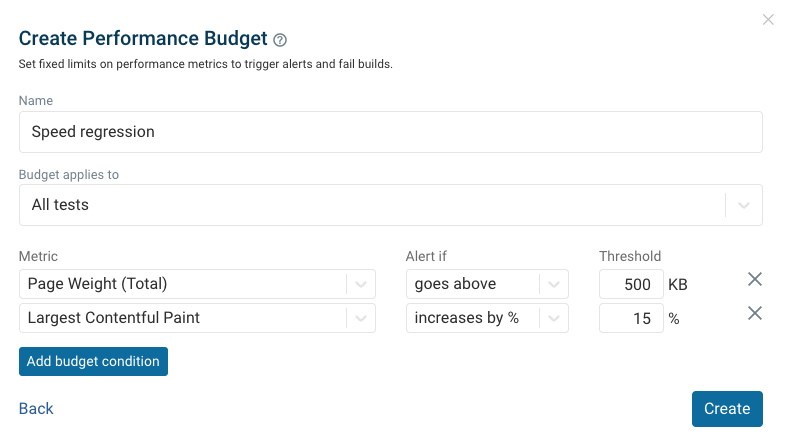
One of the key benefits of a monitoring tool is finding out about performance regressions early. But without custom setup, notifications can also often be unnecessarily noisy, leading to alert fatigue.
That's why you'll want to customize alerts by setting performance budgets. That way you'll only be notified when necessary, without missing important changes.
Optimize your frontend performance
In this guide you've learned why frontend monitoring is important and what you can do to get started. The next step is trying out a performance monitoring tool and using it to make customers happy, rank higher in Google, and improve conversion rates.


Monitor Page Speed & Core Web Vitals
DebugBear monitoring includes:
- In-depth Page Speed Reports
- Automated Recommendations
- Real User Analytics Data