A fast website is important to make users happy and to improve Google rankings.
But if you're getting a poor Performance score on PageSpeed Insights, maybe that's just fine? Sometimes at least.
A bad Lighthouse score does not mean bad SEO
Here's a PageSpeed Insights report from a user I talked to recently. It sure doesn't look good!
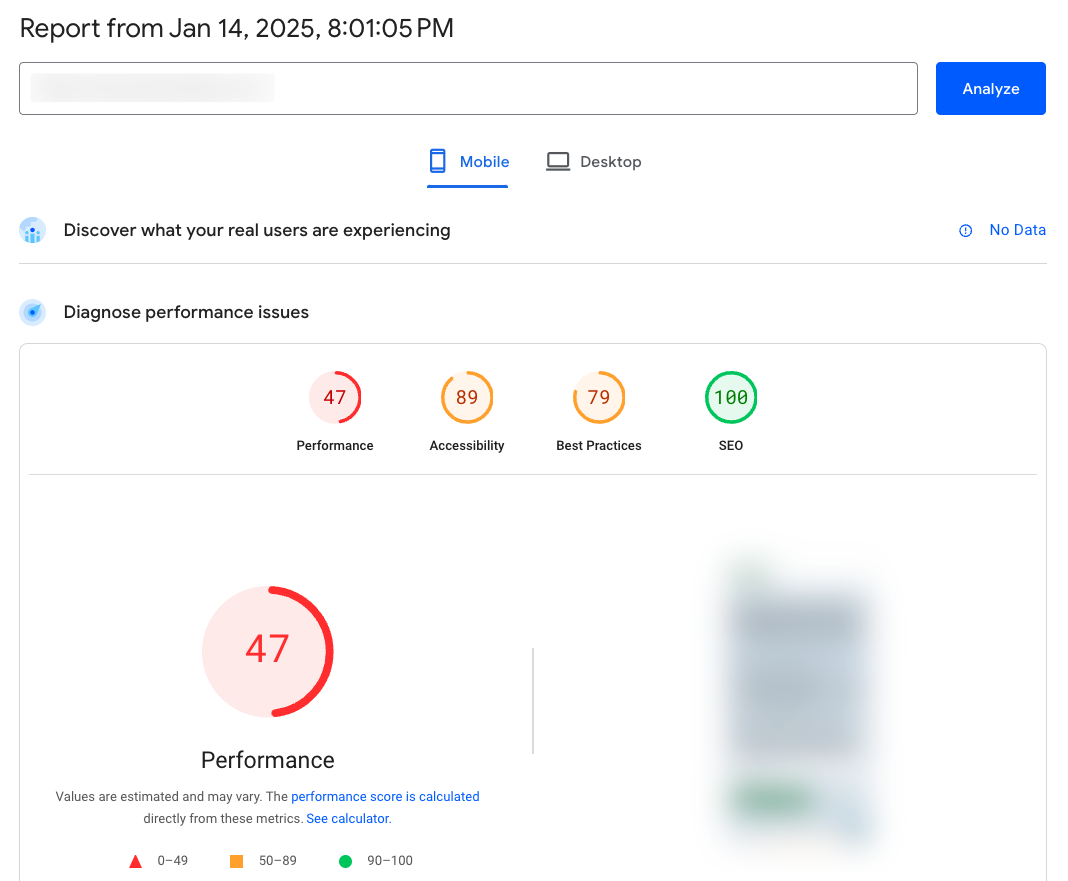
The Lighthouse Performance score gets a "Poor" rating. Maybe that's why the website is struggling with SEO?
I don't think so!
Google looks at the real user data from the Chrome User Experience Report (CrUX) to decide how a website's performance should impact its rankings.
But there's no data available here! So I don't think there's any SEO impact.
And even if there was, if you don't even get enough traffic to have an origin-level CrUX score you probably have bigger problems.
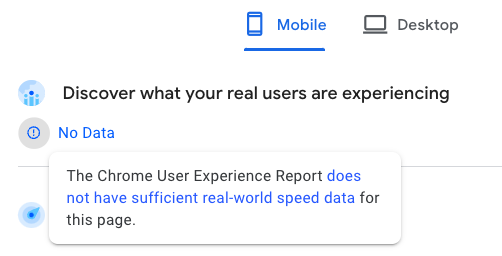
The section showing poor data is called Diagnose performance issues. It's not meant to check if you have a performance problem, but to diagnose the cause if you have them.
A bad Lighthouse score does not mean a bad user experience
Let's look at an example where we get enough traffic to have real user data, in this case the Lidl UK homepage.
Here we see:
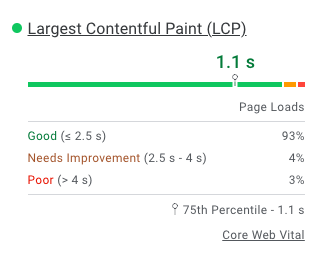
- A great real user page load time (just 1.1. seconds until the Largest Contentful Paint)
- A poor Lighthouse score of 47 out of 100
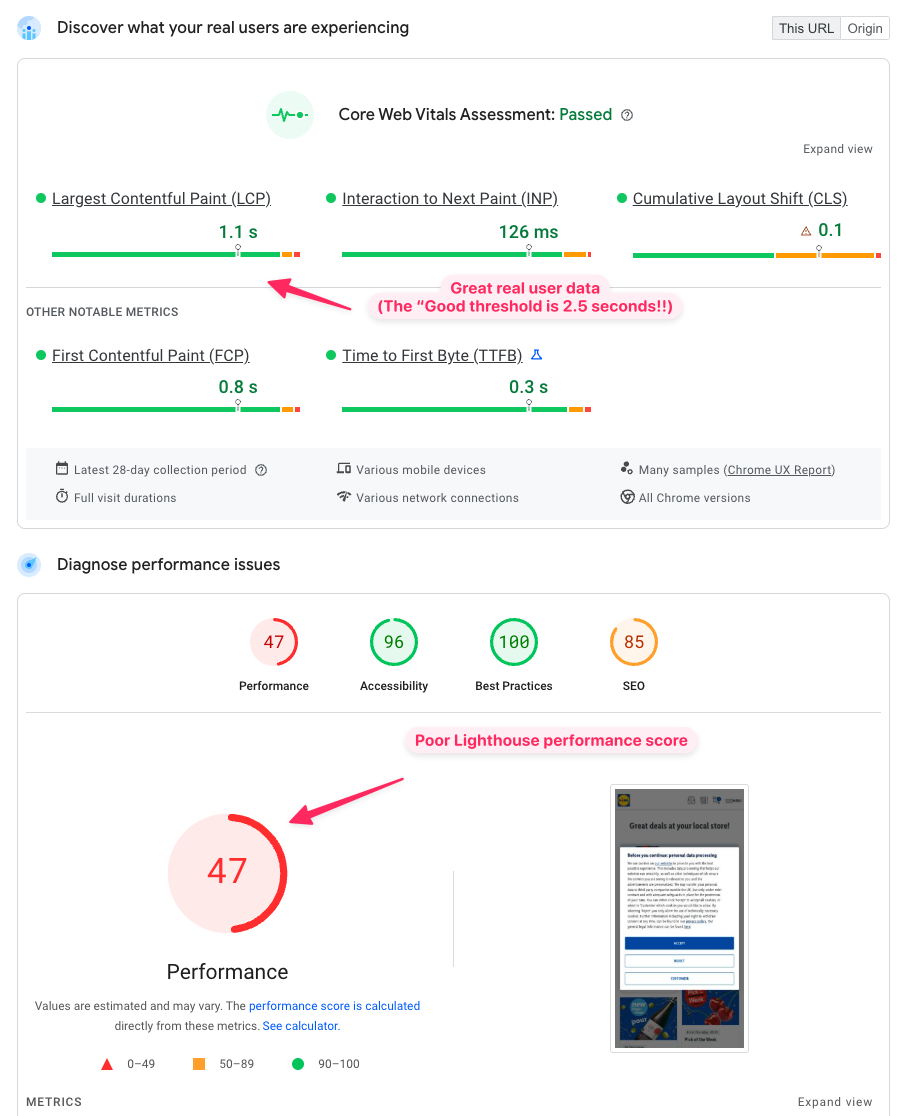
What's going on here?
First of all, let's look at the network throttling settings Lighthouse is using:
- 150 milliseconds round trip time
- 1.6 megabits per second bandwidth (roughly 0.2 megabytes per second)
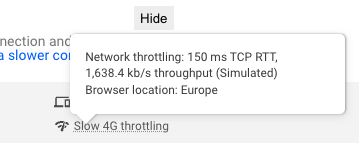
And contrast that with actual mobile network latency in the UK.
On 3G mobile latency is 40 milliseconds, and many people have networks faster than that. And that's not including people whose phone is connected to wifi!
The median 3G mobile network bandwidth in the UK is about 6 megabytes per second. Almost 4x faster than the Lighthouse setting!
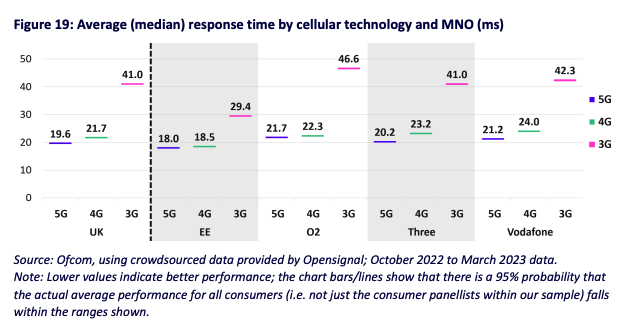
Does that mean everyone has a fast experience? No. There'll be some people with poor connections, whether they are in remote areas, near popular transit hubs, or on an airplane.
But the real user data tells us that 93% of visitors wait less than 2.5 seconds for the main page content. For some organizations that might still not be good enough. But for most businesses that's a great achievement, and it's ok to stop worrying about SEO and ignore the poor Lighthouse score.
Test location
One more quick note about the data above: PageSpeed Insights runs European test from a data center in the Netherlands. But most customers of Lidl UK are probably closer to wherever Lidl is hosting their UK website.
Lighthouse tests the first visit experience
The poor network speeds used for Lighthouse test is one reason why Lighthouse scores can be poor for fast website. But it's not the only one.
Another reason for the discrepancy is that Lighthouse only looks at the first visit to a page, but usually subsequent page views are faster:
- Server connections can be reused
- Some resources are already cached in the browser
- There are no more cookie banners that can impact page speed
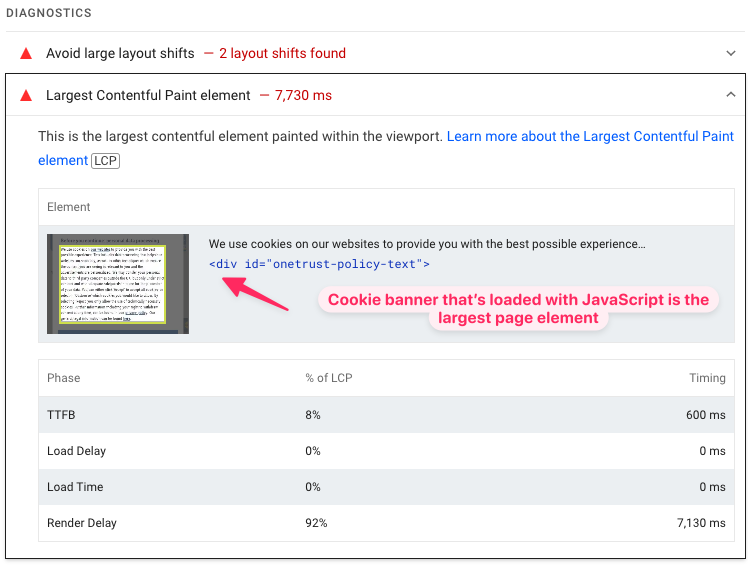
The presence of the cookie banner actually has a big impact on the Lighthouse score of the Lidl website. While the normal main content of the site loads quickly, the cookie banner depends on a third party JavaScript file.
Simulated throttling: Lighthouse is not always reliable
If you look carefully, you'll see the word "Simulated" in the network settings tooltip. That means the test was run with simulated throttling:
- The page is loaded on a fast connection
- Lighthouse run a simulation of how fast the website might be on a slower connection
Technically Lighthouse runs two simulations, an optimistic and a pessimistic one and then calculates the average.
Let's look back at the PageSpeed Insights result of the Lidl homepage. Our Site Speed Chrome extension can surface the original data before the simulation, called the "observed data".
This observed data is what was measured on the fast connection.
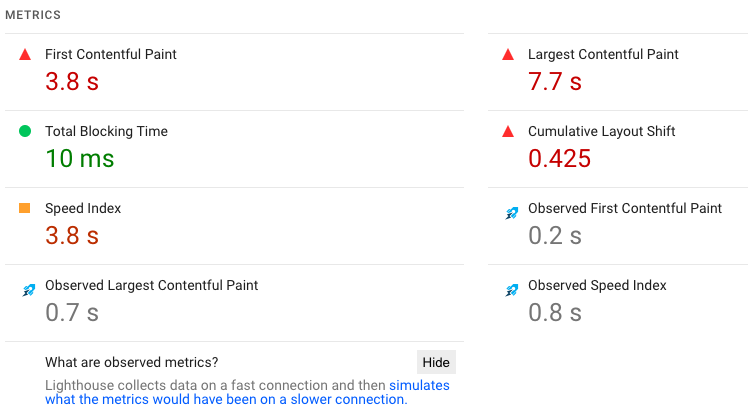
Here we can see that on a fast connection, the page actually loaded in 0.7 seconds. The simulation of the poor network speed brings it down to 7.7 seconds.
In this case I think the simulation is broadly reasonable. For example, the relative change from observed FCP to simulated FCP and from observed LCP to simulated LCP roughly match. Sometimes you'll see that the observed values are identical, while the simulated values vary by a lot. That usually indicates a limitation in the simulated throttling logic.
But if we go back to our original example we start to notice a bigger difference.
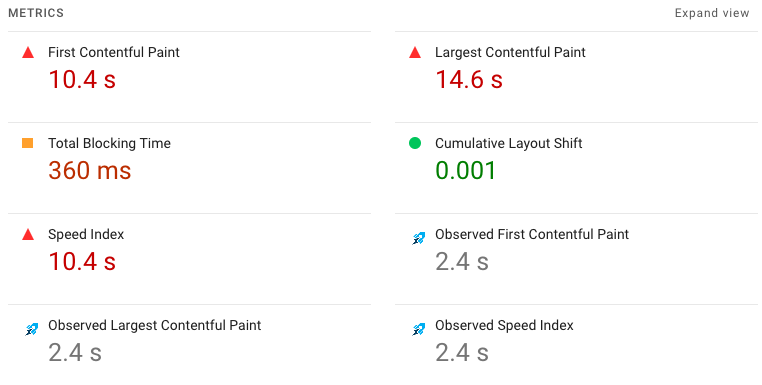
What if we run a DebugBear performance test with the same throttling speeds but with packet-level throttling while the test is running?
Now we see that the LCP is fine, with a score of 2.2 seconds compared to the 14.6 seconds reported by the Lighthouse test.
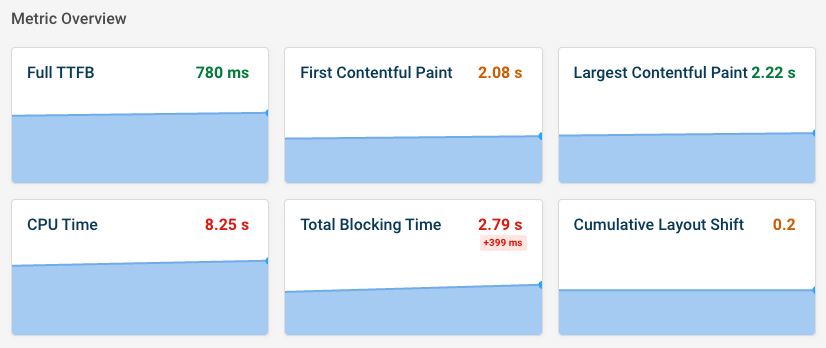
Generally, the simulated PageSpeed Insights data is not always reliable. If a tool does not use simulated throttling but instead collects data directly on a slower connection, this will tell you more about whether your website is actually slow for users with a slower network connection.
A good Lighthouse score does not mean a good user experience
Usually Lighthouse tests use slow connection settings, so if you've got a good experience on a slow connection you'll probably offer a good experience on a fast connection as well. However, that's not always the case.
Ok, so getting good Lighthouse scores on mobile while failing the Largest Contentful Paint for real users is actually pretty tricky. Unless the Lighthouse test agent is blocked and you're just testing an error page.
Then I realized I can also look at desktop data, where getting a good Lighthouse score is a lot easier. After trying a bunch of pages and clicking "Analyze" a few times on PageSpeed Insights I got this:
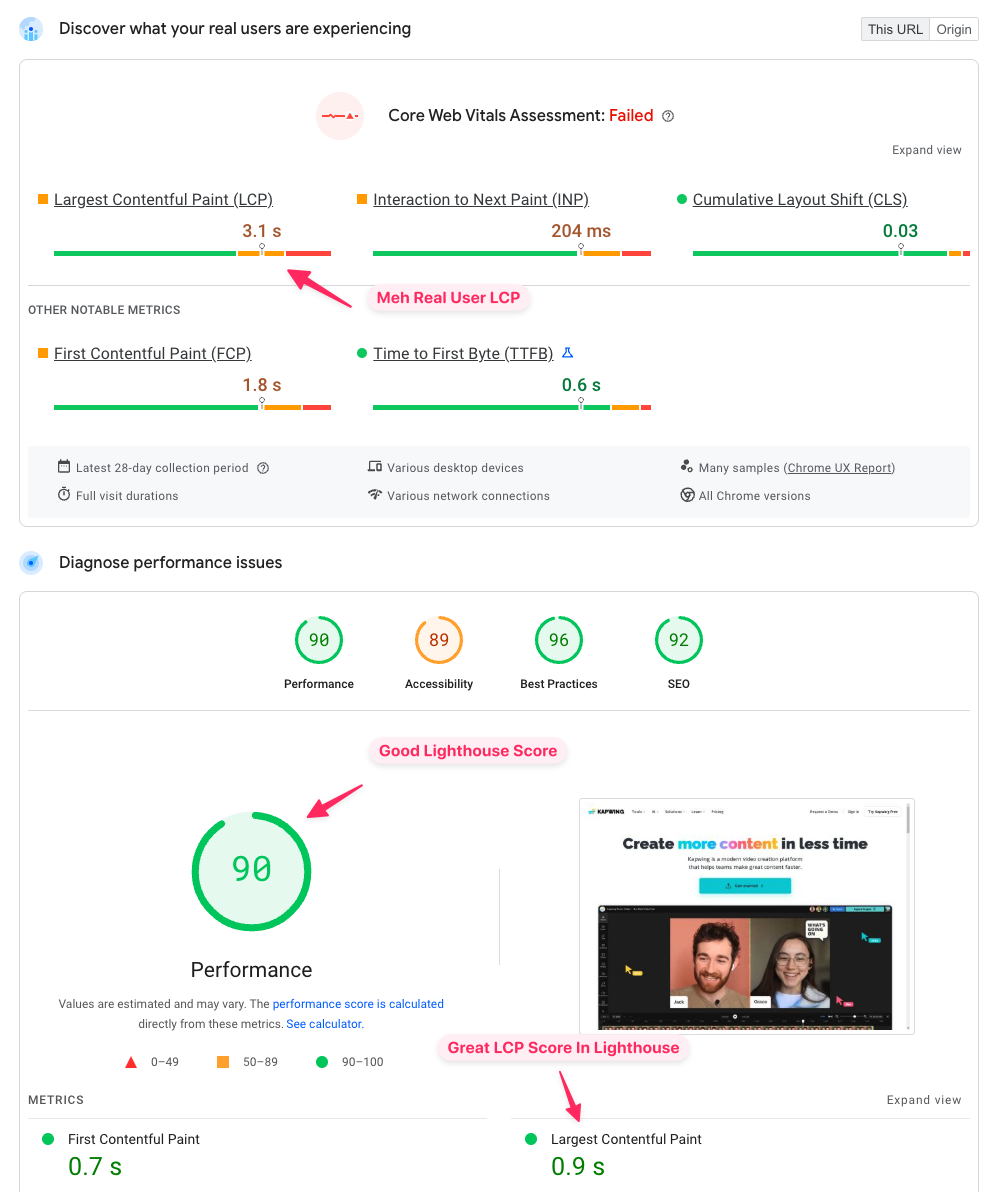
What could explain this?
- The page is served from a CDN cache in the lab test, while real users don't get a cache hit and the page has to be generated dynamically on the origin server
- The page was slow until recently, but the CrUX data is still lagging behind (it covers a 28-day period, while the Lighthouse test measures a single experience at one point in time)
- Real user are logged in and see different content compared to anonymous visitors
After signing up to Kapwing I can confirm that the last option is what's causing this test result.
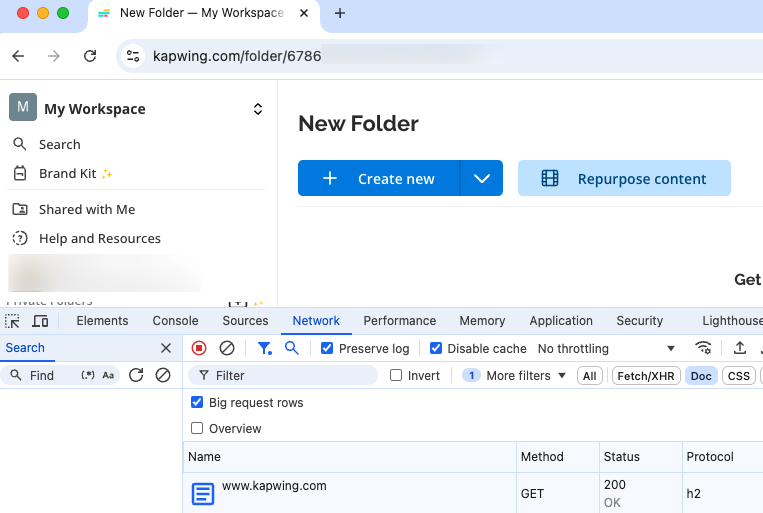
At first it didn't look like that's the case – once I was logged in I was getting redirect to another URL when opening the Kapwing homepage.
But that's not a real redirect - instead it's just a soft navigation in a single page app. You can tell by checking the Chrome DevTools network tab, enabling Preserve log, and then visiting the homepage.
If this was a redirect I'd expect a 3xx status code, followed by another document request. But that's not the case here.
Lighthouse only measures page load time and early layout shifts
When looking at Core Web Vitals metrics in Lighthouse it's also useful to remember:
- Lighthouse does not measure Interaction to Next Paint any user interactions
- Lighthouse only measures layout shifts that happen during the initial page load
So if you're optimizing performance to pass Google's Core Web Vitals, then even a perfect Lighthouse score often doesn't mean you've fixed the other web vitals metrics.
How do I know if I've got a web performance problem?
Ok, so if the Lighthouse score is not a good way to tell if you've got a performance problem, how do you know if performance is impacting your SEO and user experience?
- Real user data tells you your website is slow
- Users are telling you your website is slow
- You find the website is slow (especially if you have no users or CrUX data)
Real user data could come from Google's CrUX data, a real-user monitoring service, or real user data collected in-house.
If your primary concern is SEO then the best place to start is the Core Web Vitals tab in Google Search Console. If everything looks fine there, or no data is available, then you can move on and focus on something more impactful.
Should I optimize web performance or Lighthouse scores?
Lighthouse scores are much loved on the web. They're easy to measure, update instantly, and summarize performance into one simple green, orange, or red number.
Sometimes they're a little too loved. Clients demand passing Lighthouse scores from development agencies. Content management systems report them as part of the product. SEO tools send out alerts when Lighthouse scores aren't good.
The first step here is to redirect to better data sources and explain what makes them better:
- Are real users experiencing poor performance due to CrUX data?
- Are you experiencing poor performance?
- Share this article and point out the limitations of Lighthouse
If you can point clients to a more meaningful data source that's a win for your client and their customers!
This won't always work. So what if you really have to optimize Lighthouse scores instead of web performance?
- Check what's causing your Lighthouse score: slow network speed, simulated throttling, something else?
- Make targeted changes to your website: for example, if slow network speed is causing poor Lighthouse scores you can focus on page weight optimization
If you want to see the optimistic and pessimistic metric estimates, this Lighthouse simulation tool can also be helpful.

You might have a performance problem on some pages
Lighthouse only ever tests one page at a time. You might not be able to identify gaps in your page speed unless you test all pages on your website with it.
Google Search Console data is better. It will look at your entire website (at least the pages where there's some real user data available) and tell you what page groups are slow.
However, if you want to get in-depth insight into real user experiences across your whole website you need a real user monitoring tool. That way you can identify slow experiences across your whole website and get real time data updates whenever you deploy a change.
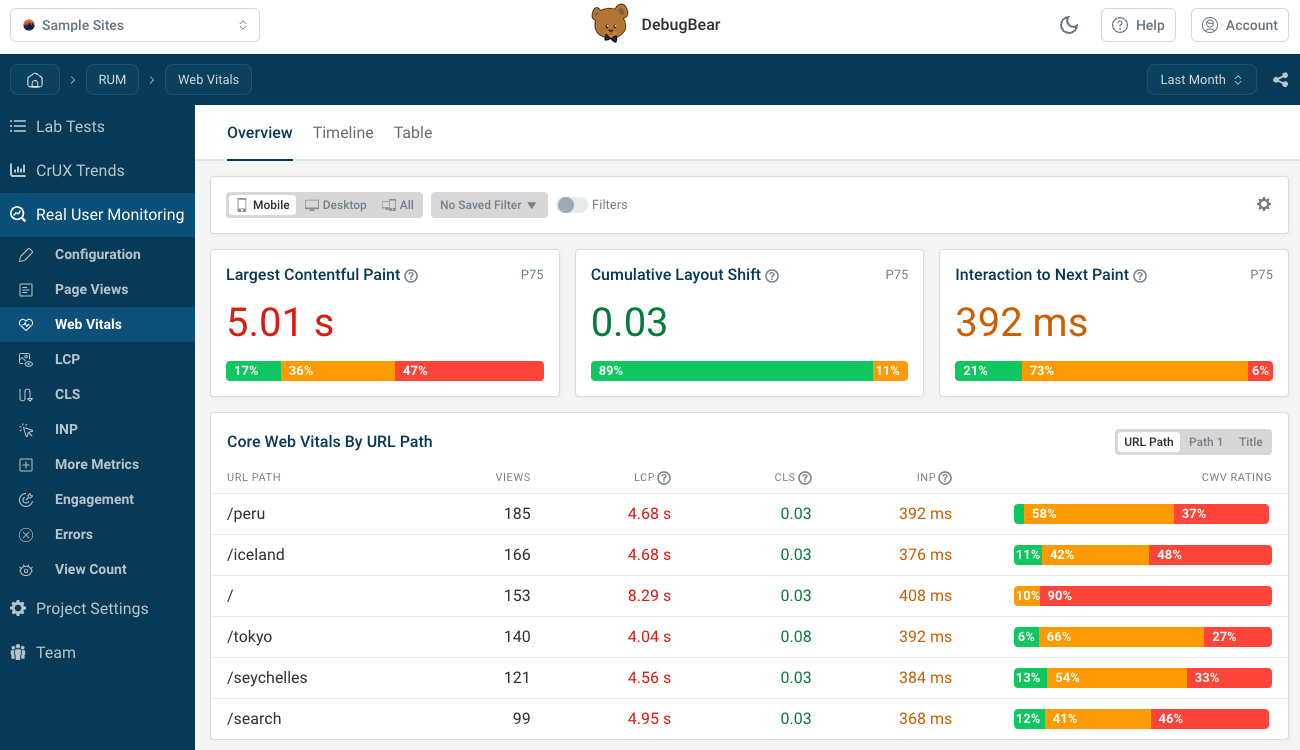
DebugBear tracks Lighthouse scores, Google CrUX data, and real user metrics. Sign up for a free trial!
Learn more about Lighthouse scores
This is, roughly, the 10 millionth article I've written about Lighthouse performance.
If you'd like some introductory reading on how to use Lighthouse for performance testing and understand common problems, check out these articles:
- How to measure and optimize the Lighthouse Performance score
- Different ways to run Lighthouse, from DevTools to CLI
- Why does Lighthouse not match real user data?
- Why do Lighthouse scores vary between test environments?
- Why Is Google Field TTFB Worse Than Lighthouse Lab Data?
Or, if you'd like to deep dive into network throttling:
- Simulated throttling, packet level throttling, DevTools throttling, plus an article comparing them all
- How does Lighthouse simulated throttling work?
Or if you're looking for advanced ways to measure performance with Lighthouse:
