Chrome's developer tools provide a lot of information on what's slowing down your site and how to make it faster. This article explains how to use the DevTools Network tab to debug performance issues.
Getting started: is the network the performance bottleneck?
Before looking at the requests made by the page we first need to check if the network is actually what's slowing it down. Heavy CPU processing is also a common cause of slow page load times.
To check what's slowing down your page, open Chrome DevTools by right-clicking on the page and selecting Inspect. Then select the Performance tab and click the Start profiling and reload page button.
If the CPU timeline contains a lot of orange then the page is running a lot of JavaScript, and it might be better to look into that instead of focussing on the network.
Example 1: Youtube homepage
The Youtube homepage spends a lot of time running JavaScript and rendering the UI.

Switching to the Network tab, we can see that the document request could probably be sped up, and the JavaScript bundle could be loaded more quickly. But, compared to the 6.5s of JavaScript execution time, this isn't too important.

Example 2: Getty Images homepage
By comparison, the Getty Images homepage doesn't require a lot of CPU processing.

Instead rendering is blocked by a large number of concurrent image requests, slowing down a render-blocking script.
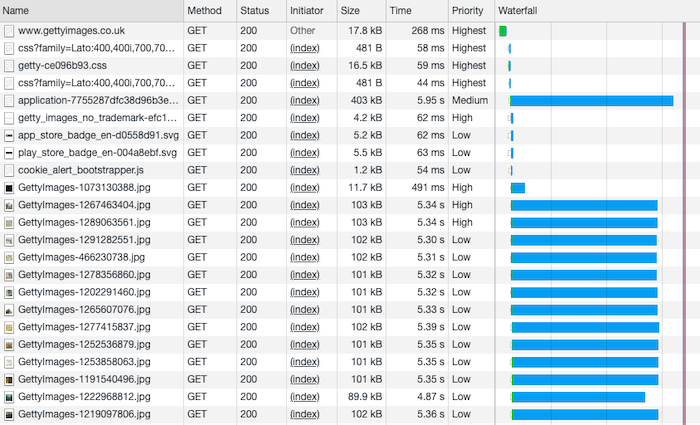
Here the Network tab will help identify opportunities to improve site performance.
Finding the cause of a slow request
If a request is slow, then either the server needs to respond to requests more quickly, or the size of the response needs to be reduced.
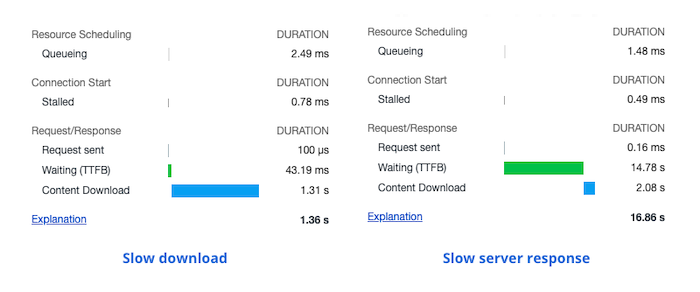
To break down the duration of a request, either hover over the Waterfall column, or click on the request and select the Timing tab.
This way you can find out if the request is slow because the response takes a long time to download (left), or if the server takes a long time before starting to send the response (right).
Large responses
If a response takes too long to download you need to make the response body smaller.
For example, if the the slow request loads an image:
- Serve a modern format like WebP to browsers that support it
- Increase image compression
- Resize the image so it's not larger than necessary
Or, for JavaScript files:
- Use gzip or brotli to compress the response
- Minify the JavaScript code
- Remove large dependencies
- Lazy load non-essential code
Slow server responses
To resolve slow server responses you'll need to look at your backend code. Your backend code might be doing unnecessary work or might be running slow database queries.
Learn more about reducing slow Time To First Byte (TTFB).

Run A Free Page Speed Test
Test Your Website:
- No Login Required
- Automated Recommendations
- Google SEO Assessment
Network throttling
As a developer you probably use a relatively fast internet connection. So a 10MB image might load quickly on your computer, but will take a long time on a 3G connection. Likewise, running your server locally means there's practically no round-trip latency.
To make investigating performance easier, Chrome DevTools includes a network throttling option that artificially increases response delays and reduces bandwidth. This lets you simulate how your site loads on a slower connection.
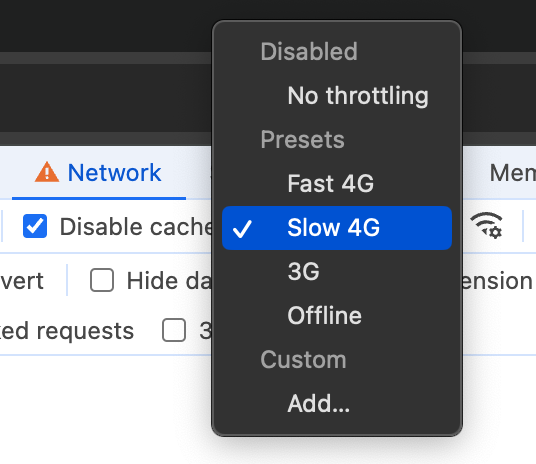
To enable throttling, select an option from the dropdown on the right of the "Disable cache" checkbox.
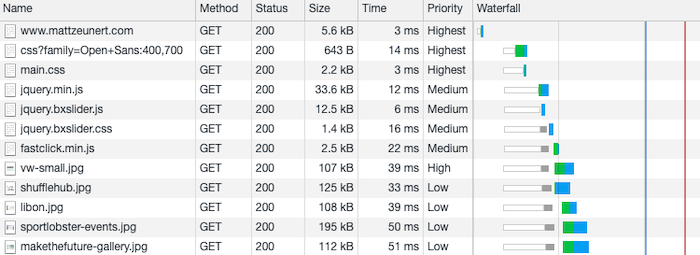
Here's a site on a fast connection without any throttling.
And here's the same site loaded using the Slow 4G setting.
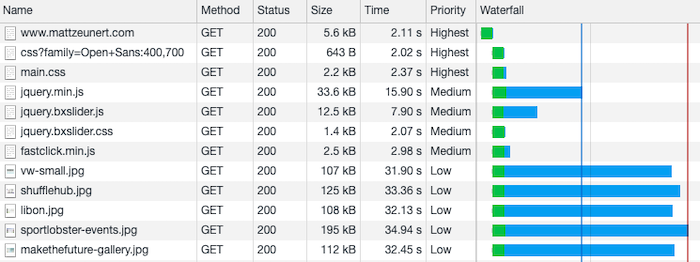
Throttling the network allows you to watch your page render gradually, observe what order content is displayed in, and which block rendering.
Note that DevTools uses a relatively basic type of network throttling. Learn more about the different types of network throttling.
Network round-trips
A network request to a new website consists of multiple sequential round-trips that are needed to create a server connection:
- DNS lookup to resolve the domain name
- Establish TCP connection
- Establish SSL connection
- Make the actual HTTP request
The DevTools waterfall shows each part of the request in a different color.

You can hover over the request to get an explanation of the breakdown.
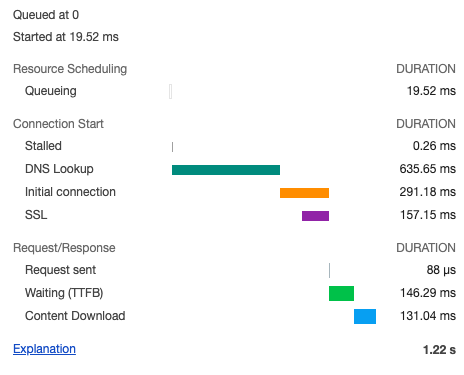
However, you'll only see these round-trips if Chrome hasn't previously connected to the website's server. If you load the same page again you'll only see the actual request round-trips, as the existing server connection is reused.

Clearing the DNS and connection caches
To simulate the first load experience you need to clear Chrome's DNS and connection caches.
1. Clear OS-level DNS cache
On macOS, run this command in your terminal:
sudo dscacheutil -flushcache; sudo killall -HUP mDNSResponder
Or on Windows:
ipconfig /flushdns
2. Clear DNS cache via Chrome
Copy this URL to open Chrome's net internals tool:
chrome://net-internals/#dns
And navigate to it in Chrome. Then, with the DNS tab selected, click Clear host cache.
This button sounds like it should clear the OS-level cache, but my experience just doing this isn't enough by itself.

3. Close existing server connections
Copy this URL:
chrome://net-internals/#sockets
And navigate to it in Chrome. Then click Flush socket pools.

Then reload the page you're testing and you should see the DNS lookup again, as well as the time spent on establishing the TCP connection.


Monitor Page Speed & Core Web Vitals
DebugBear monitoring includes:
- In-depth Page Speed Reports
- Automated Recommendations
- Real User Analytics Data
DevTools Network settings
Click the gear icon in the top right corners of the Network tab to view the Network tab settings.
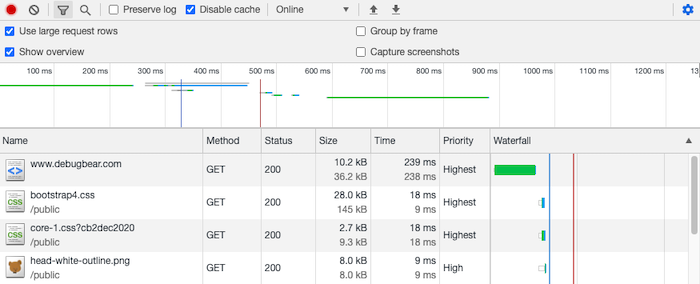
Large request rows
This setting means additional information will be shown in each row, for example the Size column will show both the compressed response size that's transmitted over the network, as well as the full unzipped size of the response body.
The Time column will show the server response time in addition to the total request duration.
Filmstrip
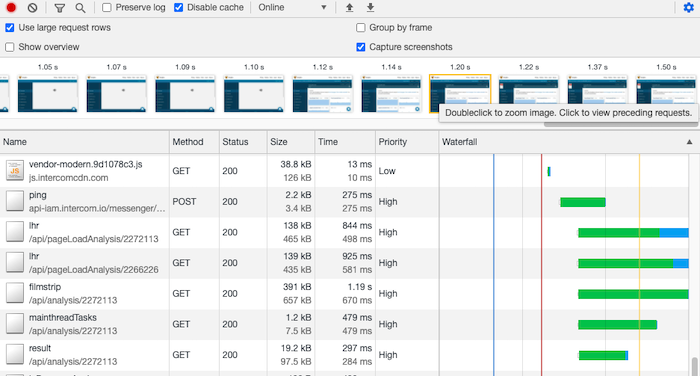
Check Capture screenshots to view a rendering filmstrip alongside your requests. This helps identify requests that block a particular part of your page from loading.
Hovering over a screenshot shows a yellow line in the waterfall column, indicating when that screenshot was taken.
Group by frame
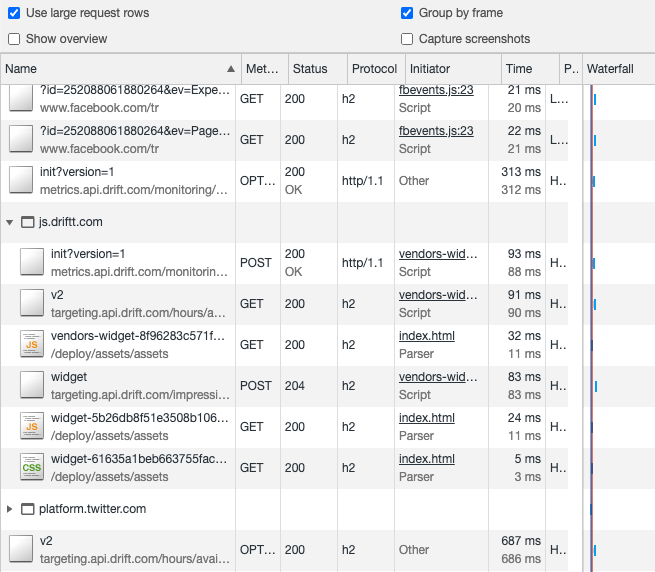
The Group by frame option can make the list of requests more manageable if a lot of requests are made by iframes.
Request columns
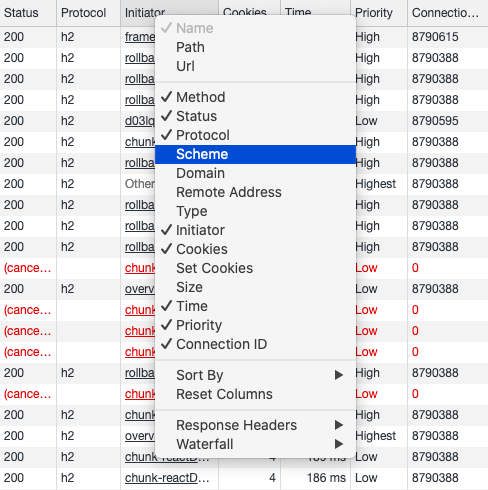
You can customize what information Chrome shows about each request.
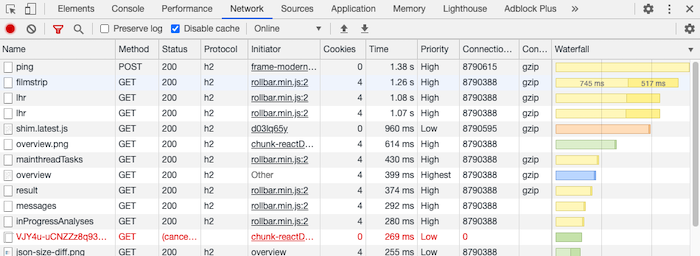
Right-click on the requests table to select the columns you want to see.
Connection ID
This column shows which server connection was used for each request. Ideally you want to avoid creating a new connection and instead use the same connection for many requests. This avoids the round-trips involved in establishing a new server connection.
If the Protocol column shows h2 for HTTP/2 then the browser can reuse the same connection for multiple concurrent requests.
Initiator
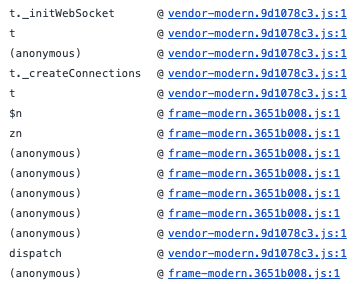
The initiator column explains why Chrome made the request. This could be because of an image tag in the HTML, or because of a fetch call in the JavaScript code. Click on the link in the column to see the relevant source code.
If you hover over the initiator of a resource that was loaded via JavaScript, you can see a call stack showing where the request was made.
Cookies
This column shows the number of cookies that were sent when making the request.
Content-Encoding header
This shows how the response body was compressed, e.g. using gzip or br (Brotli).
Priority
This column shows the priority of the request. The browser uses this information to strategically load resources. Priorities become particularly important when there is bandwidth competition among resources, however high priorities should not be overused.
Copy as fetch/cURL
This menu option generates code for making the selected request and copies it to the clipboard. For example, it can generate a browser fetch call or a cURL command that can be run in the terminal.
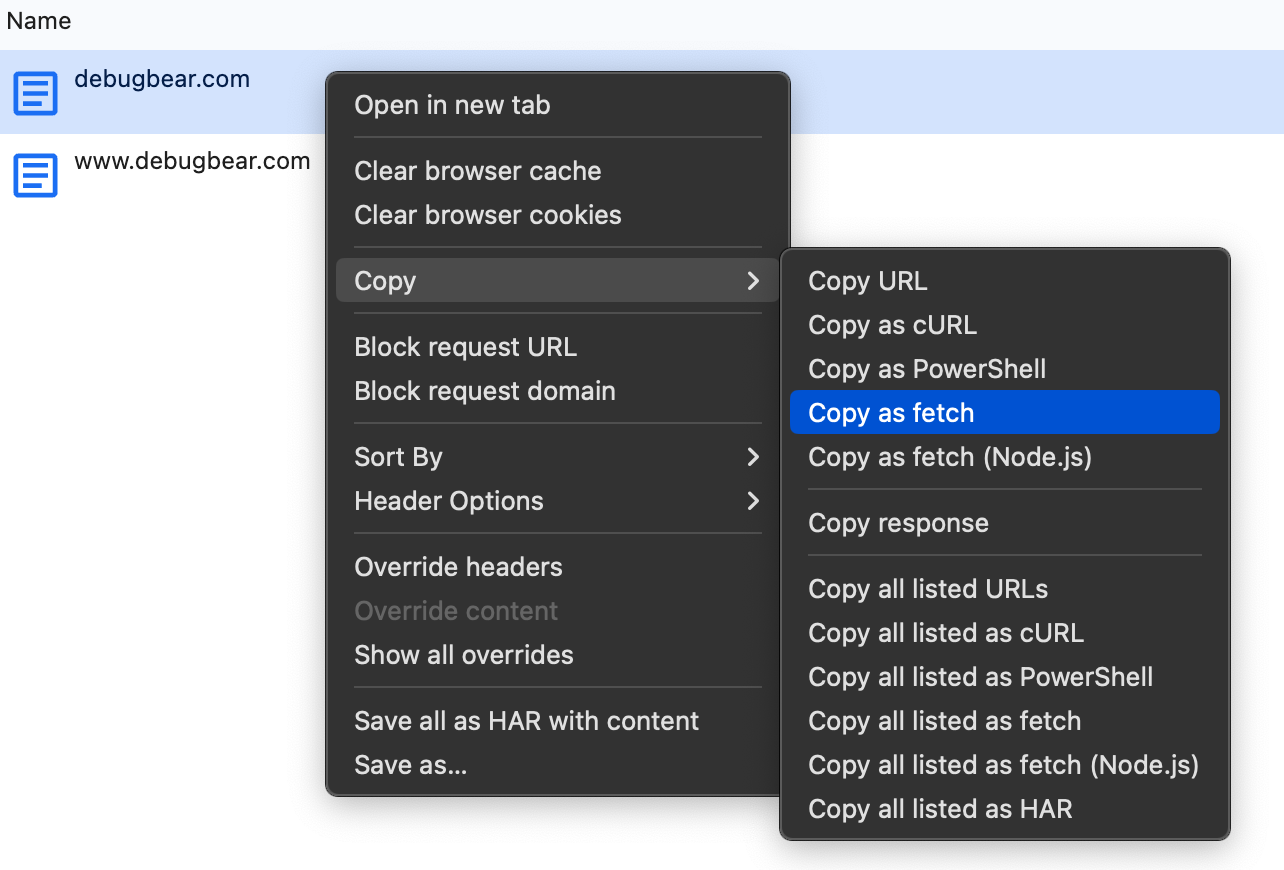
This is an example of a fetch call generated by Chrome DevTools:
fetch("http://example.com/", {
  headers: {
    accept:
      "text/html,application/xhtml+xml,application/xml;q=0.9,image/avif,image/webp,image/apng,*/*;q=0.8,application/signed-exchange;v=b3;q=0.9",
    "accept-language": "en-US,en;q=0.9",
    "cache-control": "no-cache",
    pragma: "no-cache",
    "upgrade-insecure-requests": "1",
  },
  referrerPolicy: "strict-origin-when-cross-origin",
  body: null,
  method: "GET",
  mode: "cors",
  credentials: "omit",
});
This feature is helpful when debugging failing requests in the front-end, or to make it easy for a backend developer to replicate a request error.
Highlight initiators
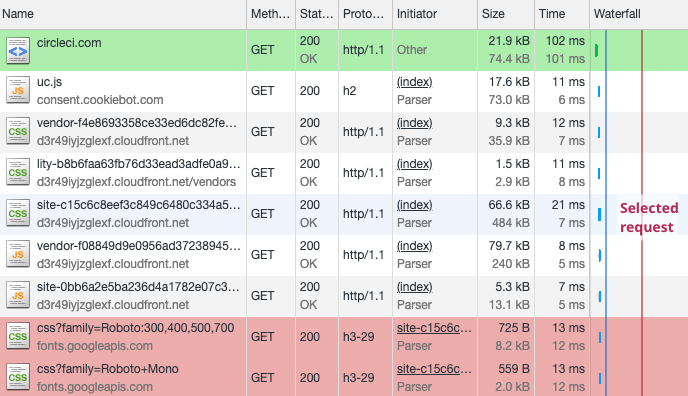
Hold the Shift key while hovering over the list of requests to see how different requests relate to each other.
The request's initiator is shown in green. Requests that it initiated are shown in red.
Export and import HAR
If you want to share more in-depth debugging information you can export an HTTP Archive (HAR) file that contains information about all requests made on that page.
Another developer can then investigate the issue on their machine and figure out what went wrong.
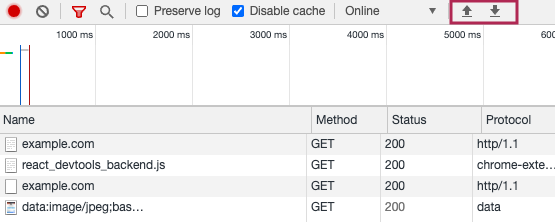
The import/export HAR buttons are in the top right corner of the network tab.
Viewing request headers and response status
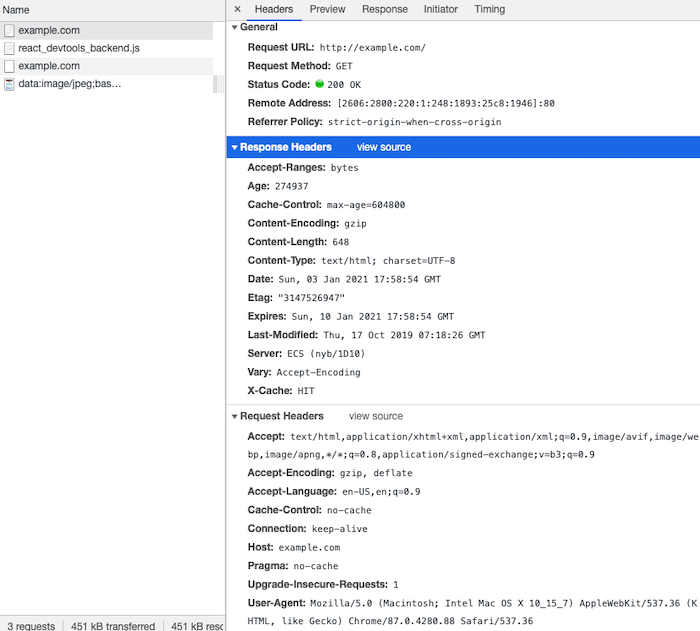
Click on each request to view the request headers as well as the response headers and status returned by the servers.
Here you can see what cache settings the server provided, or what cookies were sent along with the request.
Filtering requests
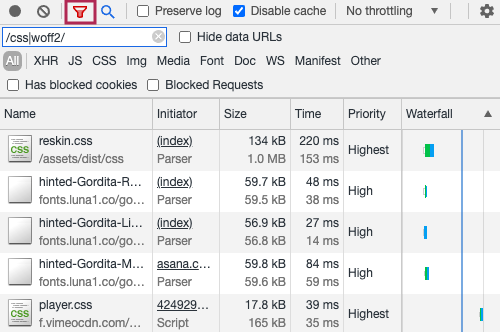
Click on the funnel icon to search the list of requests or only show specific request types.
The search filter supports regular expressions, so if you want to see both CSS and font files you could use /css|woff2/ as a filter.
Full text search
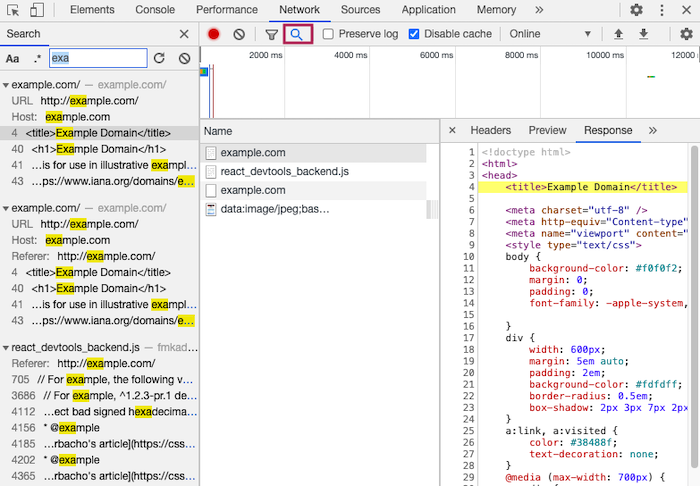
You can search the response text of all page requests using the search feature. Click on the magnifying glass to the left of the "Preserve log" checkbox to start a search.
Get more detailed network data
You can use DebugBear's synthetic monitoring and testing to get a more detailed analysis of your website performance.
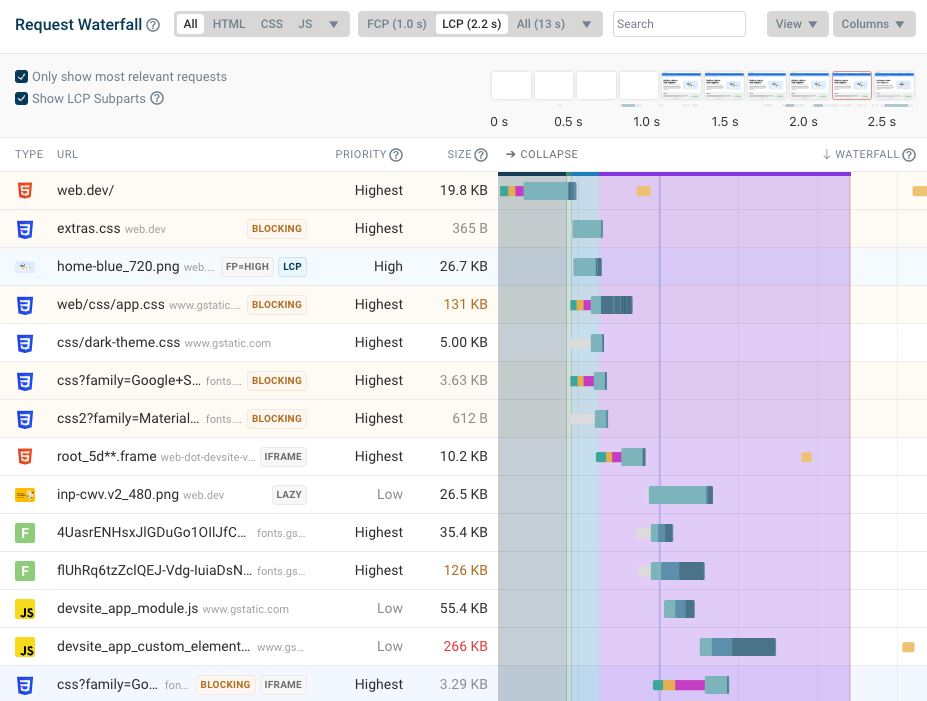
The detailed request waterfall shows you exactly what resources are loaded, which requests are prioritized, and how different resources relate to each other and your website's rendering progreess.
Monitoring site speed over time
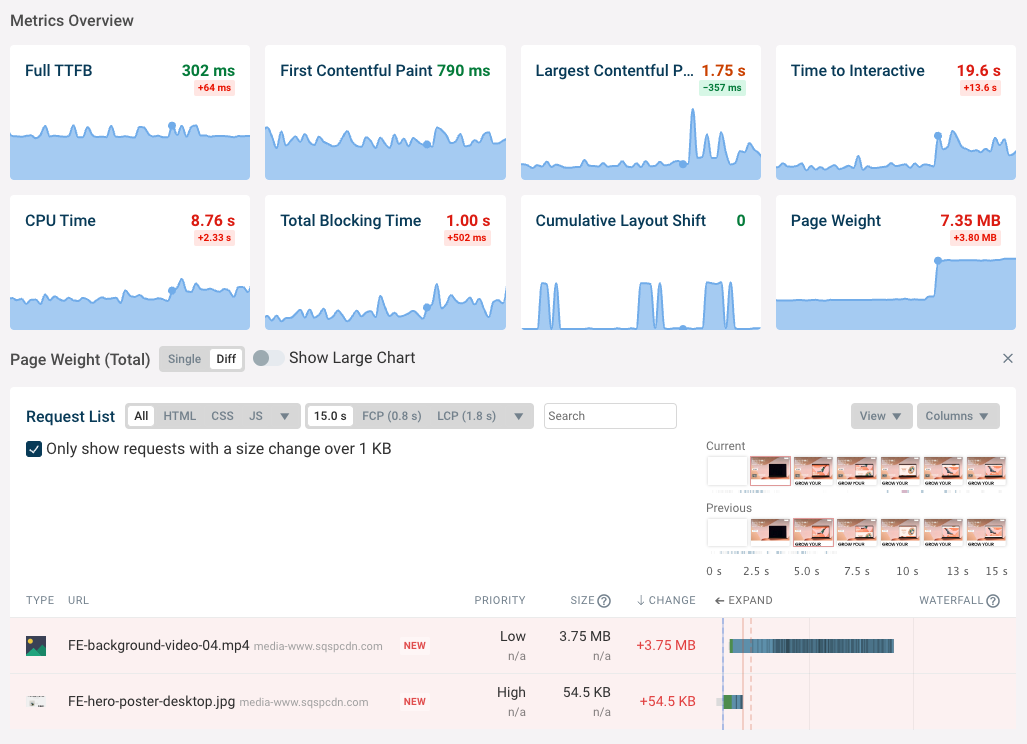
DebugBear is a website performance monitoring service that continuously tests your website and alerts you when something goes wrong.
We also provide in-depth debug data to help you speed up your website and understand performance regressions.
Monitoring your website performance in a controlled lab environment is useful, but we also offer a real user monitoring solution that tracks how your site performs for actual users. Because the data comes from real user sessions, you can track metrics that you wouldn't be able to measure in a lab environment, like Interaction to Next Paint and even bounce rate.
