
GTmetrix is a well-established product in the website performance monitoring space. However, with Google's shift to focus on Core Web Vitals you may want to consider other options to get better reporting and pass Google's web vitals assessment.
In this tool we'll look at what alternatives are available on the market and how they compare to GTmetrix.
What to look for in a GTmetrix alternative
When looking for a tool for testing and monitoring website performance you should be looking at three different types of data:
- Synthetic tests: lab-based tests with in-depth reporting and recommendations
- CrUX data: the real-world Chrome user data Google uses for rankings
- Real user monitoring: detailed performance data across your entire website
GTmetrix has long supported synthetic tests and recently started to incorporate CrUX data.
However, it doesn't support real user monitoring. That's a problem, as CrUX data takes 28 days to fully update and doesn't provide the detailed reporting you need to fix INP issues on your website.
DebugBear: Comprehensive Core Web Vitals data
DebugBear is a web performance monitoring service with a focus on Google's Core Web Vitals. You can run synthetic tests from 20+ global locations, track Google CrUX data, and get detailed web vitals reporting based on real visitors on your website.
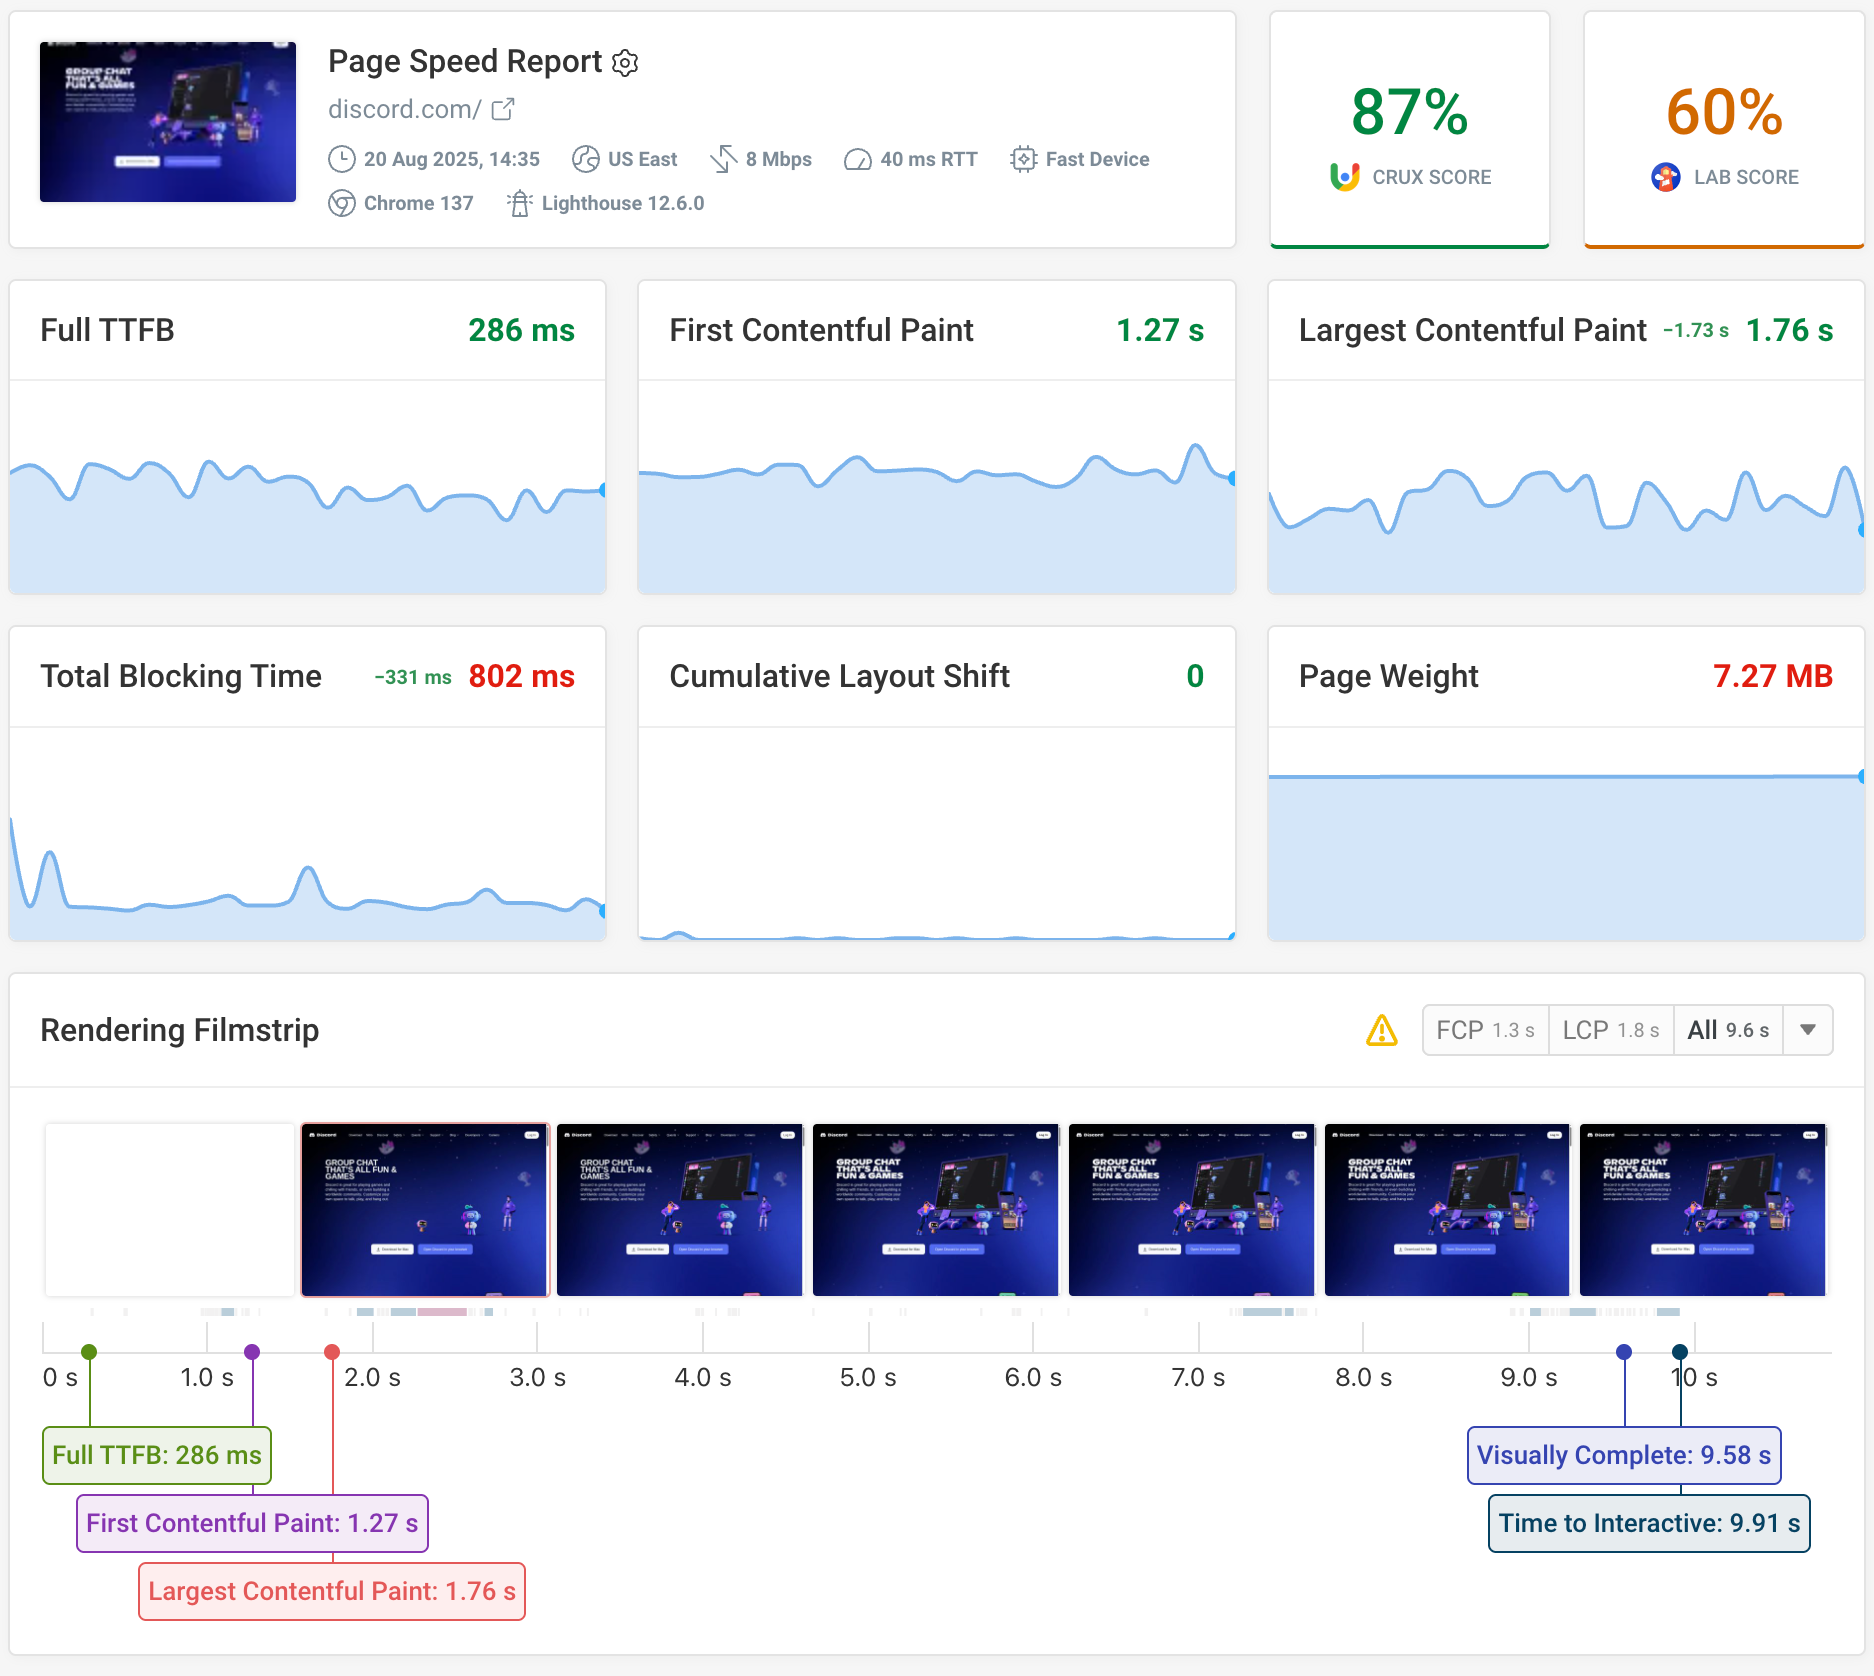
You can track your metrics over time and investigate the loading speed of your website. Like GTmetrix, DebugBear is built around Google's Lighthouse tool, allowing you to track your overall Lighthouse performance score.
Each test result also includes the Chrome User Experience Report data that impacts rankings, as well as a visual rendering filmstrip and video showing you how visitors experience your website.
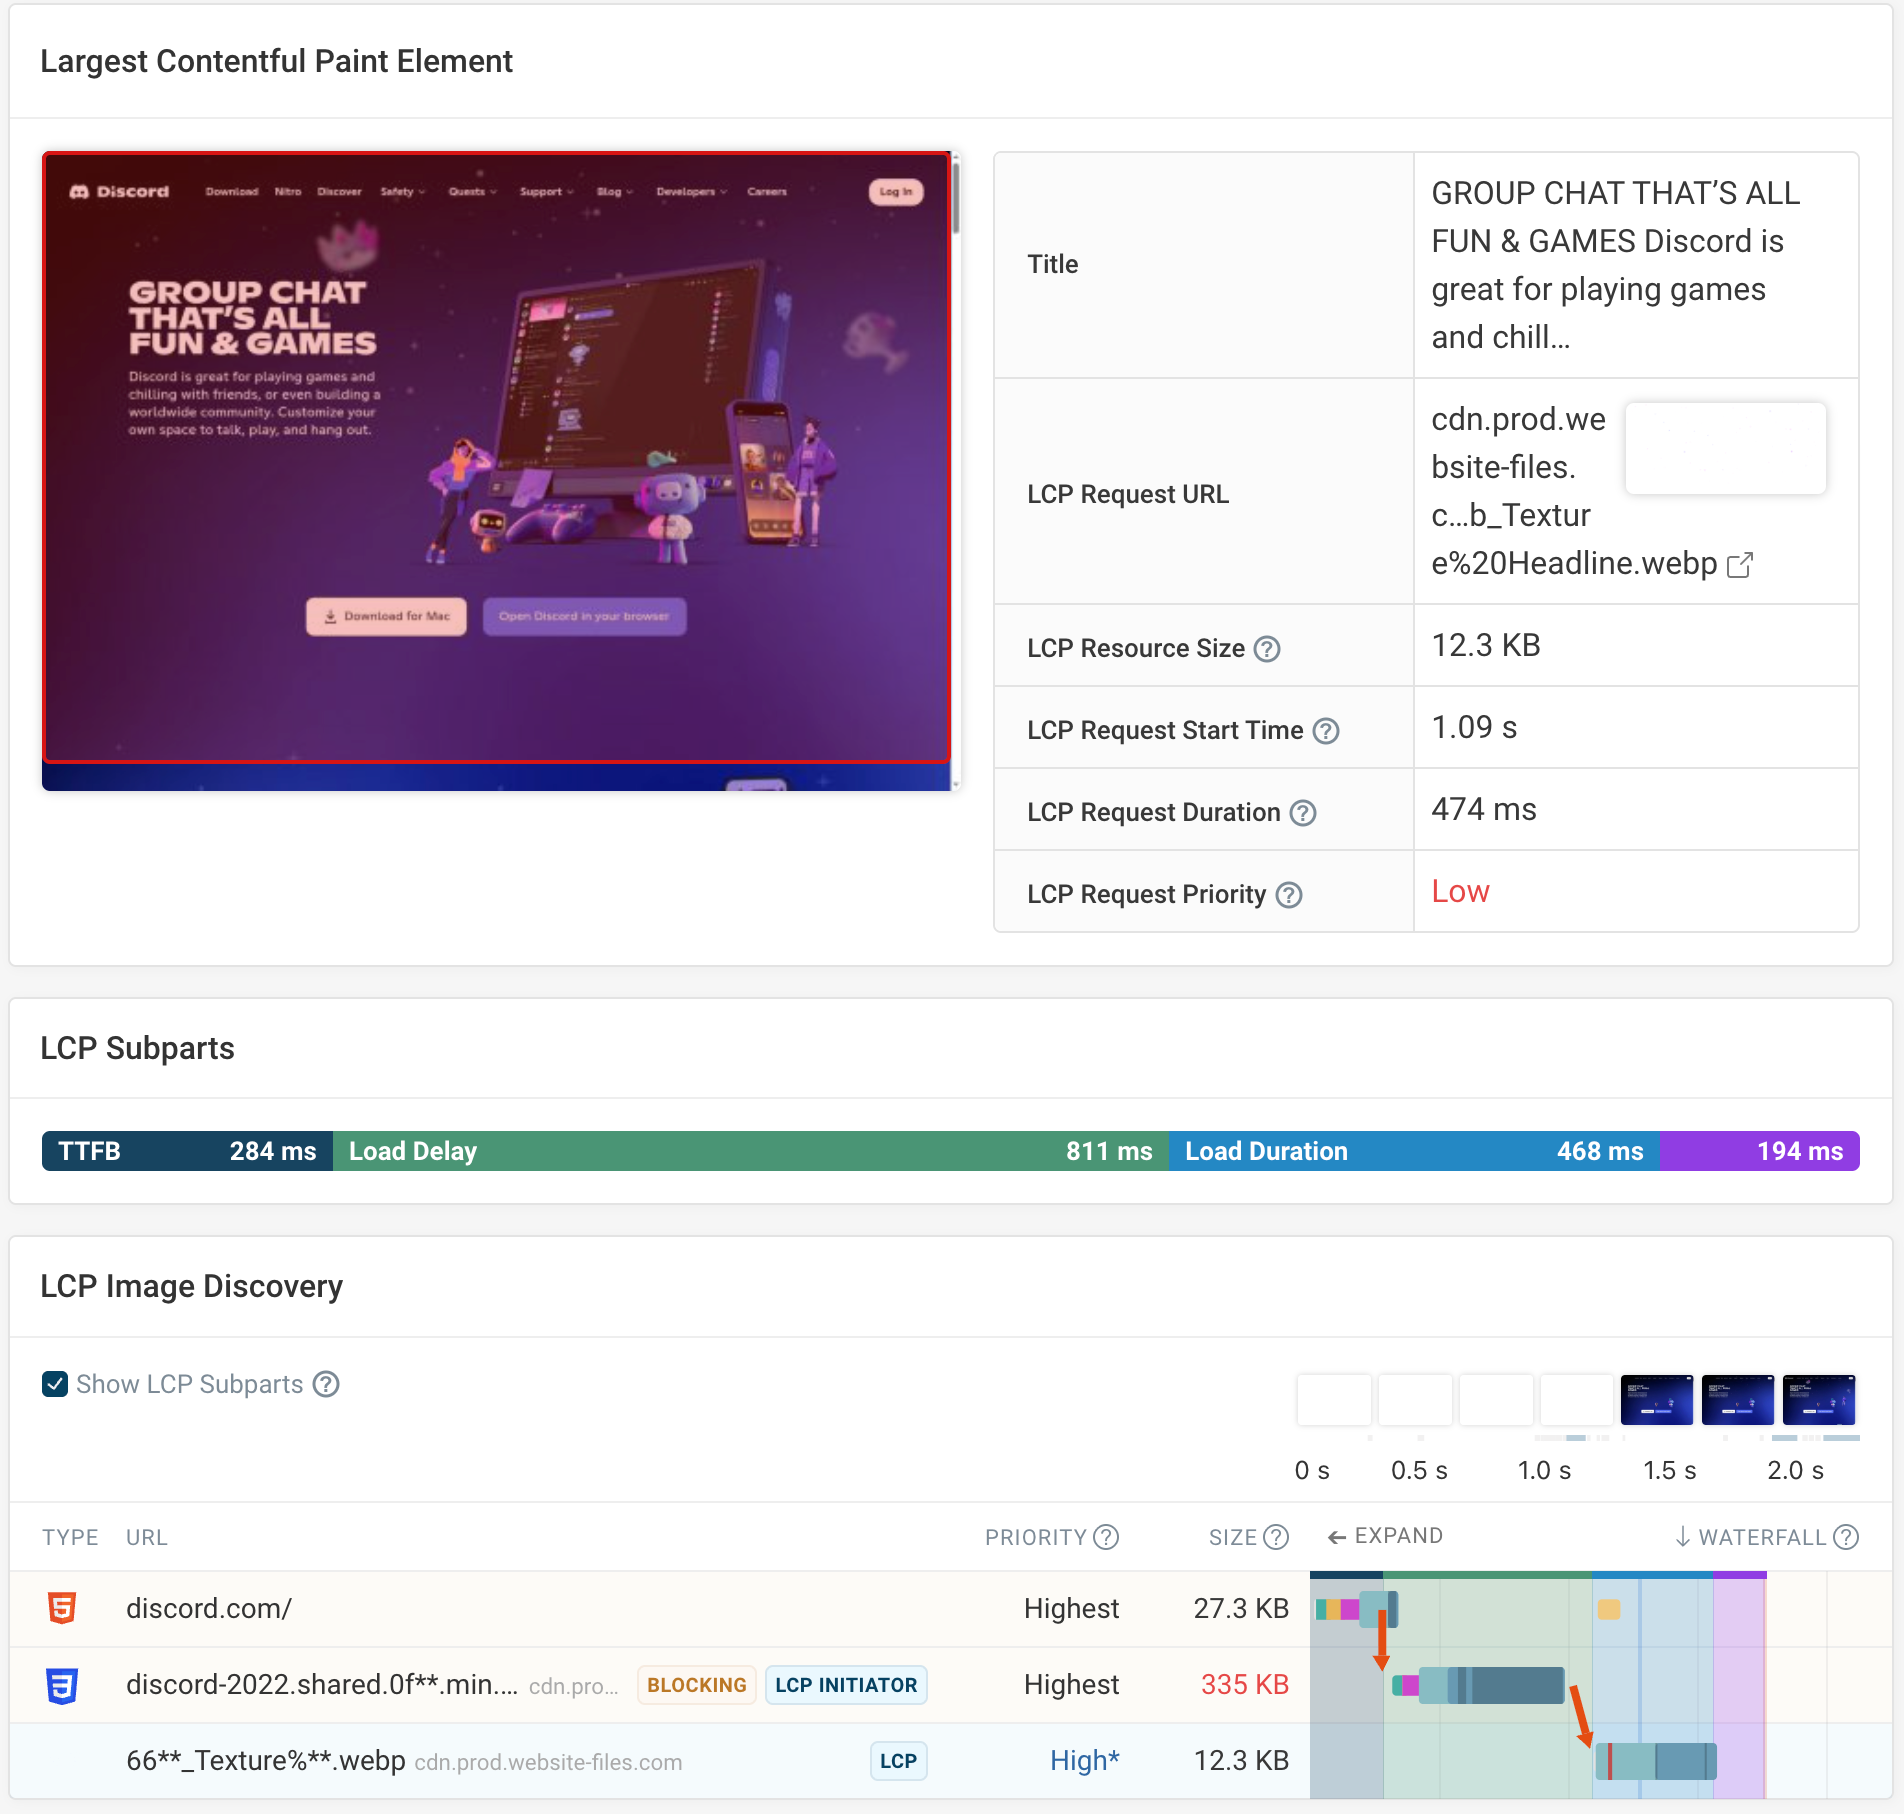
You can click on each performance metric to get more insight into how to optimize it. For example, when you expand the Largest Contentful Paint score you can see what the LCP element was, what subparts contribute to the overall metric value, and a request waterfall showing you how the LCP image is loaded.
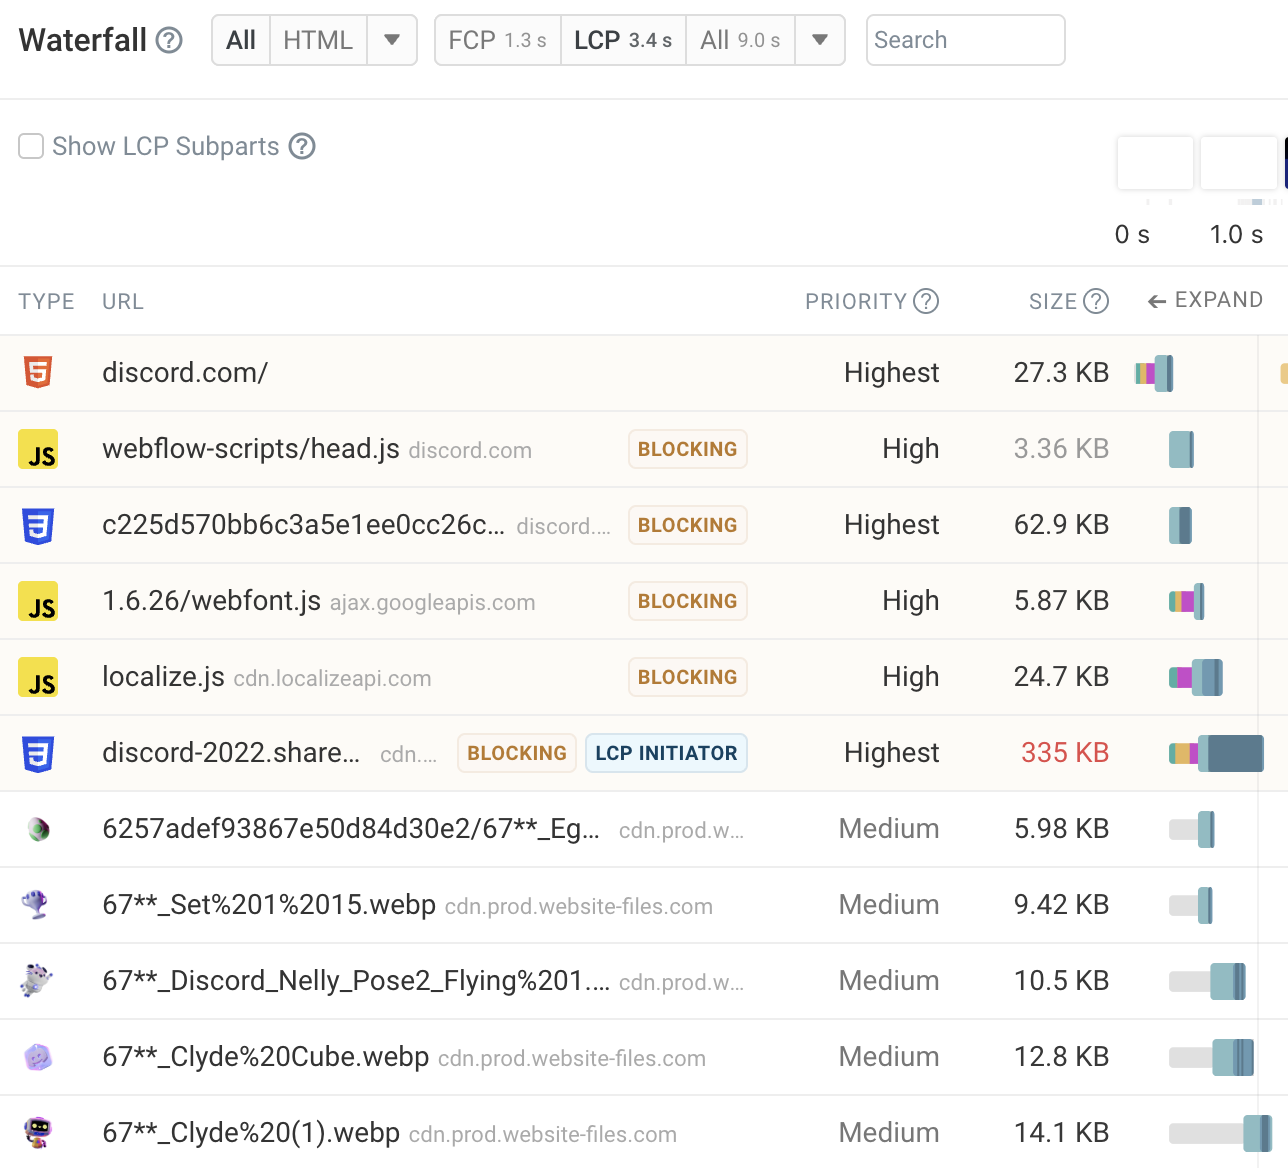
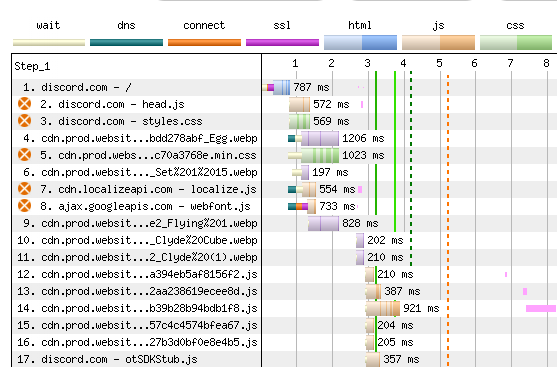
There's also a more detailed waterfall view that shows you render-blocking stylesheets and scripts, request priorities, as well as other requests that impact the loading process.
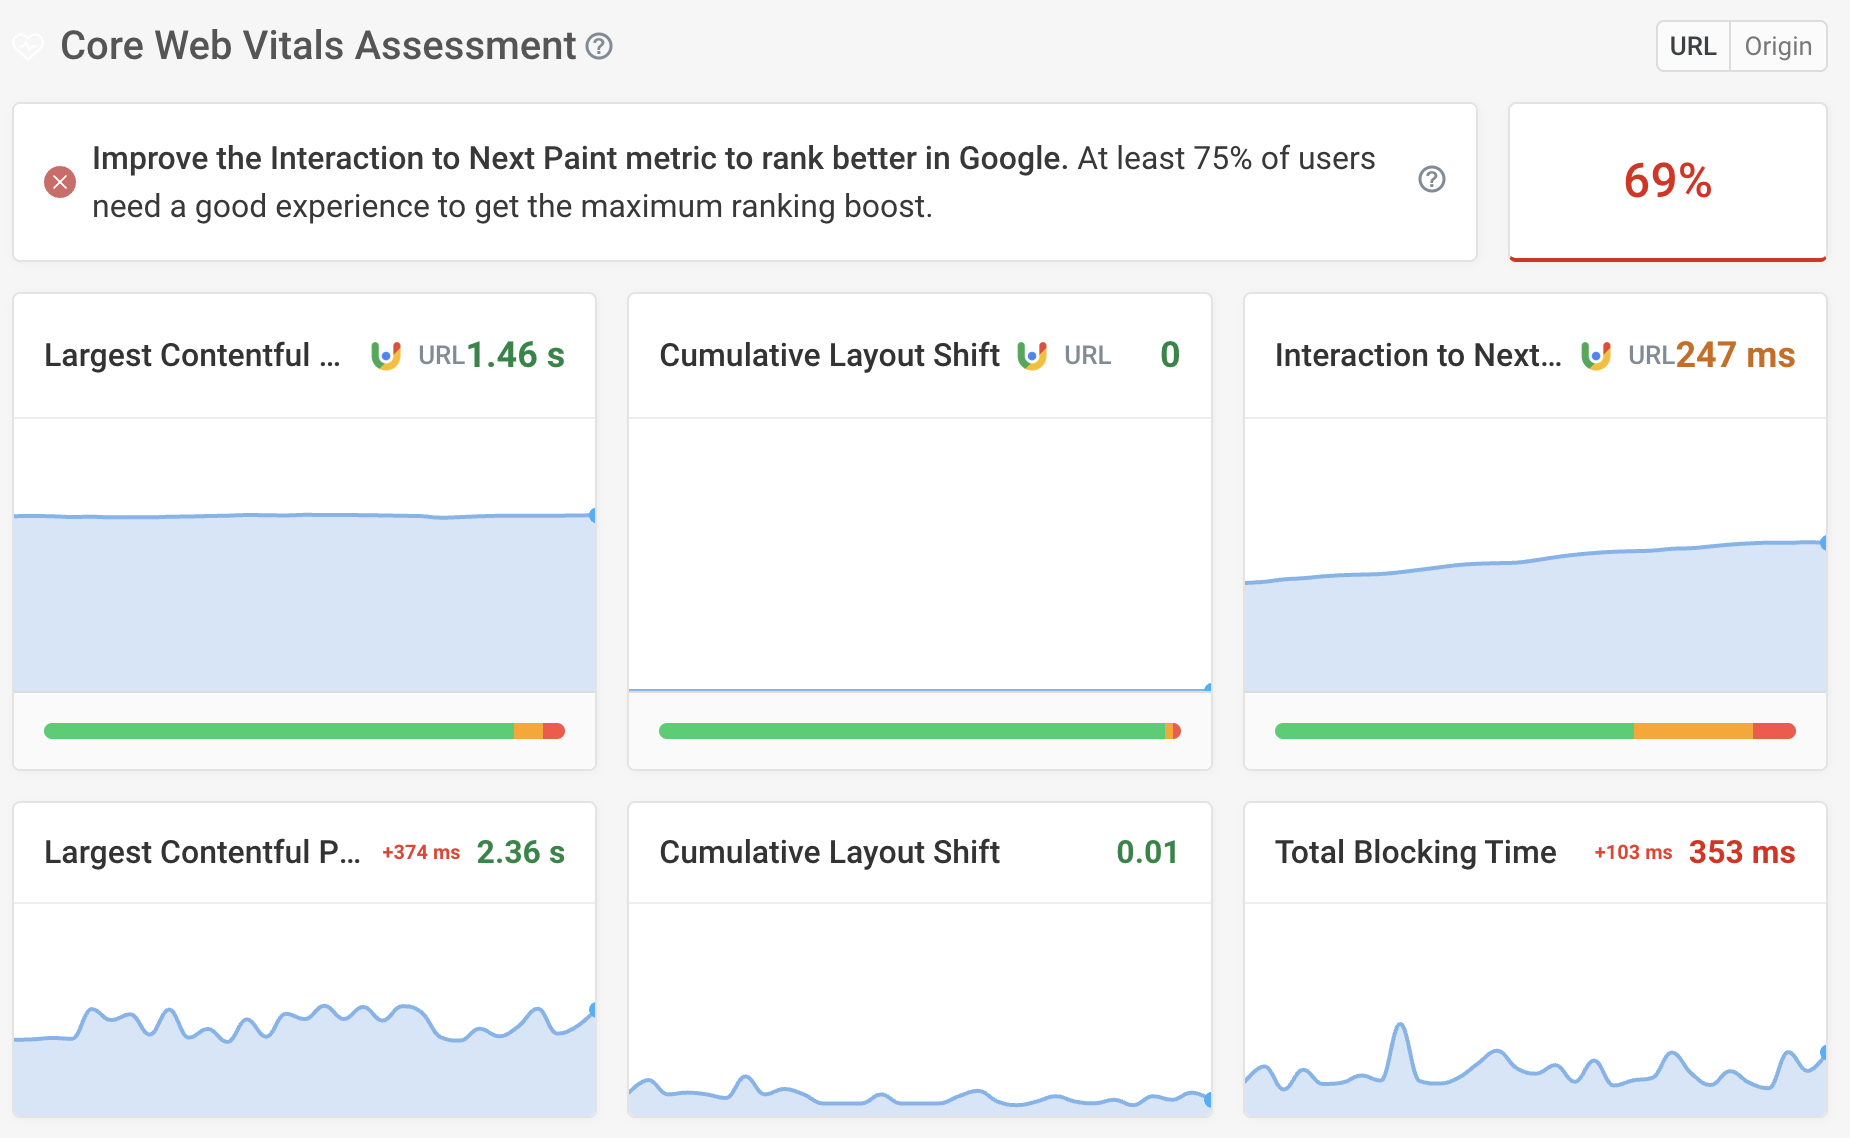
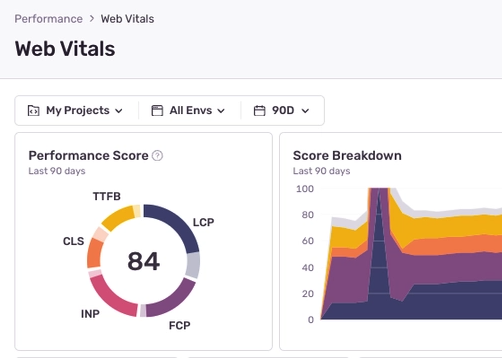
You can see more detailed CrUX data in the Web Vitals tab. After a change in the synthetic test results you'll often see a gradual change in the CrUX data. That's because it always covers a 28-day rolling period.
Beyond scheduled synthetic tests, DebugBear also offers real-user monitoring (RUM) where you collect data on actual visitor experiences with an analytics script on your website.
The high-level RUM dashboard shows you how your website is doing overall as well as how fast your most visited pages are.
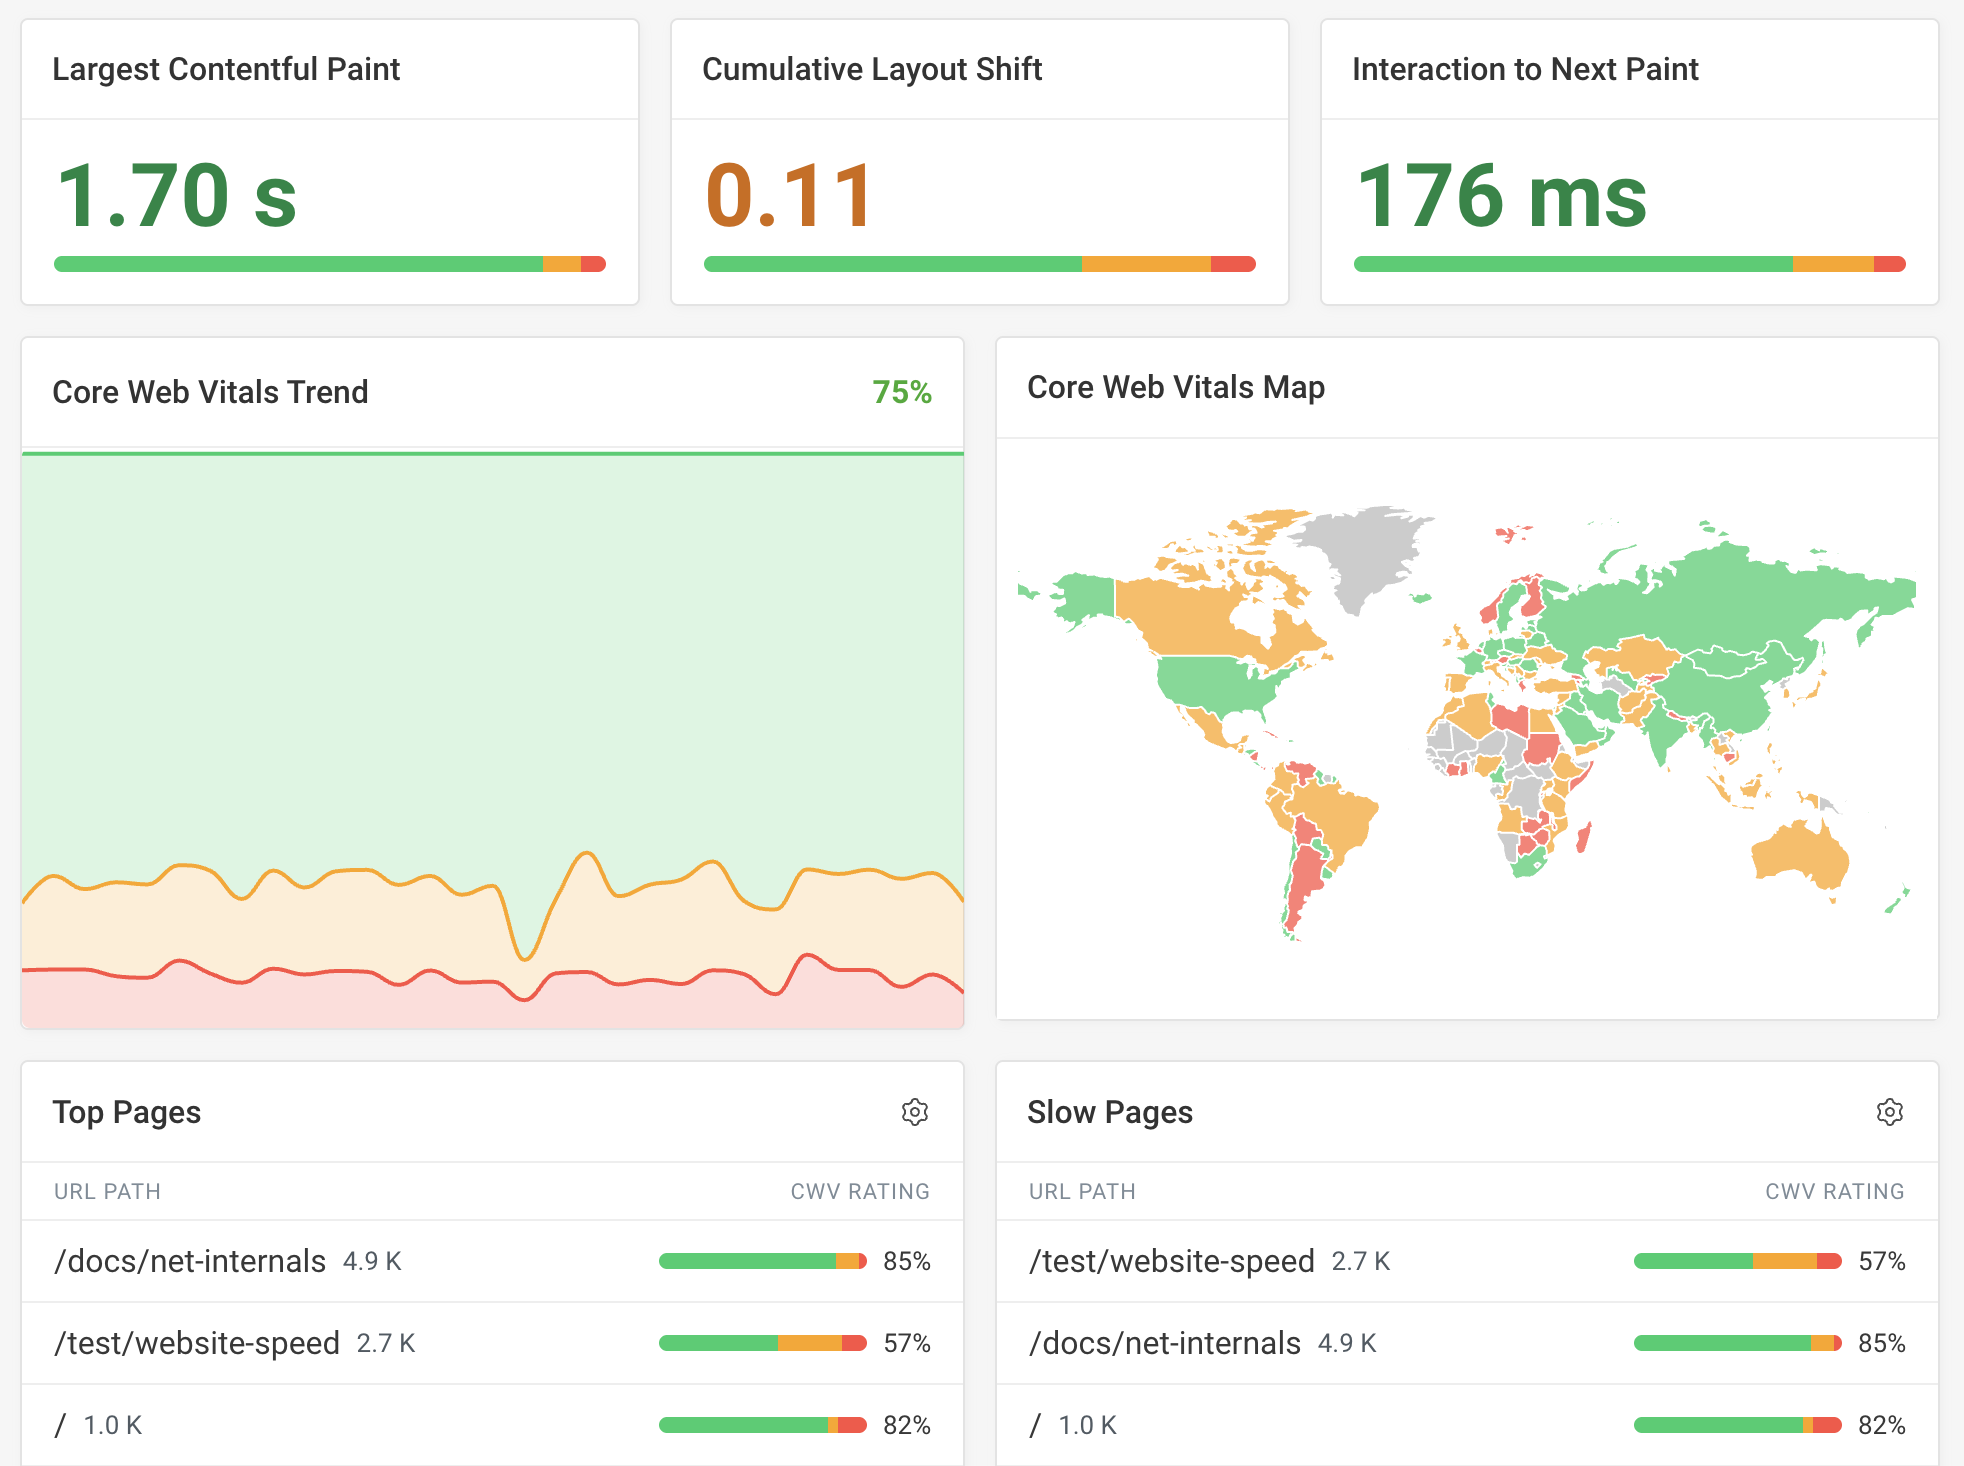
Each web vitals metrics then provides a more detailed dashboard to debug performance issues in more depth and see how data varies between visitor segments.
You get a global view of your website speed by country or break data down by device type and many other page view properties.
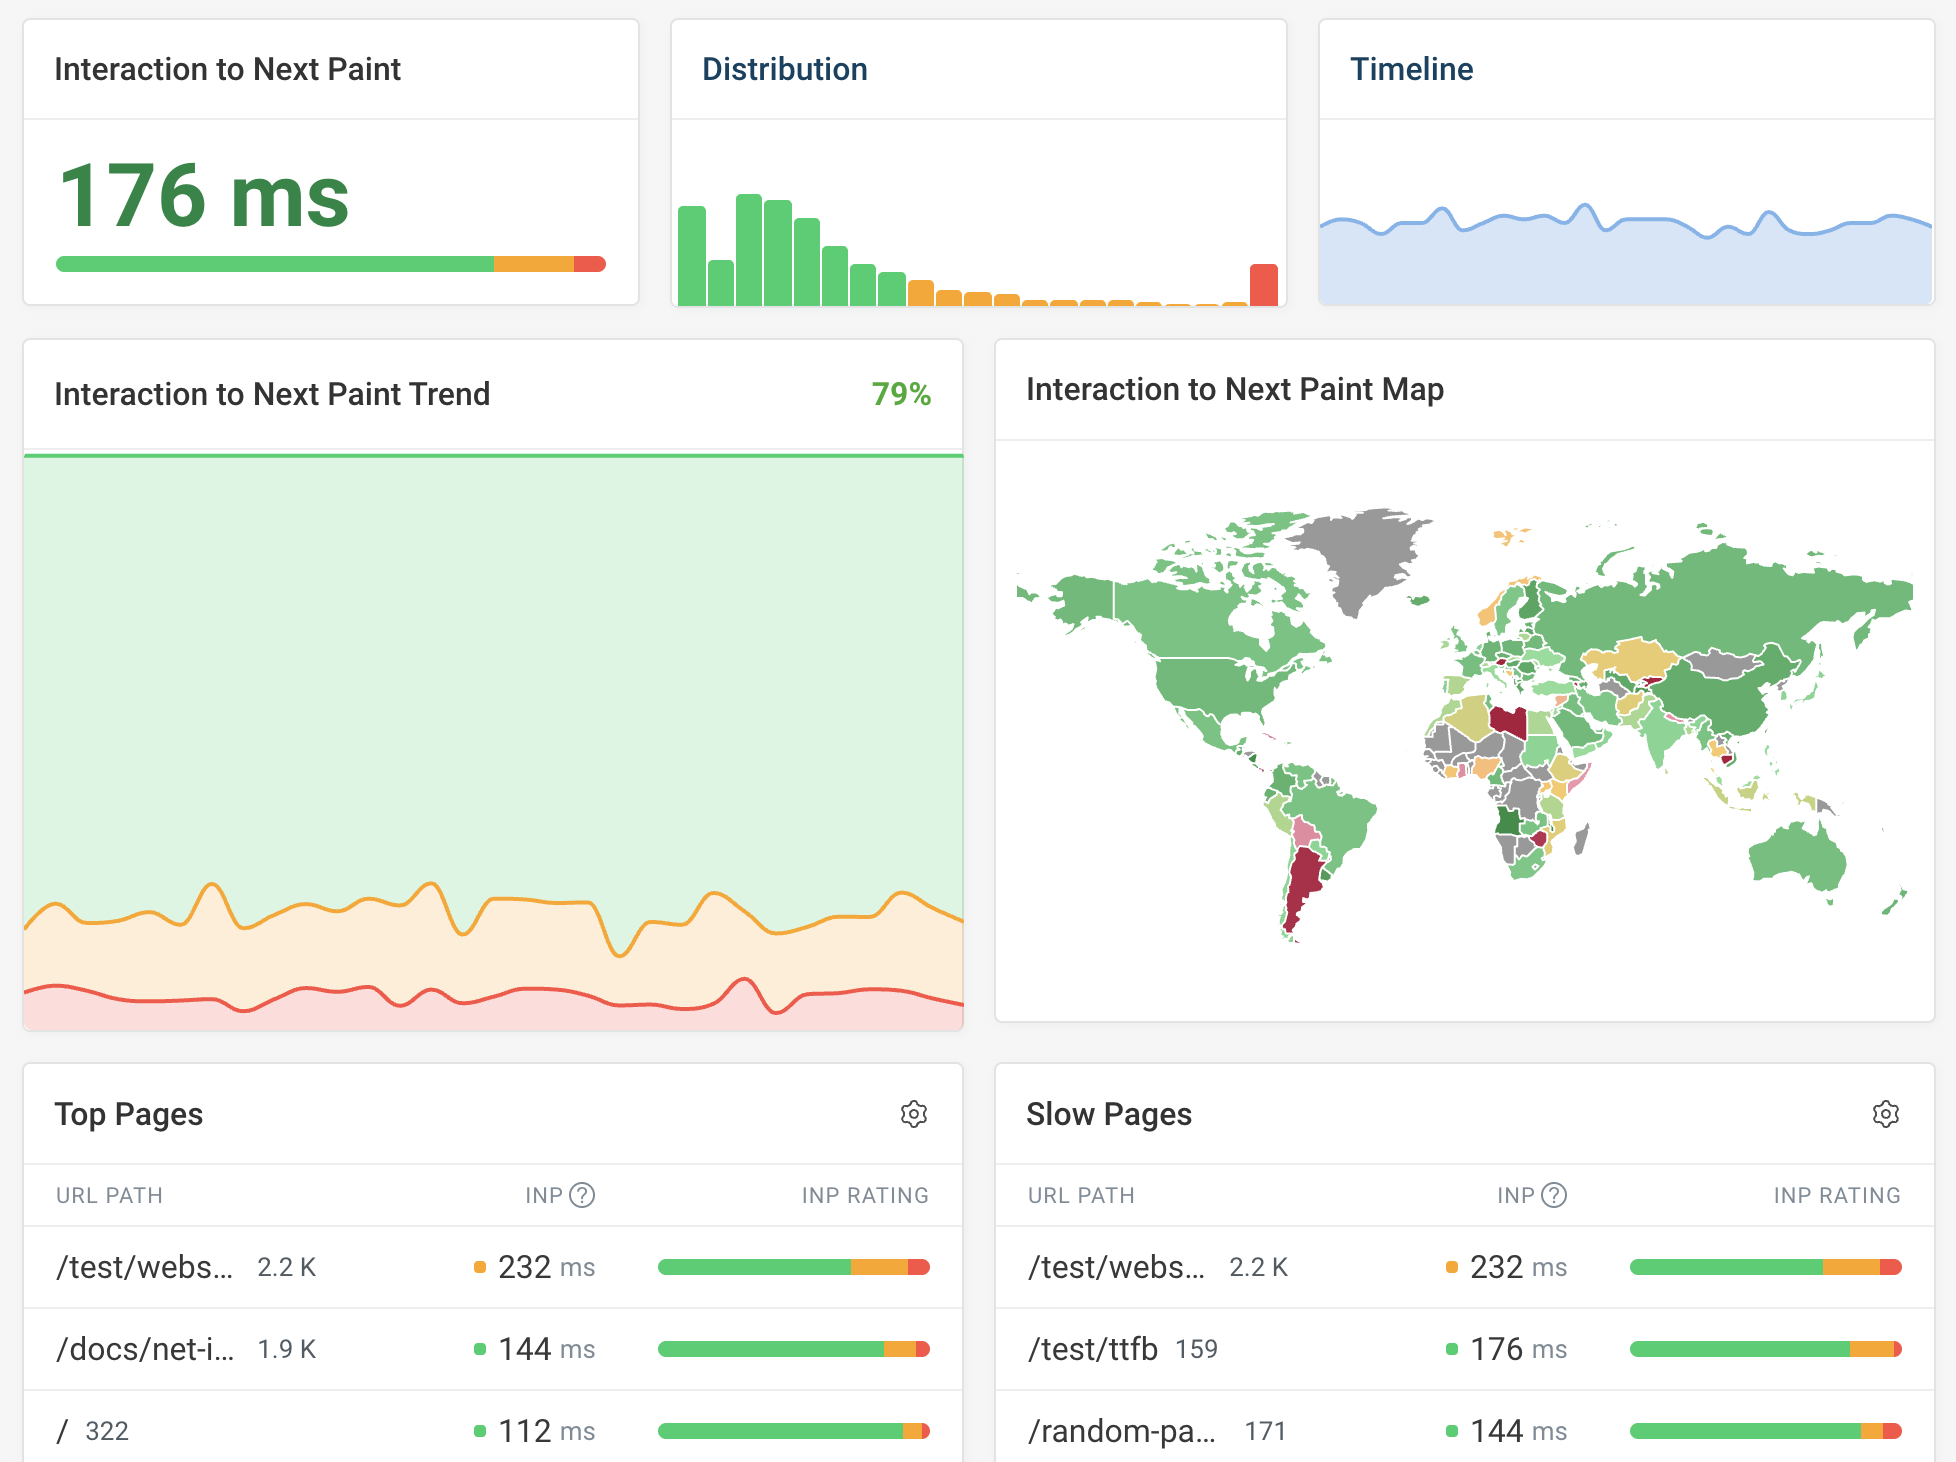
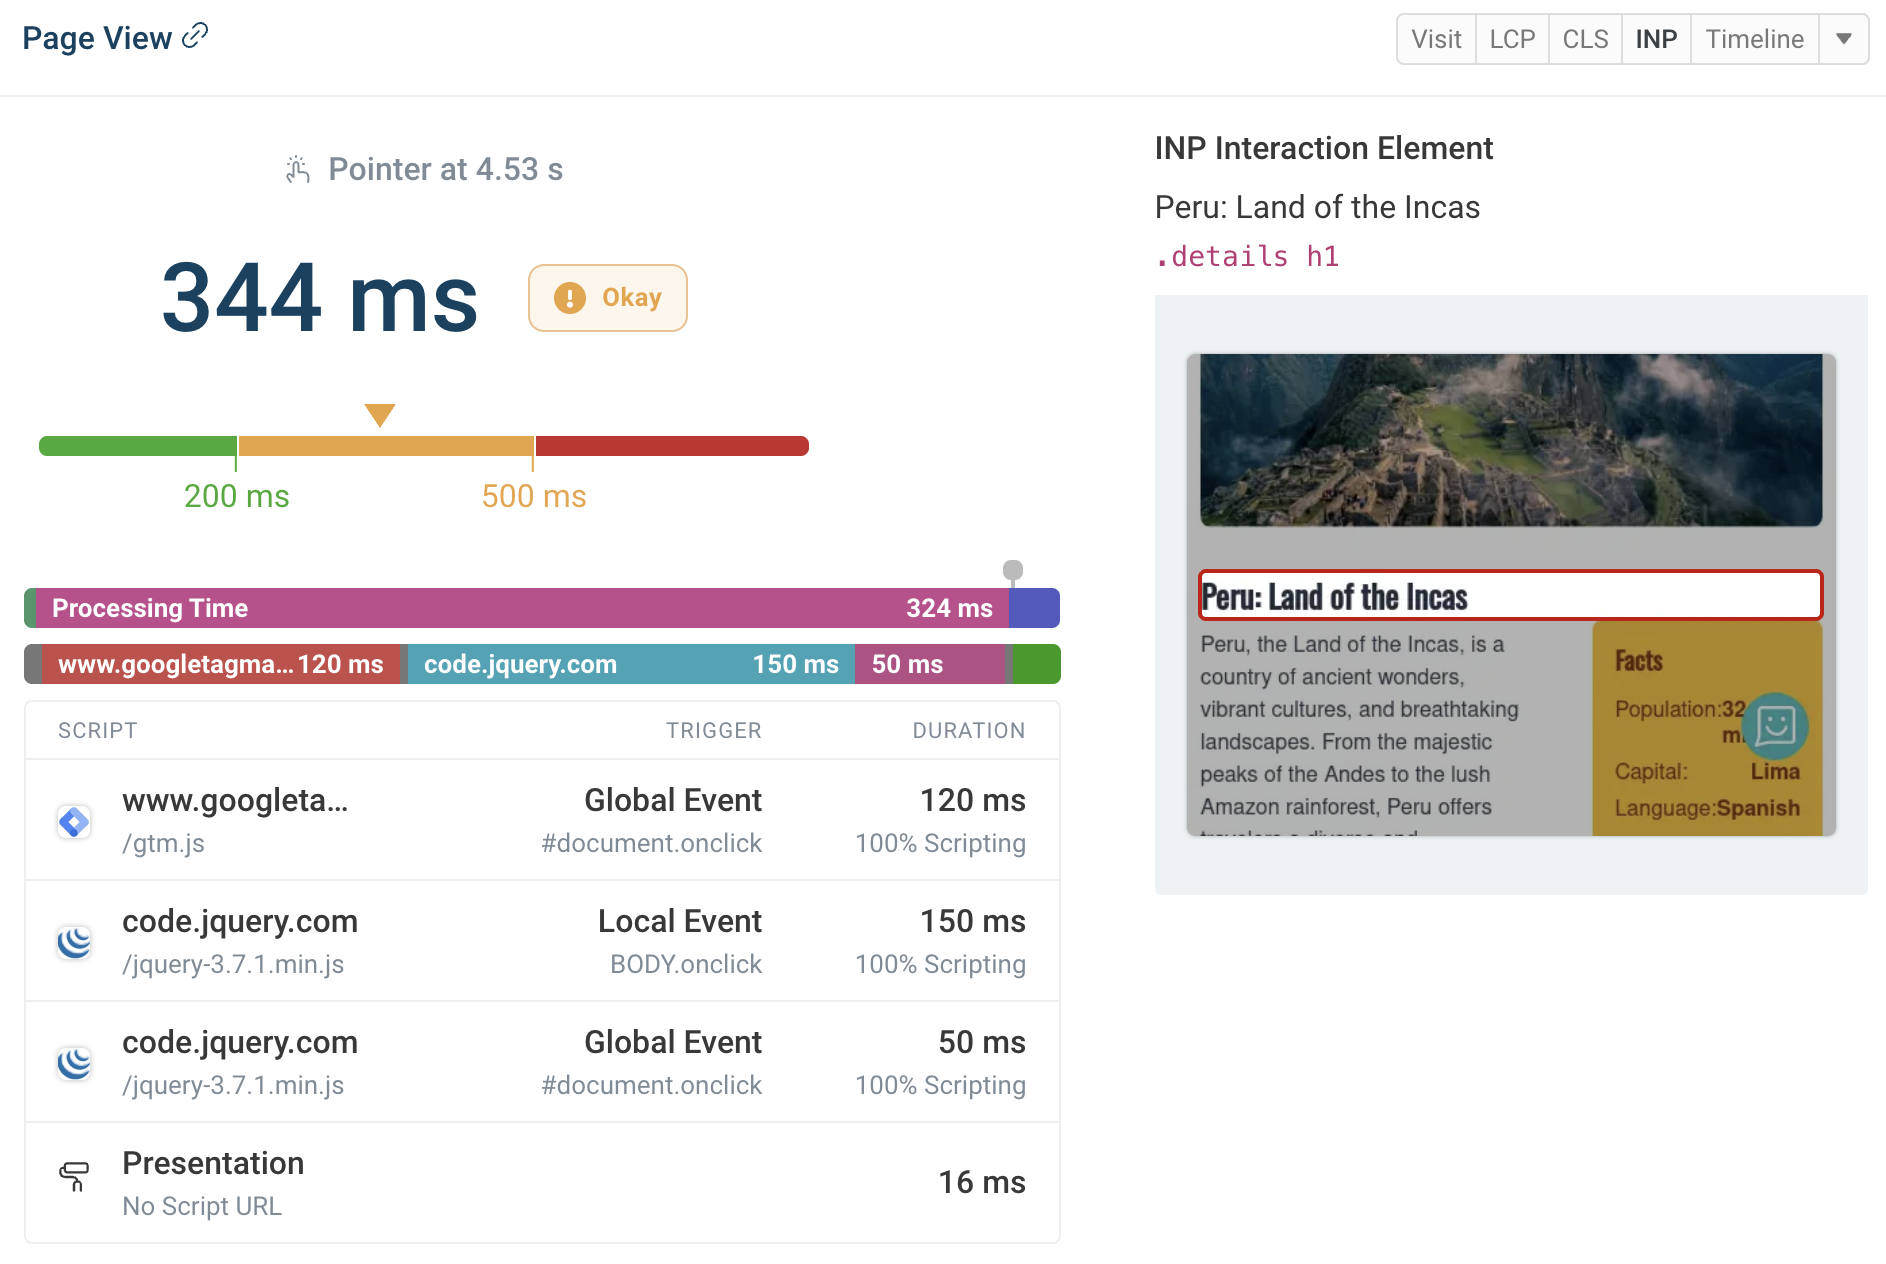
Lab data isn't enough to fix Interaction to Next Paint issues, as they depend on a user interaction. DebugBear provides detailed reporting on INP scores:
- What pages have poor INP scores?
- What page elements have poor INP when users interact with them?
- What scripts are running during the interaction and why?
Additional key features of DebugBear are:
- Configurable regression alerts by email, Slack, and MS Teams
- Test result comparison to debug regressions
- Custom recommendations that go beyond Lighthouse audits
- Page speed experiments to try optimizations without deploying code
Overall, DebugBear is a more modern and comprehensive tool than DebugBear. However, pricing is higher than GTmetrix, with plans starting from $125/mo. However, DebugBear does offer a free 14-day trial.
PageSpeed Insights: Quick performance checks
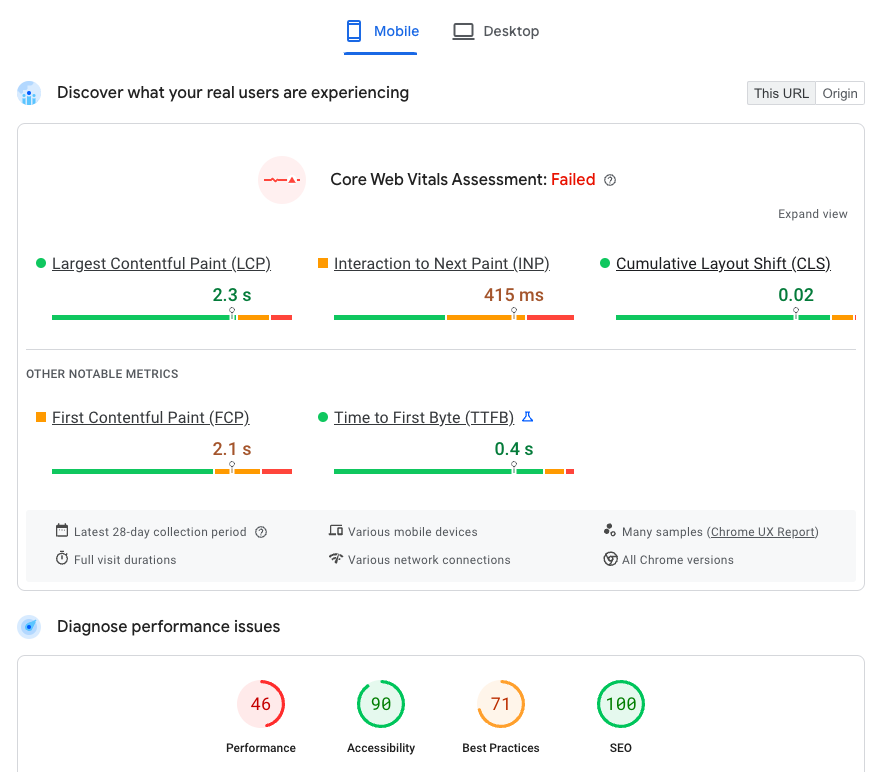
If you just need to run occasional checks on your website, Google's PageSpeed Insights tool is a good place to go. Like GTmetrix, PageSpeed Insights is based on Lighthouse and provides performance recommendations tailored to your website.
One of the most useful features on PageSpeed Insights is the real user data at the top of the report, which tells you whether the page is failing or passing the web vitals assessment. A failed assessment can cause your site to rank lower in Google.
PageSpeed Insights does not provide ongoing monitoring, but you can use the PageSpeed Insights API to trigger tests programmatically and keep track of the results.
The lab data in PageSpeed Insights can be less reliable than what you get from commercial tools like GTmetrix or DebugBear. That's because it's based on simulated data rather than a direct measurement.
SpeedCurve: Synthetic and real user monitoring
Another great alternative to GTmetrix is SpeedCurve. It covers both scheduled synthetic tests and real user metrics. However it does not report Google CrUX data.
SpeedCurve is well-designed and provides detailed reporting to help you understand your website performance and perform in-depth technical investigations to address page speed issues.

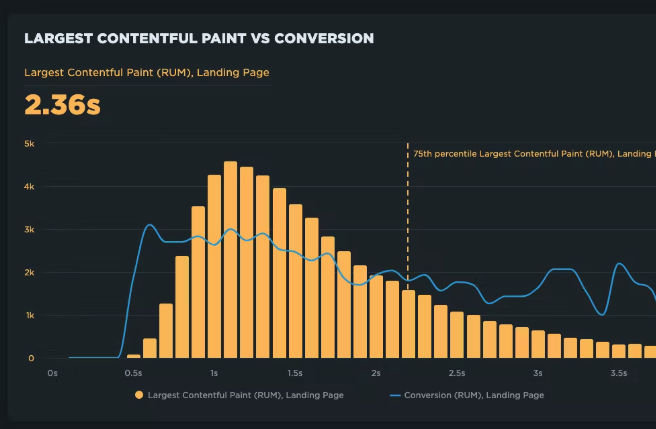
Unlike other real user monitoring solutions, SpeedCurve can track your visitor sessions across your website and track when conversions happen.
These business outcomes can then nicely be correlated with page load performance.
SpeedCurve pricing starts at $15/mo for synthetic monitoring and $83/mo for real user monitoring.
WebPageTest: Detailed technical reports
If you want highly technical reports that are highly customizable, WebPageTest offers a great solution. You can select different locations to run tests from, test your website speed in different browsers, and configure browser settings and user flows.
WebPageTest results include both lab data and CrUX metrics. The request waterfall is extremely detailed, although it can sometimes be difficult to use.
You can use WebPageTest through an API or set up scheduled tests through Catchpoint. WebPageTest provides a free option as well as plans starting at $18 per month.
Sentry: website monitoring for developers
Sentry is an application monitoring tool for developers. It can track both front-end Core Web Vitals and backend server performance. However, it does not offer scheduled synthetic testing.
In addition to performance monitoring, Sentry also provides error tracking and uptime monitoring.
While Sentry is a great tool for developers to manage performance, it does not directly compete with GTmetrix due to its lack of lab-based testing. However, real user data is what ultimately matters, and you can run lab tests with free tools like PageSpeed Insights, WebPageTest, or the DebugBear website speed test to get performance analysis and recommendations.
Sentry offers a free tier with paid plans starting from $29/mo.
How to compare GTmetrix alternatives
There are many website performance tools on the market, and we've looked at 5 of them in this article. How do you pick the right one for you?
A first step is to check what your requirements are? Do you want to monitor marketing pages for Core Web Vitals or collect performance metrics for a web application? Are you looking for a cheap option or for a more advanced tool? Should the tool be integrated with the rest of your IT monitoring infrastructure?
Based on that you can pick different services to try out. Most of these tools offers a free trial.
Features to look for
When looking for an alternative monitoring tool to GTmetrix here are a few questions to consider:
- What types of data is provided? Synthetic/CrUX/RUM?
- Is there a detailed request waterfall for debugging?
- What test locations are available for synthetic tests?
- Does the tool include Lighthouse scores and recommendations?
- Can you set up custom regression alerts?
- Can you compare test results if a regression is reported?
- Does the tool support all three Core Web Vital metrics?
- Can you benchmark your website to competitors?
- What tool provides the most intuitive setup and reporting UI?
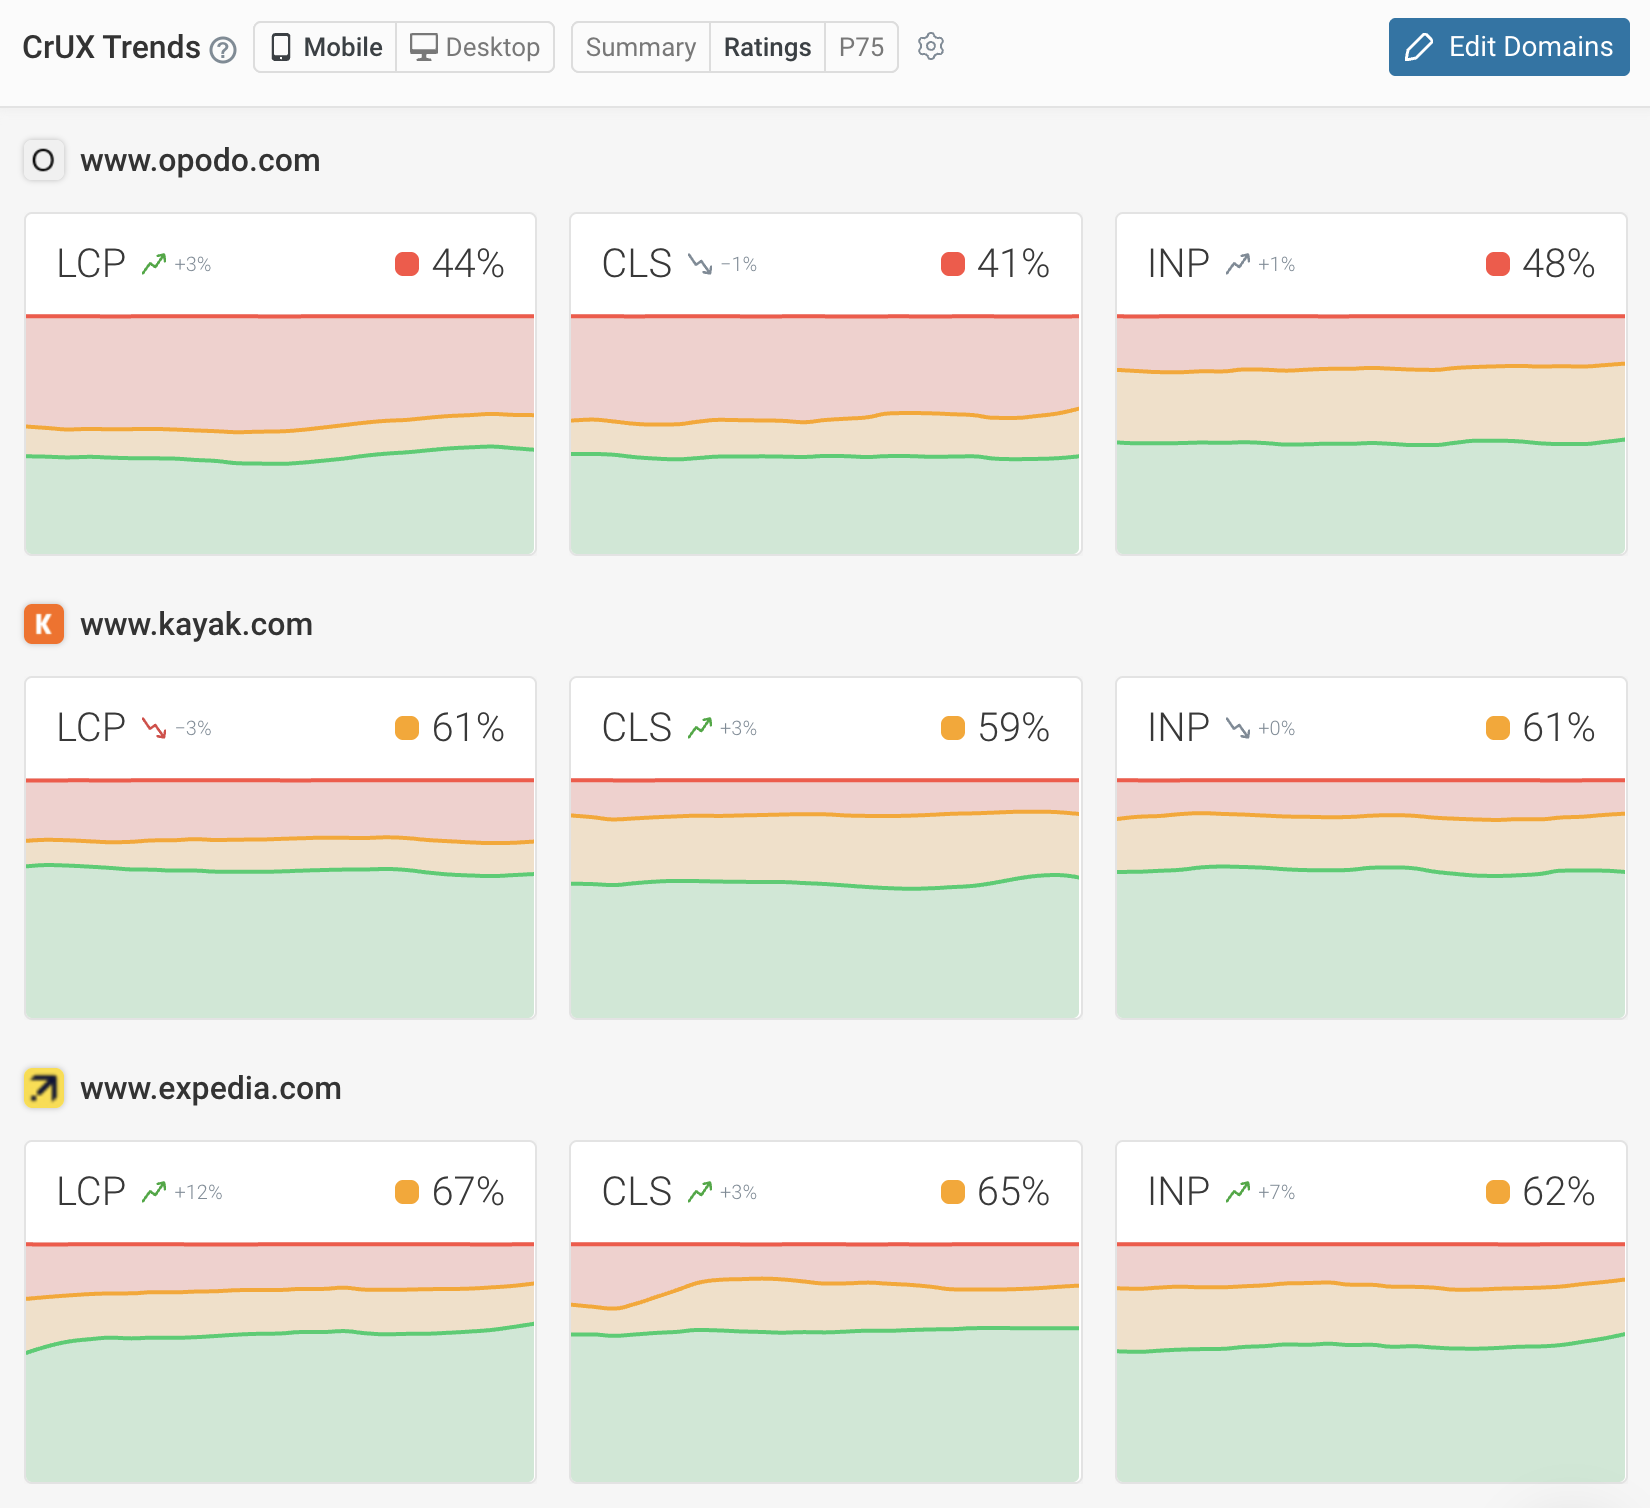
For example, DebugBear provides website performance benchmarking in your industry based on synthetic metrics or CrUX data. You can see how you're ranking and how your performance is trending over time. Being the fastest brand in your industry can help you get more organic traffic from Google.
Speed up your Core Web Vitals
If you're trying to improve Google's web vitals metrics, DebugBear is a modern GTmetrix alternative built for exactly that.
Get high-level reporting to see how your website is doing, as well as detailed technical insight to enable your development team to fix issues quickly.


Monitor Page Speed & Core Web Vitals
DebugBear monitoring includes:
- In-depth Page Speed Reports
- Automated Recommendations
- Real User Analytics Data