
Pingdom provides a free page speed testing tool to check your website performance. Find out how it works, how to interpret its performance recommendations, and what other tools you can use to test your website speed.
What is the Pingdom Speed Test?
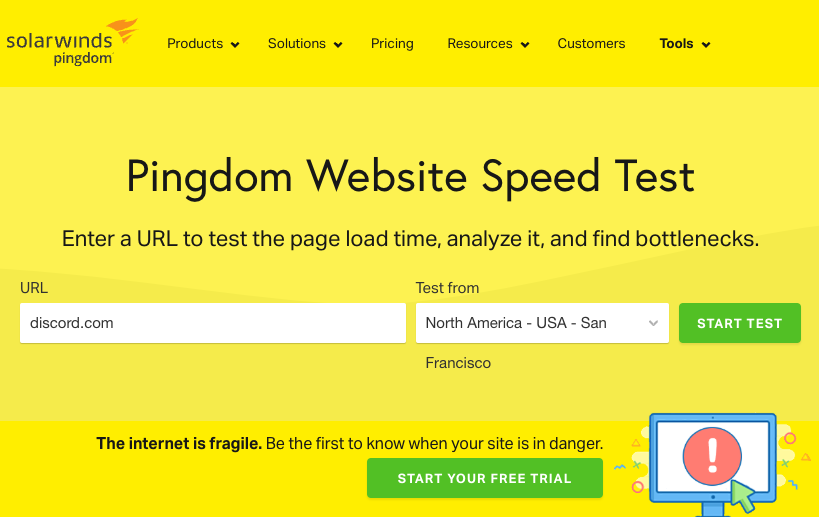
Pingdom's site speed test is a free tool that you can use to measure the loading speed of your website. Just go to tools.pingdom.com, enter your website URL, and click Start Test.
Pingdom will open your website in Chrome, collect performance metrics, and identify potential improvements.
Once the test is complete, Pingdom reports the following details at the top of the report:
- A website screenshot
- A performance grade
- The page weight
- The number of network requests
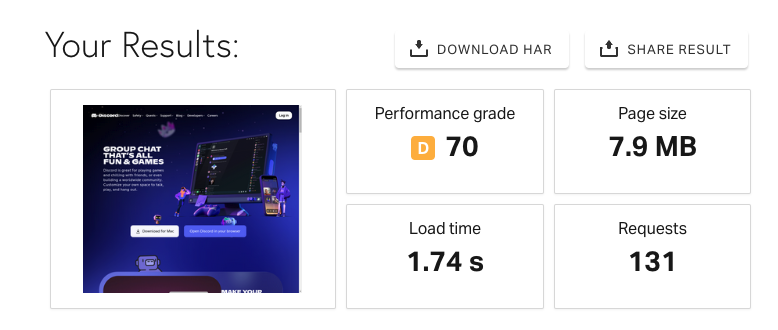
Try clicking on the screenshot to watch your website render frame by frame!
Google PageSpeed Insights can also give you an overview of how fast your website loads and provide performance recommendations.
Selecting a test location
Pingdom offers 7 different server locations to run your test from. Website speed depends on where the website is accessed from, so start by picking a location that's close to where your visitors are located.
Other speed testing tools
There are many site speed testing tools available online. If Pingdom doesn't provide the data you need, try out DebugBear's free website speed test.
You can test pages on mobile and desktop devices, measure Google Core Web Vitals, and investigate when different page resources load.
Limitations of Pingdom's website test
Pingdom is a popular tool for analyzing your website. However, it is also somewhat outdated, being based on the YSlow open source project that is almost 20 years old and no longer actively maintained.
Here are some of Pingdom's limitations:
- All tests are run on an unthrottled network connection in a data center, resulting in load times that are faster than those experienced by users
- Pingdom uses older technical load time metrics instead of the newer user-centric Core Web Vitals metrics
- The recommendations are not very detailed and somewhat outdated
- You can only run tests on desktop devices
A detailed guide to Pingdom page speed recommendations
Below the top-level summary, Pingdom provides specific suggestions to improve your page performance. For example, you can make fewer network requests or enable text compression.
Let's take a look at what these recommendations mean and why they can make your website faster.
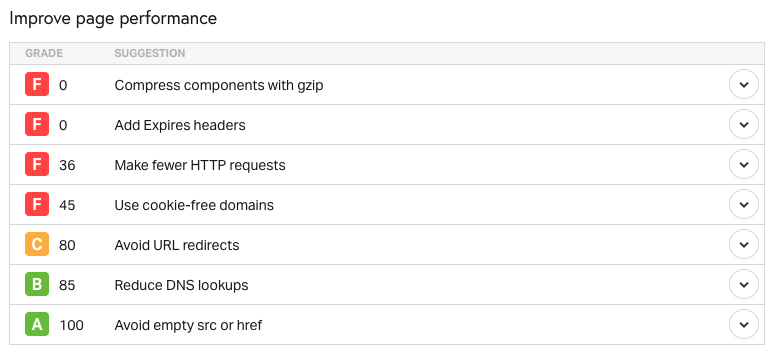
Some of Pingdom's performance recommendations are not very impactful. Make sure to prioritize potential fixes before applying them to your website. Check out our guide to website performance optimization to learn more.
Compress components with gzip
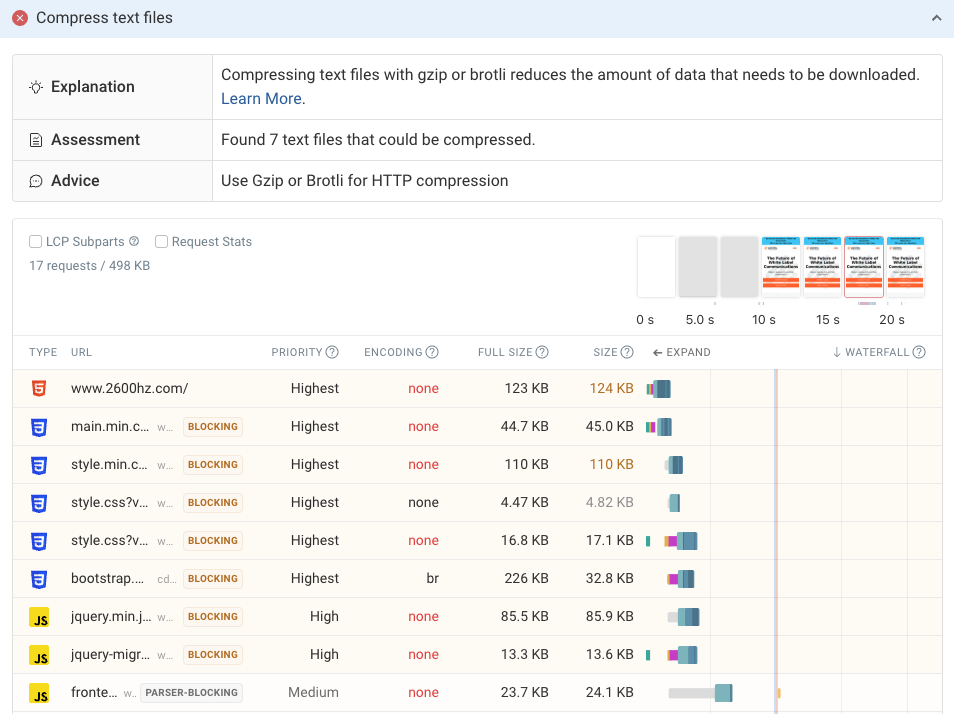
Large files take longer to download, so you should compress text files with gzip or Brotli HTTP compression.
Text files include HTML code, CSS stylesheets, and JavaScript files. If these can load more quickly your visitors will spend less time waiting for page content to appear when they come to your website.
Pingdom does not list the specific files that aren't currently compressed, but you can find this information in DebugBear's "Compress text files" recommendation.
Add Expires headers
When someone visits your website for the first time all page resources need to be loaded from your server. However, if browser caching is enabled, the browser can save some of those resources and re-use them for any subsequent page views. Performance on those page views will be much better than for the first visit.
Adding the Expires HTTP header in the server response is one way to enable browser caching. Another option is the Cache-Control header.
Make fewer HTTP requests
When a website loads browsers make HTTP requests to load a number of resources, like stylesheets, images, or fonts. Generally, the more resources you load the longer it will take to load all of them. However this also depends on other factors like resource download size and whether the server supports the HTTP/2 protocol.
Read our detailed guide to making fewer HTTP requests and when it impacts page speed.
Use cookie-free domains
Cookies are bits of content that browsers include with every request. This increases the amount of data transferred when loading the page. Usually this doesn't make a big difference, unless your website sets large cookies.
Browsers only send cookies to the domain they were set for. By using cookie-free domains to load static assets that don't depend on cookie state you can reduce the amount of network traffic.
Avoid URL redirects
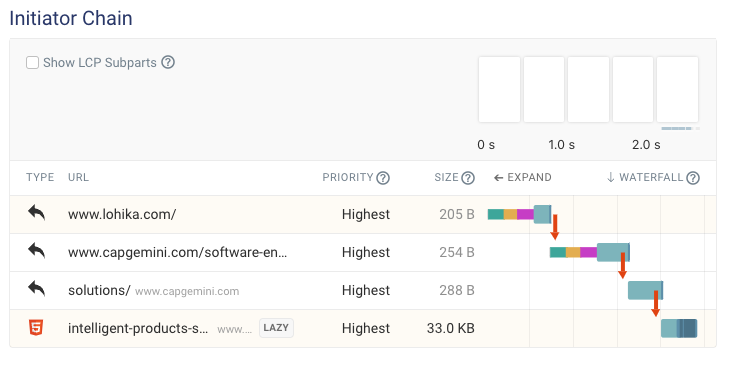
Redirects happen when browsers try to load a URL and the server responds with a new URL that the content has moved to. As a new request is required, the page load is delayed. This is especially bad if there are multiple page redirects.
You can see an example of a redirect chain in this screenshot from a DebugBear speed test. To avoid this, update links across your site when URLs change, and make sure redirects point straight to the final URL.
Reduce DNS lookups
DNS lookups are a part of the server connection process that has to happen before resources can be loaded from a new domain. Each DNS lookup takes one network round trip, causing the page to take slightly longer to load.
Aim to load most of your important resources from the same domain to avoid having to create many server connections.
Avoid empty src or href
If you have HTML code like this then the browser will make a request to the URL of the current document:
<img src="" />
This request is unnecessary and you can fix it by removing the image or specifying either the correct image URL or a placeholder.
Put JavaScript at bottom
JavaScript files are a render-blocking resource, which means that browsers won't display page content until after these resources are loaded.
This DebugBear speed test result illustrates that:
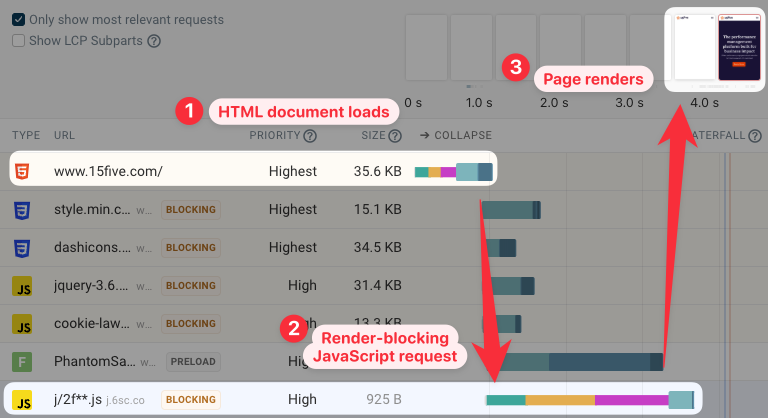
One way to handle this is to put JavaScript at the bottom of the page <body>. Then there's no more content to block.
Another option is to defer JavaScript loading with the defer keyword.
Reduce the number of DOM elements
DOM elements are essentially HTML tags, the content of your website document. The more complex your document is, the longer it will take for your browser to render.
By avoiding an excessive DOM size you can improve loading performance as well as interaction responsiveness, as for example measured by Google's Interaction to Next Paint metrics.
Avoid AlphaImageLoader filter
CSS AlphaImageLoader filters can make page load time worse. However, they've been deprecated since Internet Explorer 9 so in practice you don't have to worry about these.
Make favicon small and cacheable
Favicons are icons that browsers display alongside the page title of a web page. A favicon is downloaded when opening any page on a website, so making sure they are not too large and can be saved in the browser cache for repeat visits reduces resource consumption.
Avoid HTTP 404 (Not Found) error
When a server responds with an HTTP 404 status code that means it wasn't able to find the resource. To avoid unnecessary requests, fix your website so that the browser doesn't request these files in the first place.
Looking for a web performance tool with more modern performance insights? Check out our list of the best Pingdom alternatives.
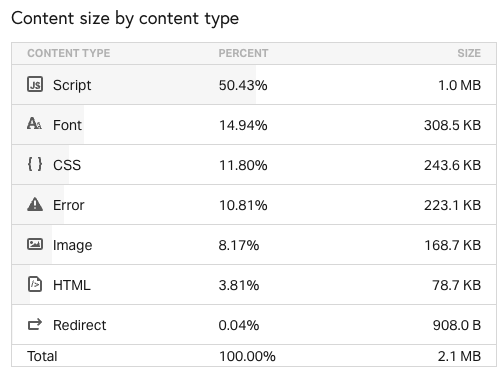
Content size and request count by content type
Below the page speed recommendations, Pingdom's free tool shows a summary of resources loaded when opening the website. You can see how many megabytes of data were downloaded across different file types, as well as the number of files requested.
How to analyze Pingdom's request waterfall
Pingdom shows a list of files requested by the website at the bottom of the test result. This visualization is called a request waterfall. You can see the file URL on the left and the bars on the right indicate when each resource is loading.
You can also see how much different parts of the request contributed to its overall duration. At first a server connection is established by doing a DNS lookup, setting up a TCP connection, and then making a secure SSL connection. After that the request is sent, the browser waits for a response, and finally receives the response body.
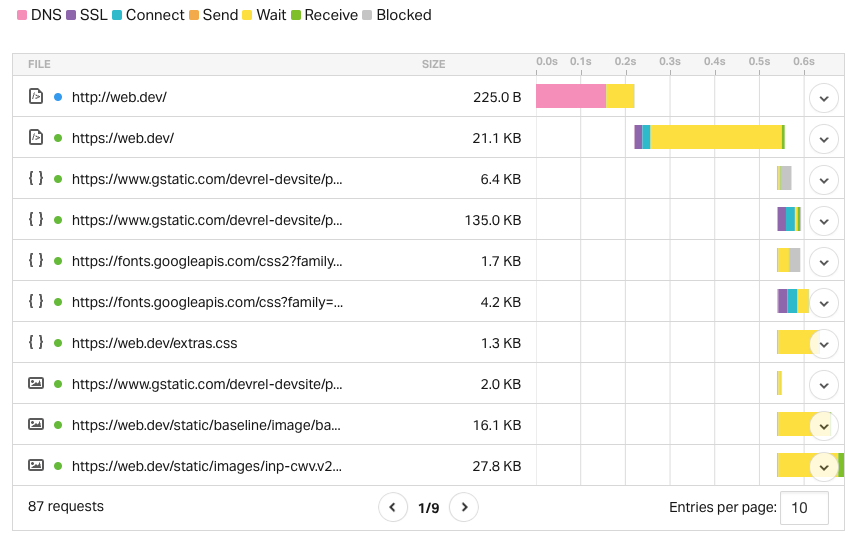
There are two big limitations with Pingdom's waterfall visualization:
- It doesn't surface visual loading progress or mark rendering milestones
- There's no detail on the role of each request or its priority
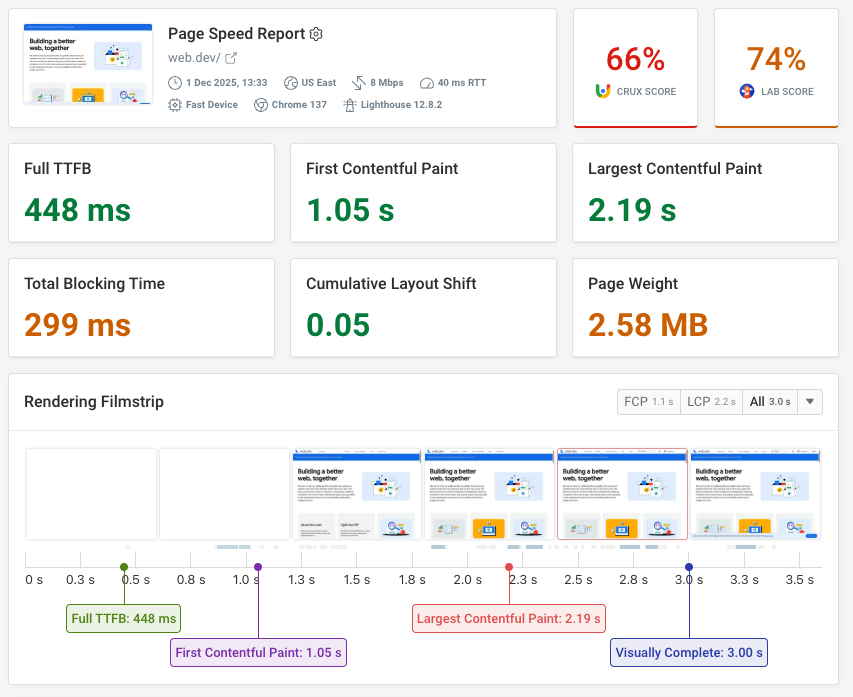
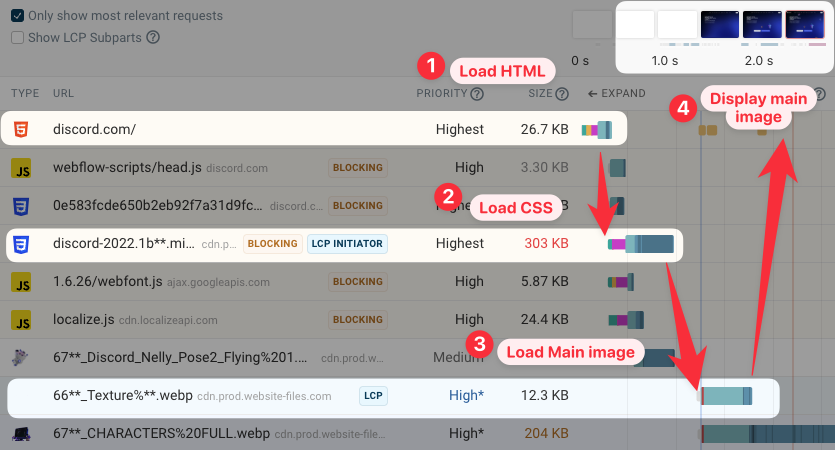
If you use DebugBear instead you'll get a more insightful view of your site's performance:
- The rendering filmstrip shows you how resource loading impacts user experience
- Render-blocking requests have "Blocking" badge
- The First Contentful Paint milestone is marked in blue
- The Largest Contentful Paint image has an "LCP" badge
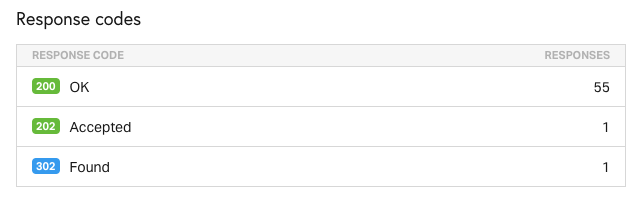
Response codes
Each Pingdom test result provides a breakdown of HTTP status codes for resources loaded on the page. A status code indicates whether the server was able to successfully provide the resource:
- 2xx responses like
200 OKconfirm the request was successful - 3xx responses like
301 Moved Permanentlyindicate that the resource needs to be loaded from a different URL - 4xx responses like
404 NOT FOUNDindicate client errors, for example that an invalid resource was requested - 5xx responses like
500 Internal Server errormean that the server encountered an error while trying to serve the request
Failed requests indicate that something on the page isn't set up correctly, or that there is a bug in your server code.
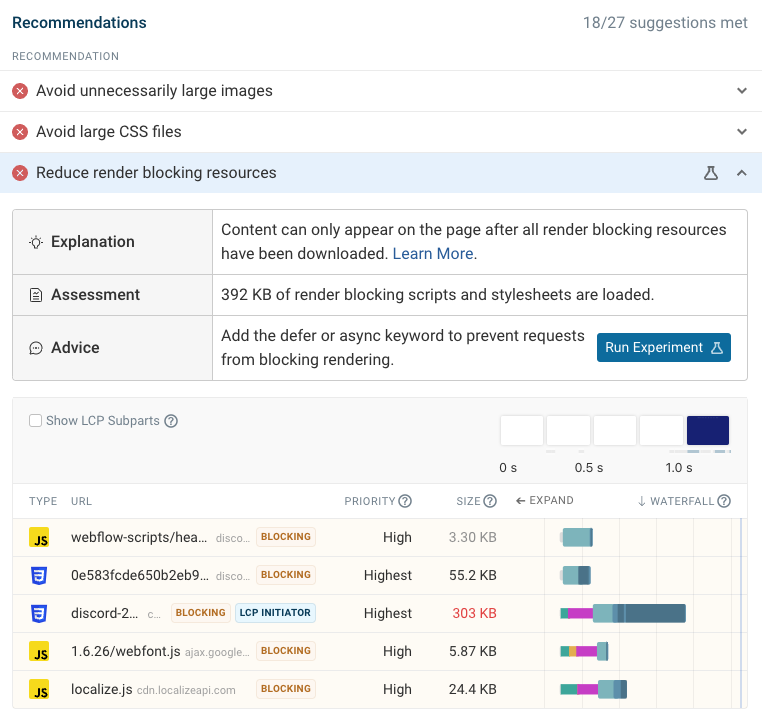
Better performance recommendations
For better performance suggestions for modern websites, the DebugBear speed test can provide a prioritized list with more detailed insights on what causes the recommendation.
If you have a DebugBear account you can also run experiments to measure the impact of a change without making any changes to your live website.
Pingdom page speed vs. Core Web Vitals
Pingdom measures performance in a lab-based testing environment and reports the Load event milestone. However, Google uses the three Core Web Vitals metrics as a ranking factor, as measured by the real user Chrome User Experience Report (CrUX).
DebugBear's Web Vitals tab surfaces this data in addition to the lab results. Here you can see web performance monitoring data for the First Contentful Paint and Largest Contentful Paint metrics.
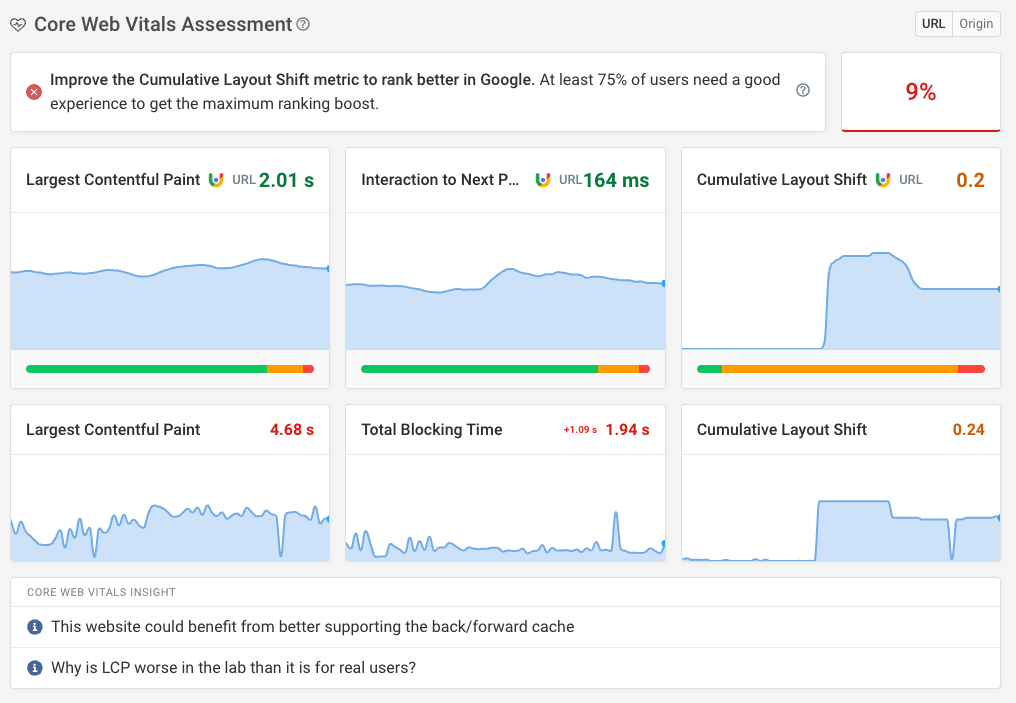
Google's CrUX data is aggregated over a 28-day rolling period, so lab tests will show a metric change before it gradually starts showing in the CrUX data.
Track your page speed over time
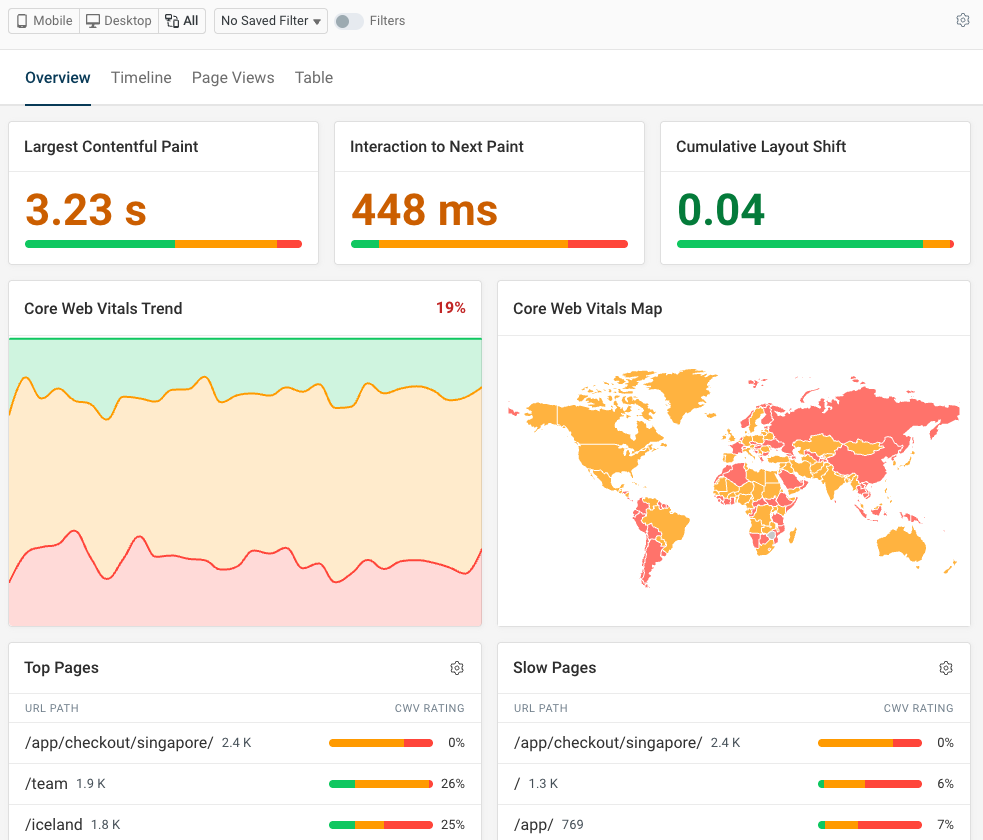
If you're working on your website performance you can set up continuous synthetic monitoring for your pages to confirm your optimizations are working and get alerted to any regressions.
You can also set up real user monitoring (RUM) to see how fast your website is for actual website visitors, and what you can do to fix that.
RUM data can tell you:
- If specific visitor segments have a slow experience
- How page interactions cause poor performance
- What pages across your website are slow


Monitor Page Speed & Core Web Vitals
DebugBear monitoring includes:
- In-depth Page Speed Reports
- Automated Recommendations
- Real User Analytics Data