How To Fix Largest Contentful Paint (LCP) Issues
Seeing LCP issues reported in your Core Web Vitals data? In this article we explain what that means for your visitors and what you can do to fix these issues.
What are LCP issues in Google Search Console
The Core Web Vitals data in Google Search Console will report LCP issues if your website is performing poorly on the Largest Contentful Paint metric. That means visitors wait a long time for content to load when opening your website.
As the web vitals are a ranking factor, LCP issues can cause your website to get fewer clicks in Google.
LCP issues can have two levels of severity: "Poor" and "Needs Improvement".
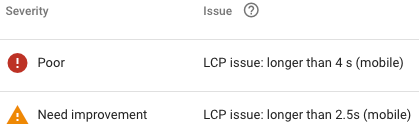
LCP issue: longer than 2.5 s
"Needs Improvement" is the lower level of severity. It means visitors wait longer than 2.5 seconds, but less than 4.0 seconds, for content to appear on your website.
LCP is typically harder to pass on phones, so you'll typically see "LCP issue: longer than 2.5 s (mobile)" as the full message.
Here's an example of an LCP experience that needs improvement: the Largest Contentful Paint score is 3.01 seconds, above the "Good" threshold of 2.5 seconds.

You can see that content gradually appears after opening the website. When the main content element becomes visible this is marked as the Largest Contentful Paint rendering milestone.
LCP issue: longer than 4 s
If it takes more than 4 seconds to load the main page content then Search Console will report this as a "Poor" LCP issue. On mobile you'll see the "LCP issue: longer than 4 s (mobile)" message.
You can run a website speed test to confirm this finding and get more details on the performance issue. For example, here you can see data from the Chrome User Experience Report (CrUX) showing that real users on your website are waiting a long time for the largest content element to show up.
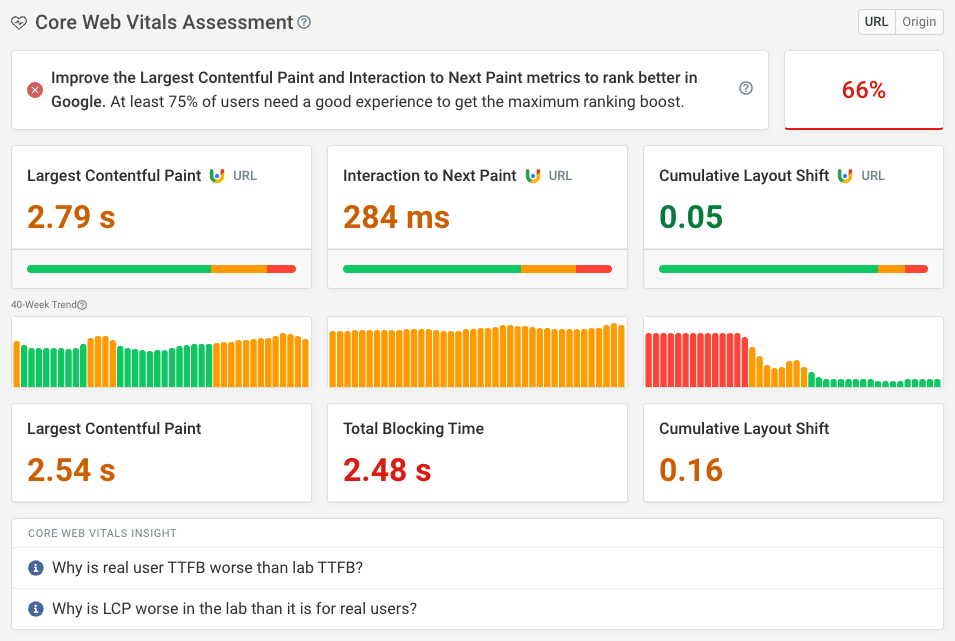
Testing your website for LCP issues
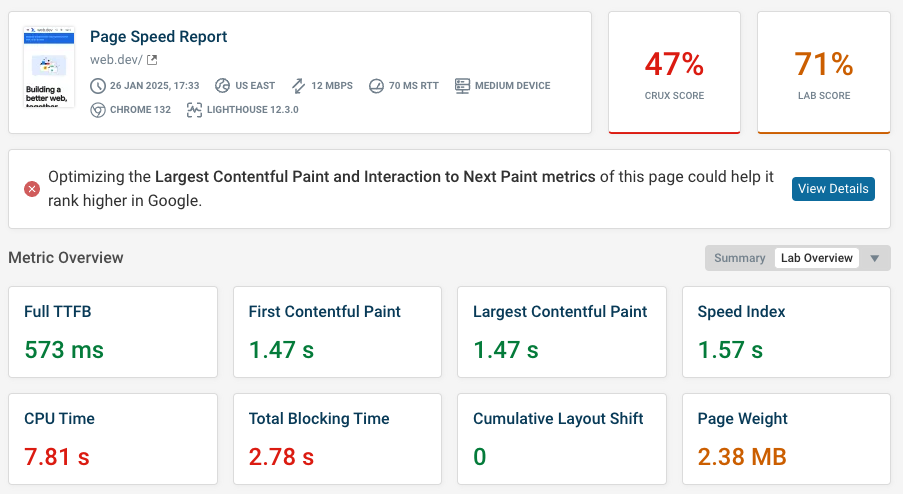
To check the performance of a page on your website you can use a free tool like PageSpeed Insights or DebugBear's free website speed test.
You'll get a high-level score for your page according to different page load milestones as well as technical aspects like CPU Time or page weight.
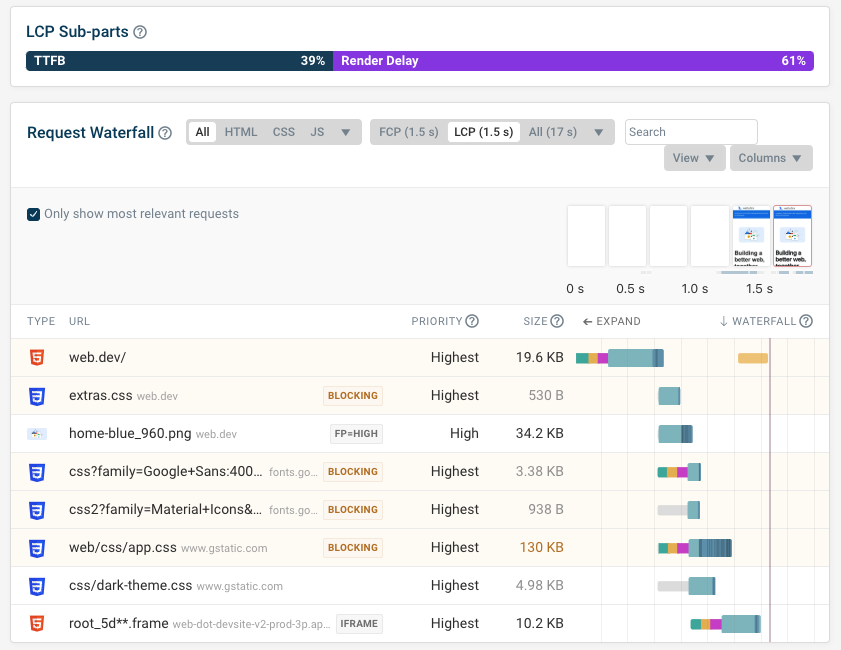
You'll also get additional debug data to diagnose poor LCP on your website. For example, a request waterfall can tell you what resources your website is loading and how that's impacting page load.
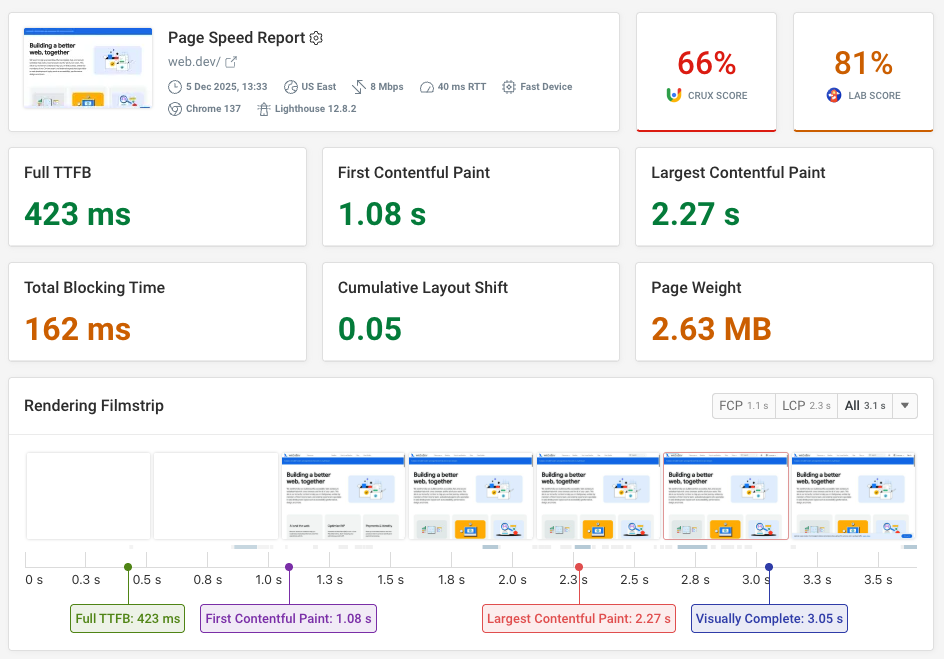

Run A Free Page Speed Test
Test Your Website:
- Automated Recommendations
- Detailed Request Waterfall
- Web Vitals Assessment
How to fix common LCP issues
Once you've identified LCP issues on your website, you can go through this process to fix them:
- Diagnose the cause of the issue
- Try out potential optimizations
- Deploy high-impact fixes on your website
We'll take a look at what diagnostic data is available and what optimizations typically work best.
This article looks at how to fix LCP issues in particular. Our guide to website performance optimization goes through the general principles of investigating web performance issues.
Identify what's causing LCP issues using LCP sub-parts
LCP subparts are a way to break down the Largest Contentful Paint metric into different components. This can tell you whether delays are coming from slow server responses, time spent downloading an image, or due to other factors like resources that block rendering.
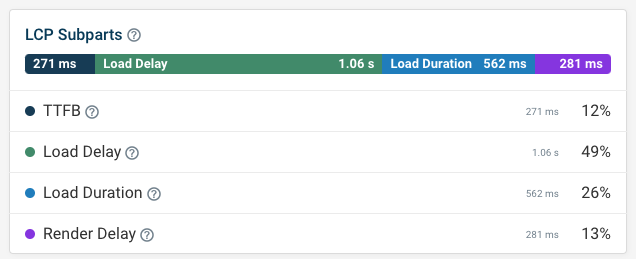
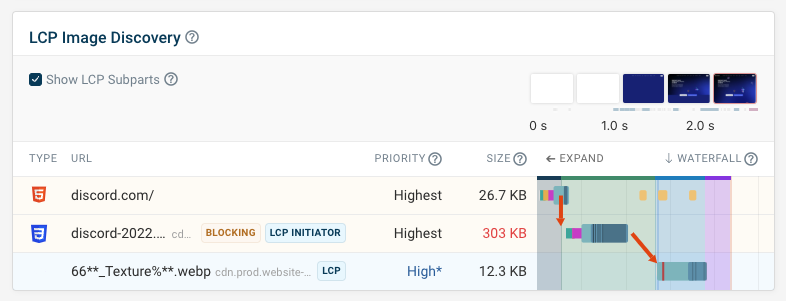
DebugBear test results also annotate request waterfalls with the subpart breakdown. For example, the screenshot below shows that a big contributor to the LCP issue is Resource Load Delay. That means the browser can't quickly identify that the LCP image needs to be preloaded.
In this case that's because the LCP image is a background image. The browser only discovers that the image resource is needed after the page has rendered.
To fix this, you can preload the LCP image. That way it can start loading as soon as the page HTML is loaded, and is ready to display when the browser needs it.
Google now also reports subpart data as part of the Chrome User Experience Report.
The Web Vitals tab on DebugBear surfaces this additional real user data. You can see how often the LCP element is an image and how image LCP page views break down into the four LCP breakdown components.
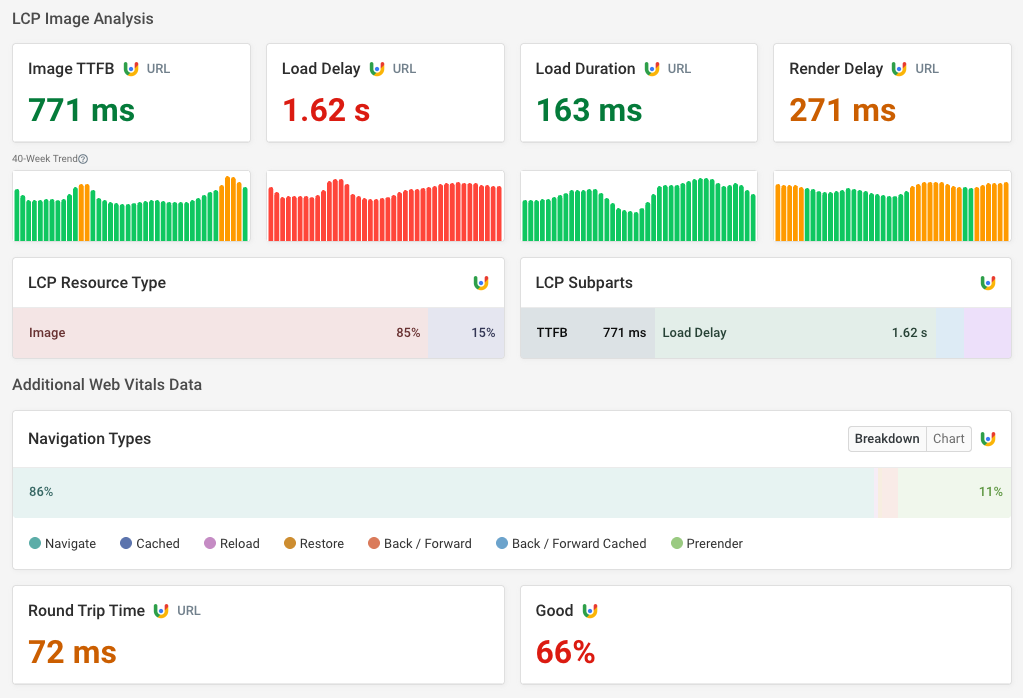
Google even reports how users are navigating around your site and what the typical network latency looks like.
Improve server response time
If the sub-part breakdown shows a high Time to First Byte (TTFB) then you'll need to improve your server response time. It means the server is spending a lot of time generating the HTML document, for example due to slow database queries or CPU-intensive rendering logic.
TTFB can also be improved by implementing a Content Delivery Network (CDN). Connecting to a server requires multiple round trips between client and server on the network.
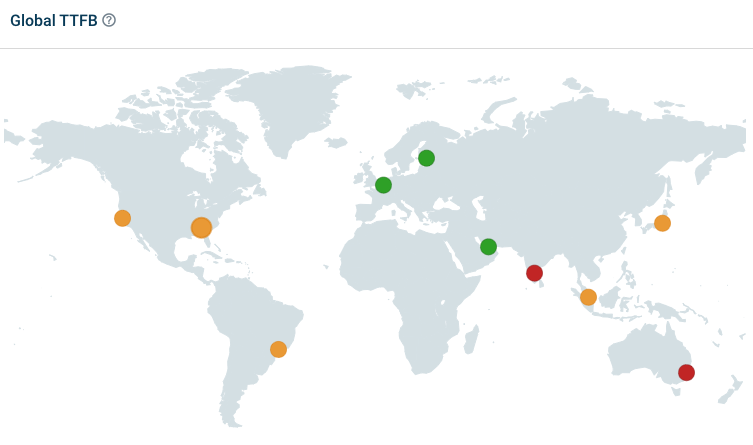
Without a content delivery network you'll find that your TTFB score varies a lot depending on where your website is accessed from. You can check this by running a global TTFB test for your website.
Optimize images
When an image is the Largest Contentful Paint element then this image will need to be downloaded before it can be displayed. There are a few steps you can take to speed up this process:
- Use modern image formats to reduce image size
- Don't use oversized images
- Where possible, load the image from the same domain as the document, to reduce the number of server connections
- Ensure that the LCP image is loaded with a high priority

Ensure LCP images are discovered quickly
In the screenshot above you can see that the image isn't loaded directly from the HTML document. Instead there's a request chain where first a CSS stylesheet is loaded, followed by the image. In the LCP sub-part breakdown this shows up as Resource Load Delay.
To fix this we can add a preload tag to the page HTML, so that the CSS and the image can be loaded in parallel.
We can use DebugBear's experiments to try this out and measure the impact of the optimization. It runs a speed test of the page with and without the preload tag.
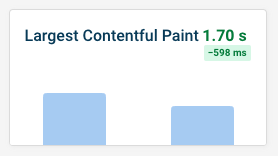
In this example we find that the LCP score improves from 2.29 seconds to 1.7 seconds.
Reduce render blocking stylesheets and scripts
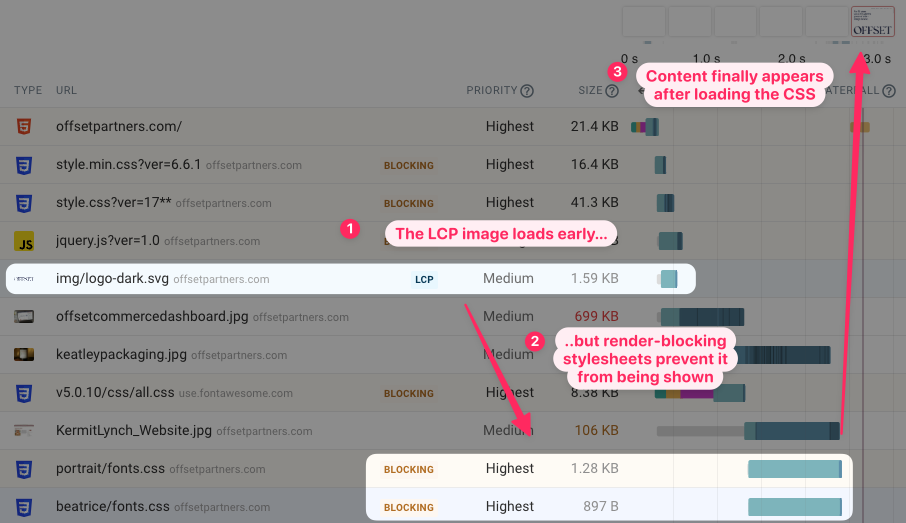
If specific page resources prevent all page content from showing up then this is visible in the Render Delay component of the LCP.
You can find an example of render-blocking stylesheets causing an LCP issue in this request waterfall. While the LCP image is loaded early, it only becomes visible after two slow CSS files have loaded.
Reduce LCP after the first page view
When visitors first come to your website that's considered a "cold load". There are no existing server connections, or no data that's already in the browser cache.
However, as visitors navigate around your site, you can reuse already loaded content for better performance. In order to do that, you can:
- Leverage the browser cache, to avoid downloading identical resources multiple times
- Make sure your website supports the back-forward cache, so history navigations are instant
- Set up speculation rules, to fetch resources proactively
Use real user data for extra insight
Lab-based page speed tests are often enough to debug LCP issues. But sometimes you'll find that you can't replicate slow performance in a synthetic test. For example, an issue might only appear on a specific device size, or only users in certain countries might be affected.
That's why you need real user data. For example, you can identify how often different page elements cause the LCP and how the LCP score differs between them.
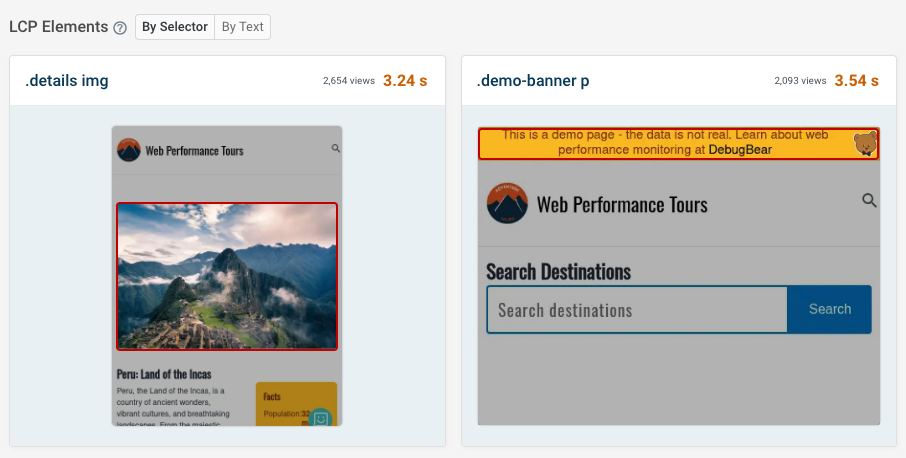
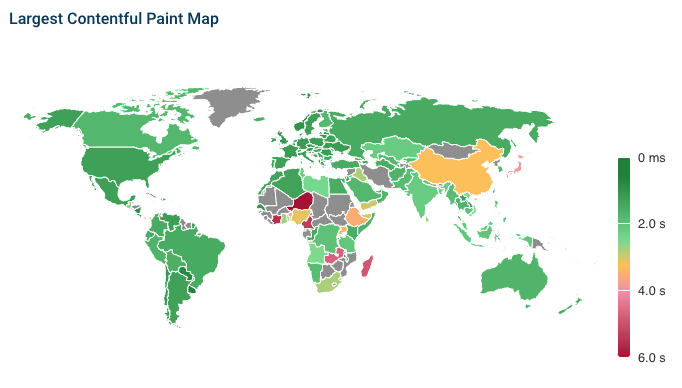
If LCP varies by the visitor's location, the map view easily lets you see where people are impacted. Visitors from these locations will often have slower mobile network connections, as well as less powerful devices. They may also be further away from your website server, increasing round trip times on the network.
A Content Delivery Network (CDN) can often help to reduce these discrepancies. CDNs have server locations around the world, speeding up server connections and allowing you to cache content easily.
Prevent LCP issues with monitoring
Google Search Console will show you CrUX data, but this data takes 28 days to fully update. That means when new LCP issues appear, you'll only find out once they start impacting your rankings.
That's why a Core Web Vitals monitoring tool like DebugBear can help you stay on top of your Core Web Vitals. With ongoing monitoring you'll quickly be alerted of any regressions, and can confirm that fixes are working as expected.
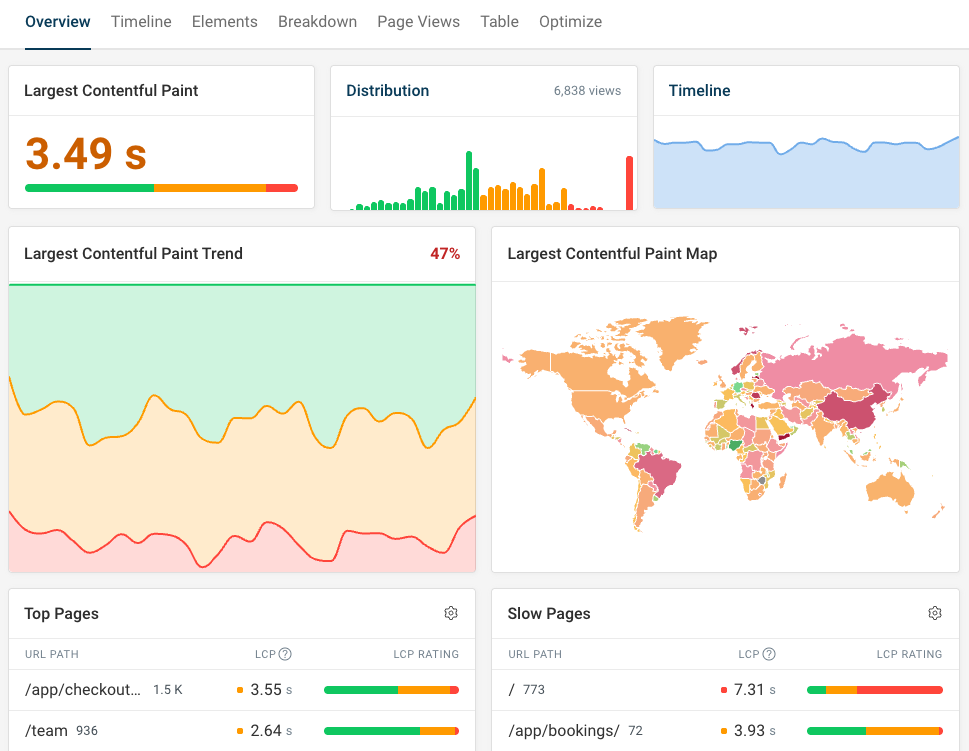
DebugBear combines real user monitoring data, synthetic tests, and Google CrUX into one tool. And it's built for Core Web Vitals, making it easy for you to fix LCP issues and pass the web vitals assessment. Start a free trial here.


Monitor Page Speed & Core Web Vitals
DebugBear monitoring includes:
- In-depth Page Speed Reports
- Automated Recommendations
- Real User Analytics Data