How To Measure And Optimize Speed Index
You can use many different metrics to measure page load time, for example using the First Contentful Paint and Largest Contentful Paint metrics.
Speed Index is another page load speed metric that is reported by Lighthouse and other synthetic monitoring tools. In this article we'll take a look at what this metric measures and what makes it unique compared to other metrics.
What is the Speed Index page speed metric?
Speed Index (SI) measures how quickly content appears on your website. While most web performance metrics look at when a particular bit of page content appears, Speed Index is determined visually by analyzing screenshots of your website during the page load process.
Each rendering frame is compared to the final frame in the recording. Speed Index is not a milestone timing – it doesn’t mark a point in time where a particular event occurred. Instead it’s a statistical measure of how much of the final page content is visible at different times.
Check out this video to learn more about how Speed Index works!
Deep dive: Lighthouse and speedline
Lighthouse uses the speedline library to calculate the Speed Index. You can use speedline to view the rendering progress of your website frame by frame.
To use the library, collect a performance recording in Chrome DevTools, right click the timeline view and select “Save profile”.
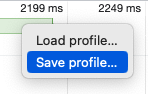
You can then pass that JSON file to speedline:
speedline profile.json --pretty
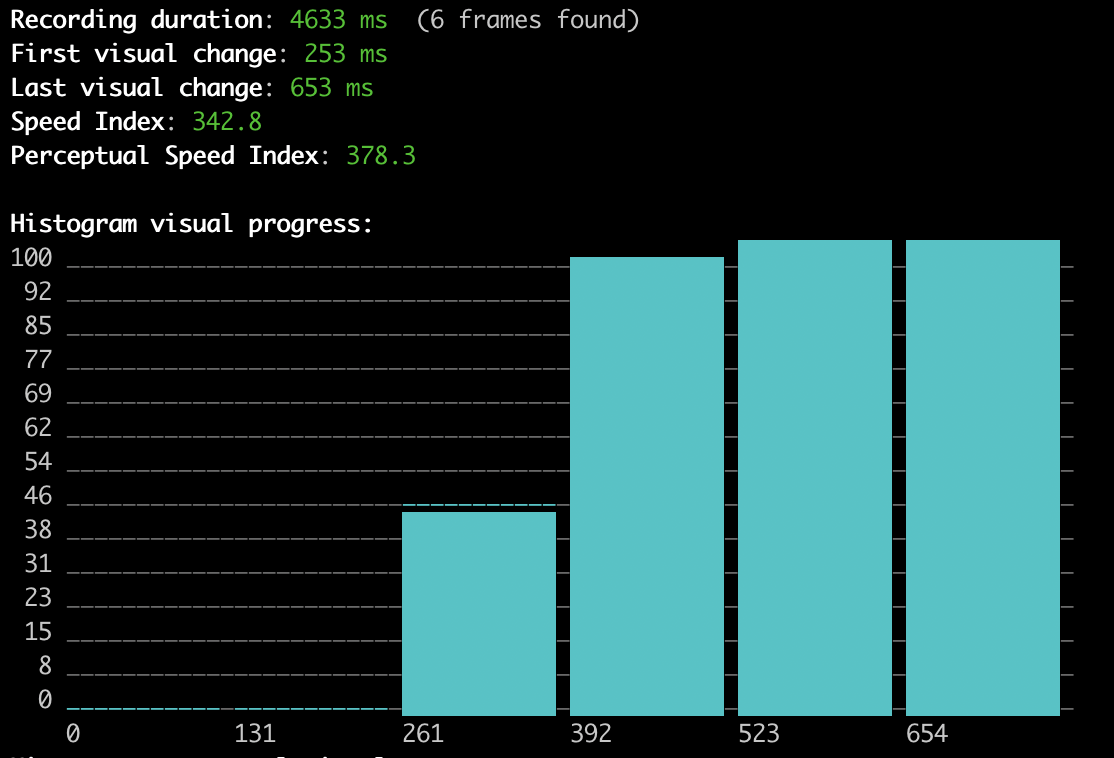
The first few frames bear no resemblance to the final rendered page, so the time where the user sees them fully counts toward the Speed Index score. If the user sees an empty page for one second then that adds 1 second to the Speed Index metric.
The last three frames are very close to the final frame, so they only increase the Speed Index a little bit. If the user sees a page that is 90% complete for two seconds then that increases the Speed Index by 10% * 2 seconds, which is 200 milliseconds.
Let’s take a look at an example calculation for these frames. The page starts out empty, then the top of the page appears, the rest of the page loads, and finally a web font loads.
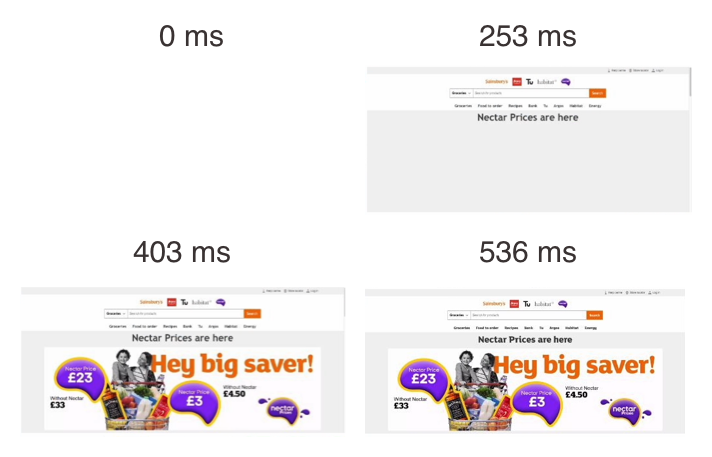
The table below shows how the Speed Index is calculated for this page. The longer a frame is visible and the less complete the page is at that point, the more the frame contributes to the Speed Index score.
| Completed | From [ms] | To [ms] | Duration [ms] | Speed Index [ms] |
0% | 0 | 253 | 253 | 253.0 |
43% | 253 | 403 | 150 | 85.5 |
98% | 403 | 536 | 133 | 2.7 |
99% | 536 | 653 | 117 | 1.2 |
| Sum: | 342.3 |
What is a good Speed Index value?
On mobile a Speed Index of 3.4 seconds or below is considered good, while on desktop you need a metric value of less than 1.3 seconds to get a Lighthouse subscore over 90.
You can see how the Speed Index metric value relates to the Speed Index subscore using the Lighthouse Scoring Calculator.
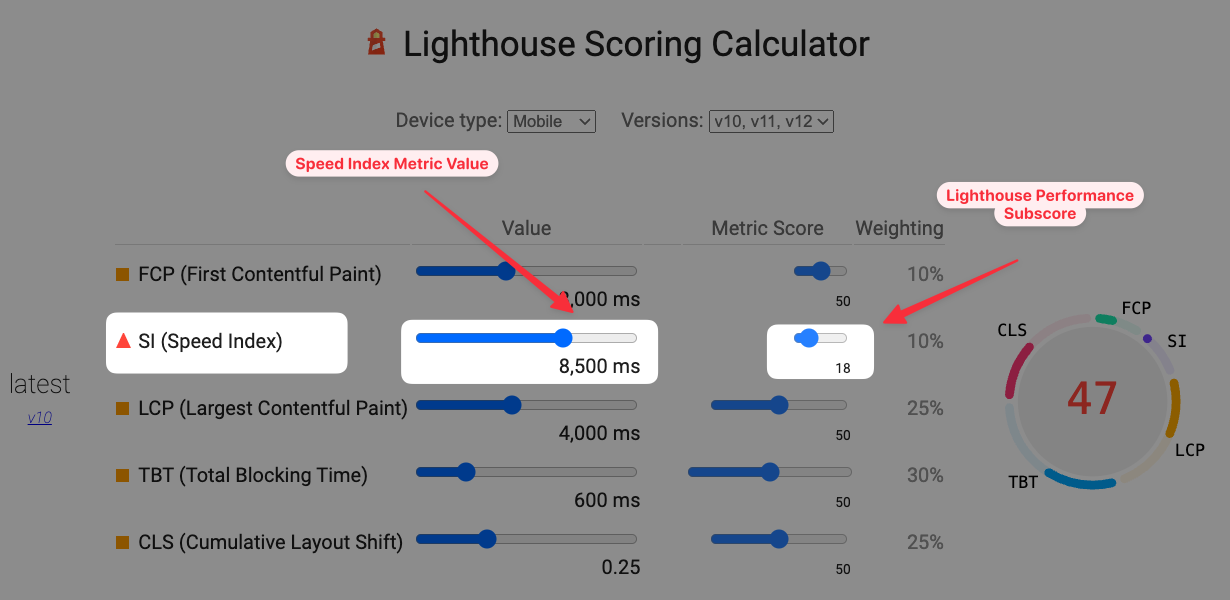
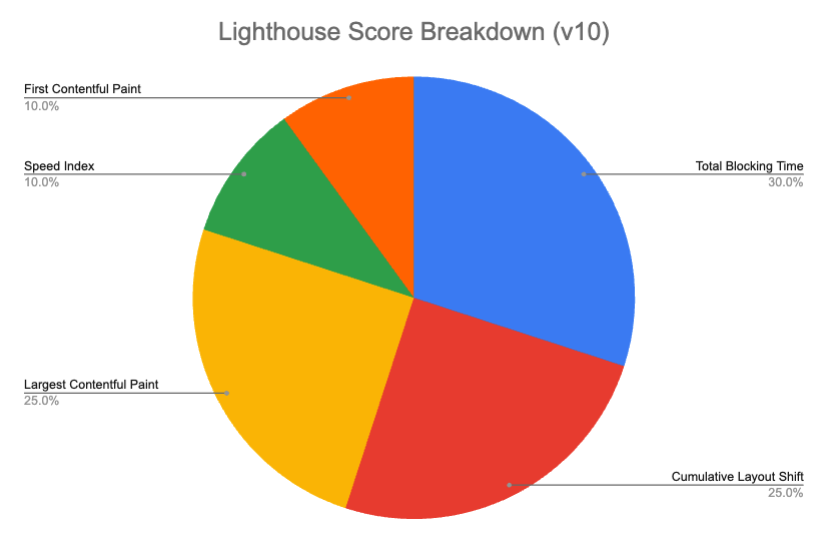
How does Speed Index impact the Lighthouse score?
As of Lighthouse version 12 Speed Index makes up 10% of the overall Lighthouse Performance score. It is therefore one of the less impactful metrics, although it correlates strongly with the First Contentful Paint and Largest Contentful Paint metrics.
How is Speed Index different from Largest Contentful Paint?
While the Largest Contentful Paint looks at just a single element on the page, Speed Index considers the page as a whole.
However, Speed Index is expensive to calculate as it involves capturing screenshots and comparing the images. It is therefore not effective to record the metric when capturing field data on user devices.
Speed Index vs. Visually Complete
The Visually Complete metric marks the rendering milestone where there are no more content changes on your website, no matter how small.
Because it's a rendering milestone, the time the page spends loading prior to the Visually Complete event fully counts towards the metric value. In contrast, Speed Index only counts partially, depending on how much of the page has already loaded.
A website where most content loaded quickly, but a chat widget takes 10 seconds to load can have a good Speed Index score, but the Visually Complete metric will have a value of 10 seconds.
Speed Index vs. First Contentful Paint
Before any content is visible, the page will always be 0% complete. That means that time spent before the First Contentful Paint always contributes fully to the Speed Index metric value.
As a result, Speed Index can never be better than the FCP score, and is usually much higher.
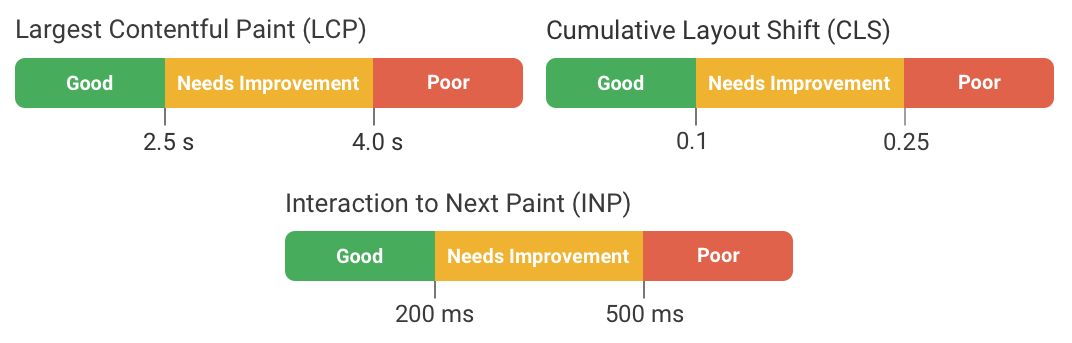
Is a good Speed Index score important for SEO?
Speed Index is not one of the Core Web Vitals metrics that impact Google rankings. However, optimizing Speed Index is also likely to improve the Largest Contentful Paint metric, which is one of the web vitals metrics that’s used by Google.
How do I measure the Speed Index of a website?
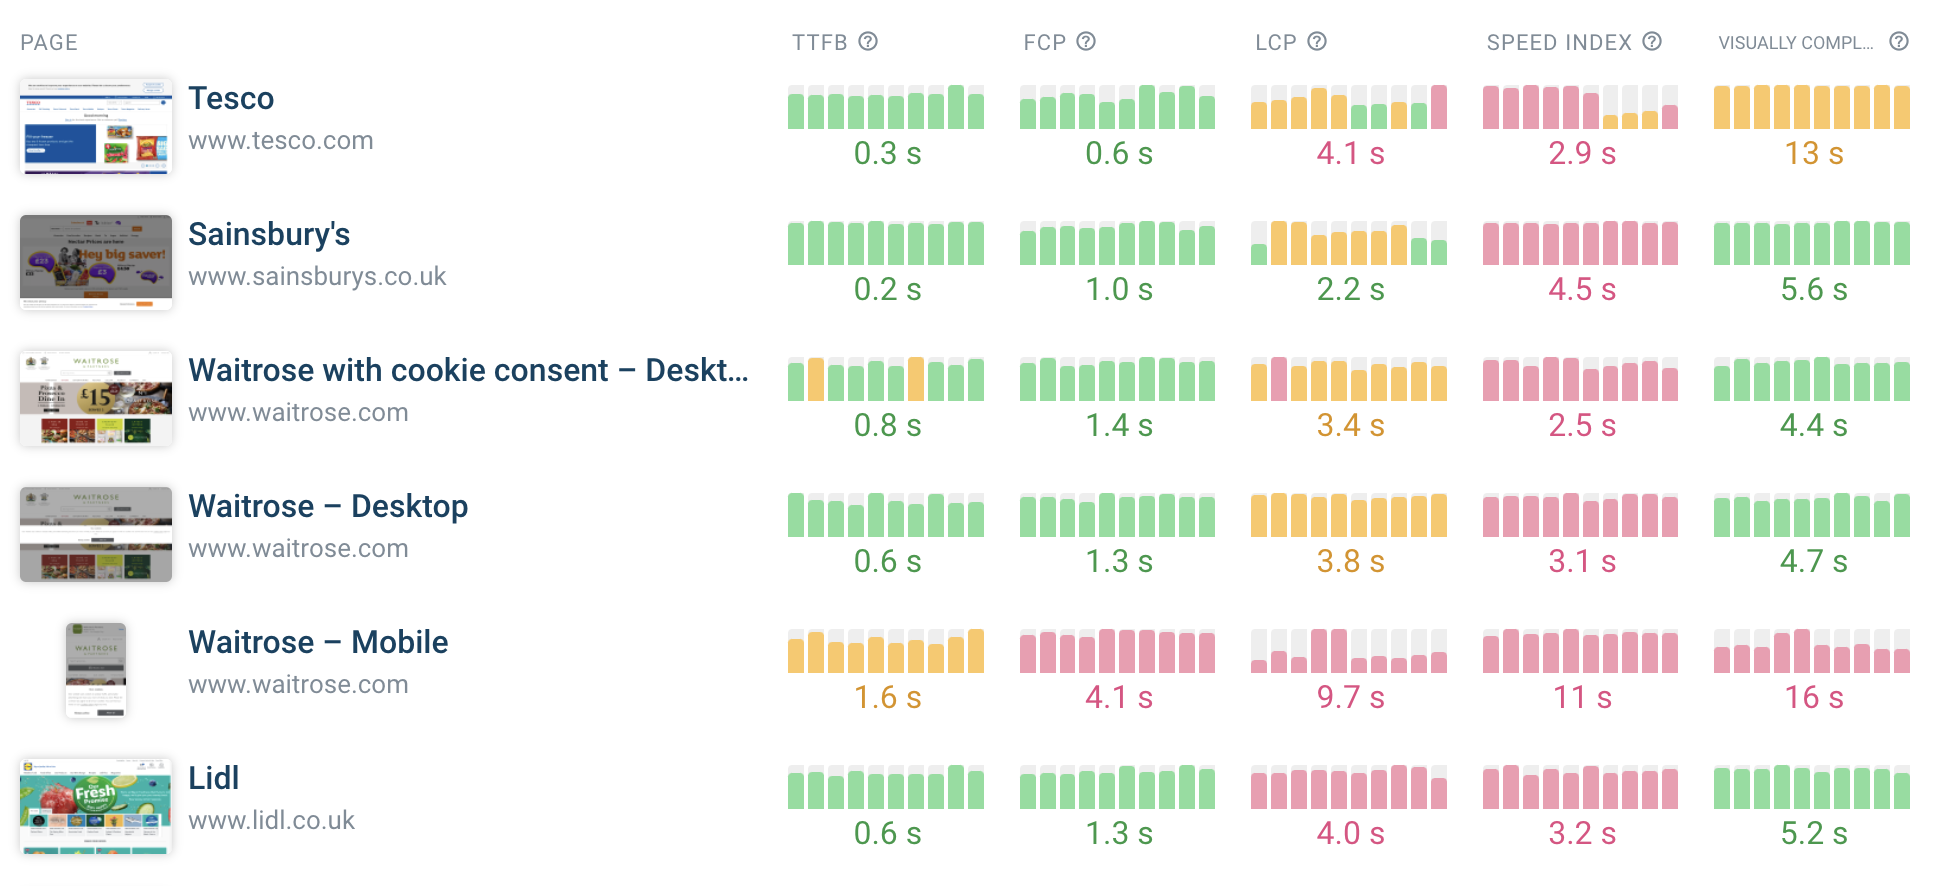
Many website performance tools report the Speed Index metric, for example:
- The Free DebugBear Website Speed Test
- Google’s Page Speed Insights tool
DebugBear Speed Test
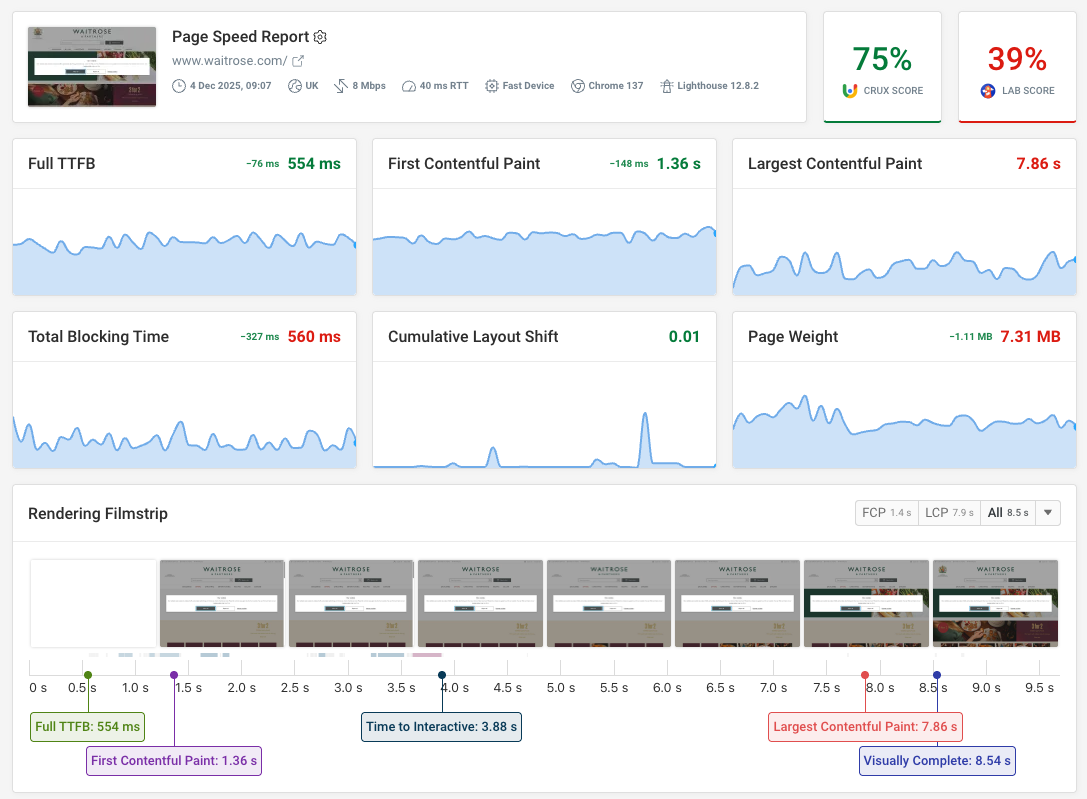
Our free website speed test lets you measure how quickly your website loads and how it’s graded by Google’s Lighthouse tool. Open the Lighthouse tab after running your test and click on the Performance score.
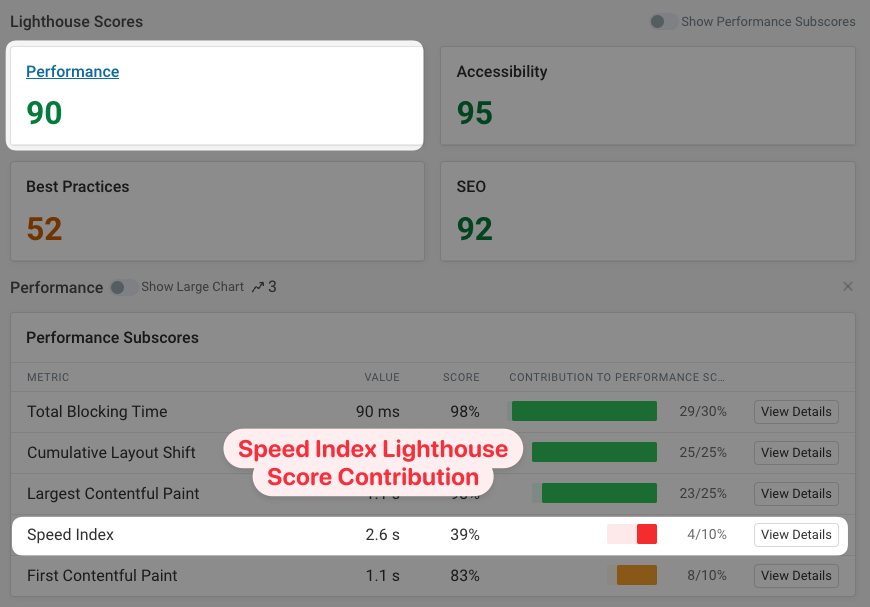
You can also click on View Details to see more information about how to optimize the Speed Index metric of your website.
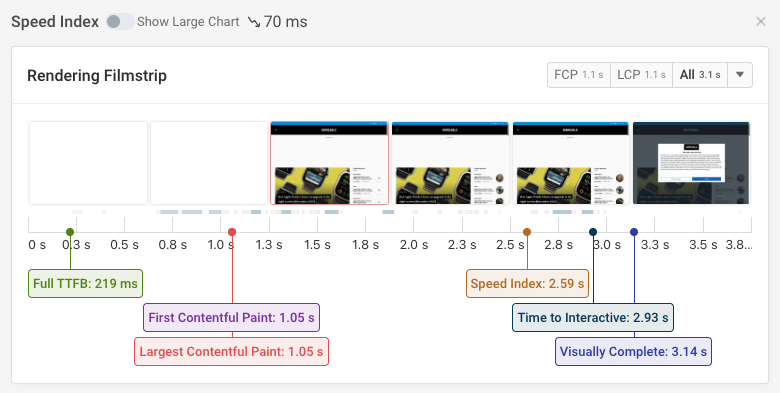
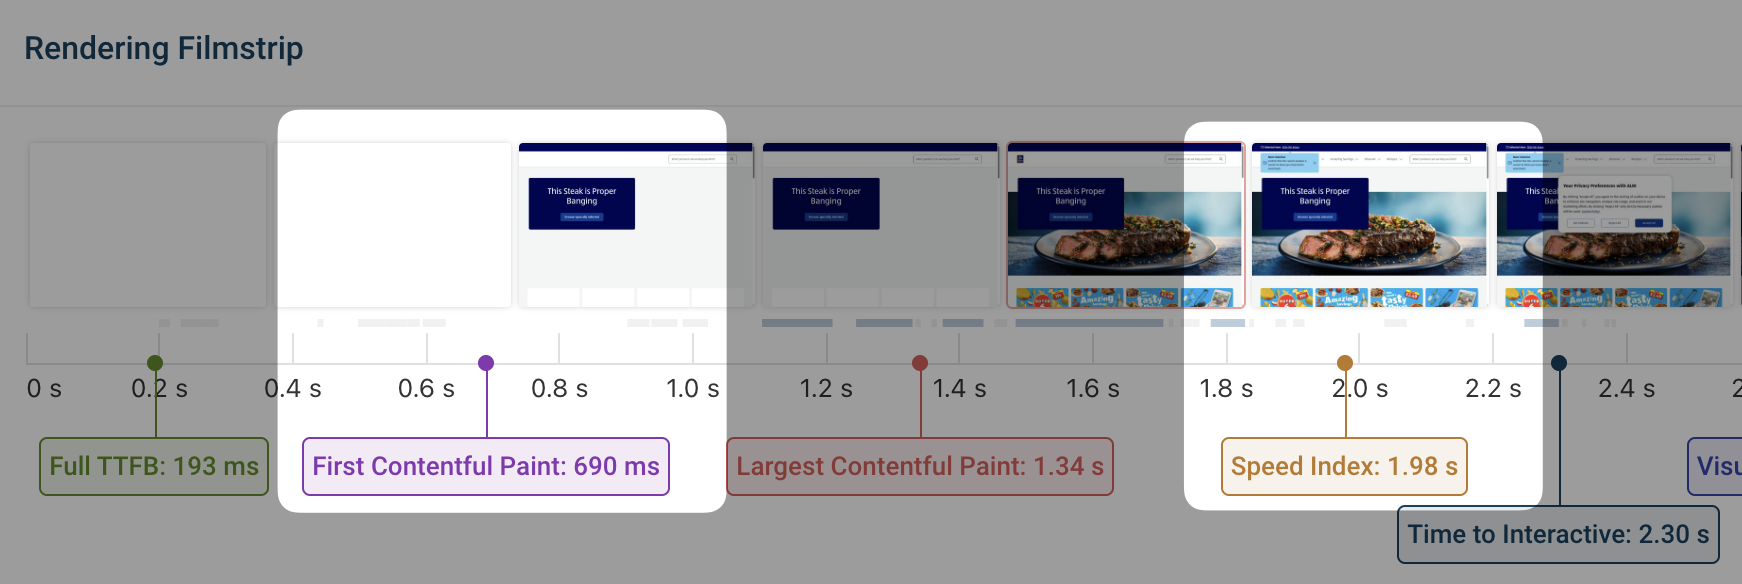
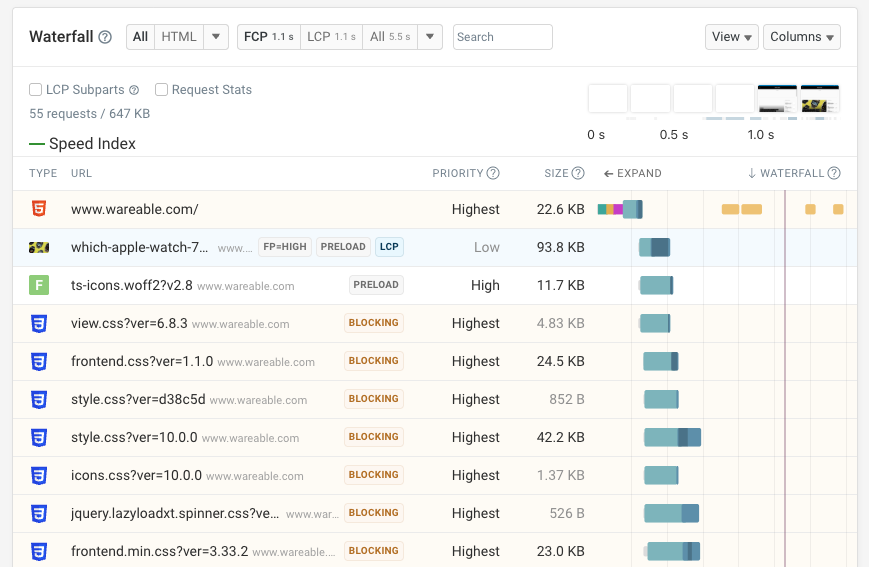
The request waterfall shows when different resources on the page load. You can look at the filmstrip in the top right to correlate the network activity to what visitors can see at each point.
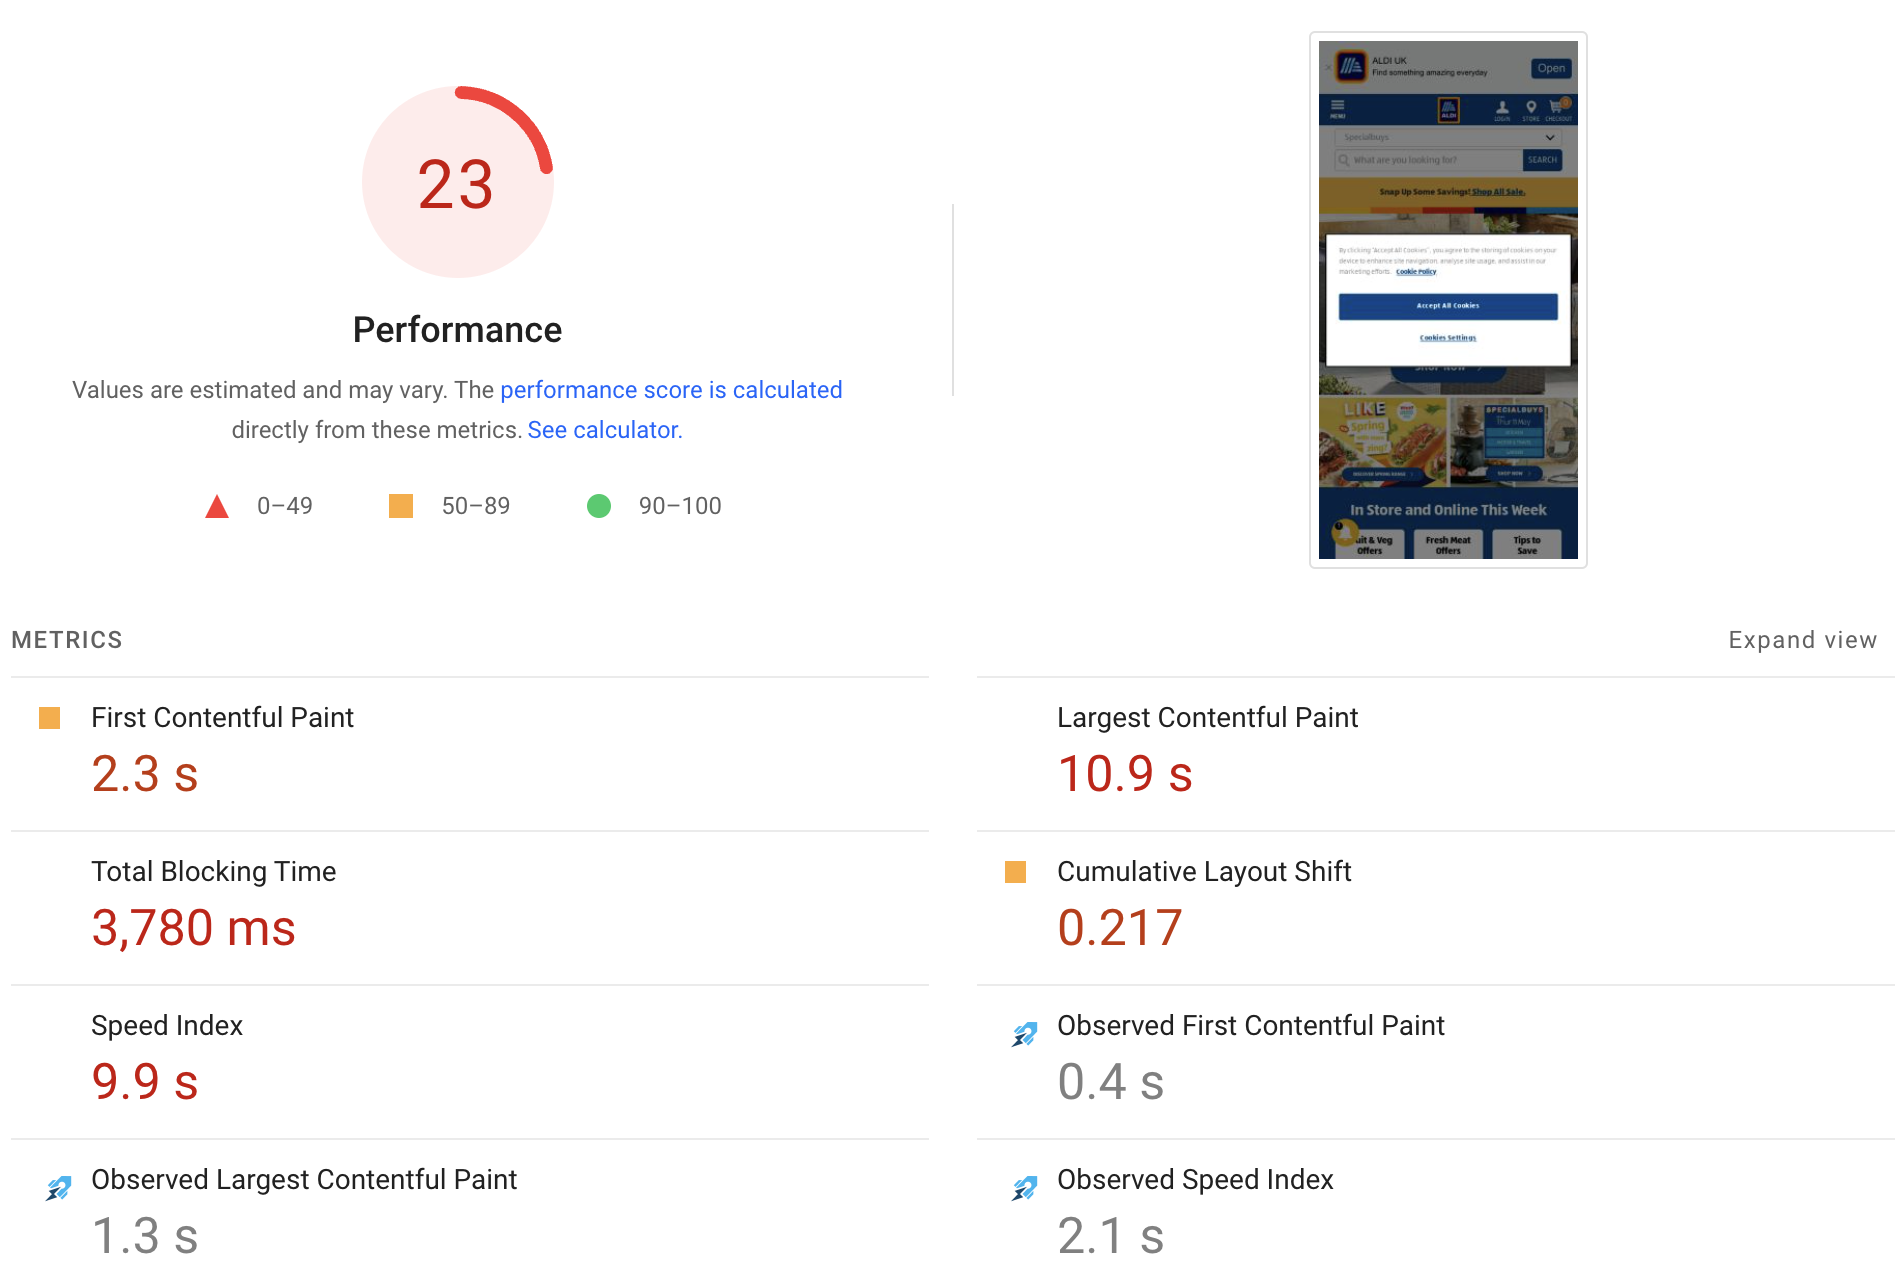
Lighthouse Speed Index on PageSpeed Insights
Google PageSpeed Insights and other Lighthouse-based tools also report the SI metric. Scroll down to the lab data under the Diagnose performance issues section.
Can Speed Index be measured for real users?
As Speed Index is calculated based on the rendering filmstrip, the metric is only available for synthetic testing.
Browser APIs don't provide websites access to rendering screenshots of the page. Processing this data would also be computationally expensive, potentially causing performance issues for visitors.
How can I improve the Speed Index score of my website?
To optimize the Speed Index metric ensure that the page starts rendering early and finishes showing above-the-fold content as quickly as possible:
- Optimize server response time
- Eliminate render-blocking resources
- Render the main page content quickly
Optimize server response time
Server response time is measured by the Time to First Byte metric. The browser can't start loading the rest of your website until it has started to receive the initial document HTML.
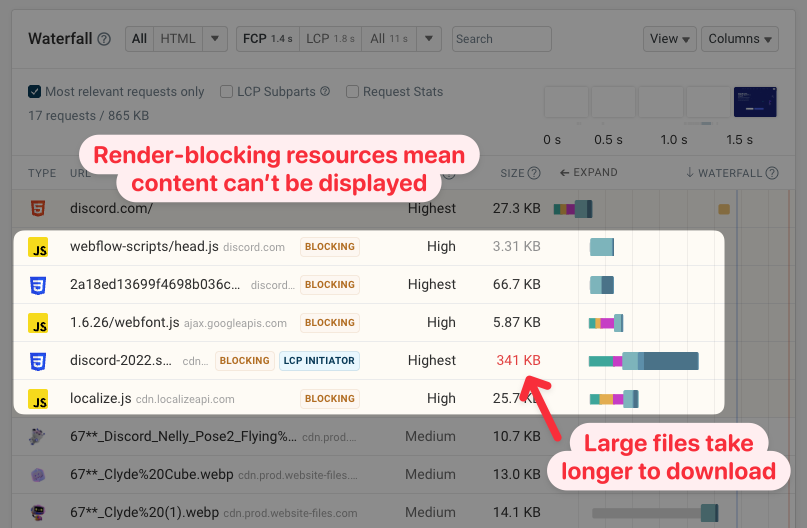
Eliminate render-blocking resources
A resource is render-blocking if the page requires it to load before any content can start showing on the page. This is often the case for CSS stylesheets, and in many cases also applies to JavaScript application code.
Where possible you should remove these resources entirely or load scripts asynchronously with the async or defer attribute.
You can also reduce the size of these resources to download them more quickly, or reuse an existing server connection to start loading them earlier.
Render the main page content quickly
Identify the largest page elements and find out what's required for them to render. For example, if your page contains a large image you can find out how the browser discovers the image and how it's prioritized.
Avoid sequential request chains when loading images, and use the fetchpriority="high" attribute for important above-the-fold images.
Optimize web font loading
Even if your main page element is an image, slow-loading text can still cause poor Speed Index scores.
Use the font-display CSS property to make sure text shows using a fallback font before the web font is downloaded.
Monitor Speed Index over time
Want to monitor Speed Index and other performance metrics on your website? Sign up for a free 14-day DebugBear trial.
DebugBear tests your pages on a schedule and captures Core Web Vitals data in a controlled lab environment as well as from Google's CrUX report that's used for rankings.
Get alerted when page speed gets worse and get detailed recommendations on how to improve your page speed.


Monitor Page Speed & Core Web Vitals
DebugBear monitoring includes:
- In-depth Page Speed Reports
- Automated Recommendations
- Real User Analytics Data