How To Fix LCP For Text Elements And H1 Headings
Seeing a text element, like an H1 heading, reported as the Largest Contentful Paint element on your website? This guide explains what this means and how you can fix it.
Text and headings as the Largest Contentful Paint element
Page speed tools like Lighthouse or DebugBear will tell you how long after opening a page the largest content element on the page becomes visible.
The LCP element can be:
- A text element, like a heading or
<p>tag - An image or video element
If a piece of text is responsible for the LCP, that element is often an H1 heading. That's because these tags are the primary page heading and tend to use a large font.
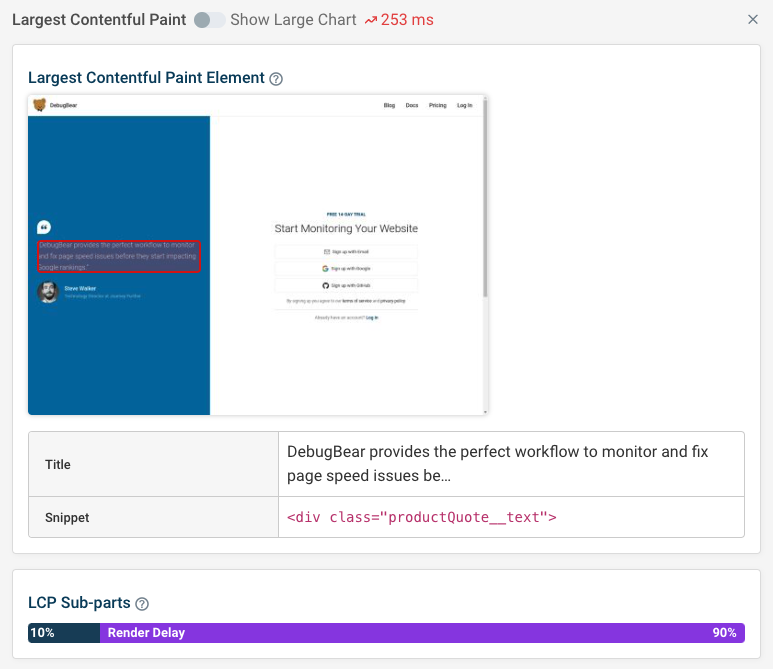
Here's what this might look like in the DebugBear speed test:
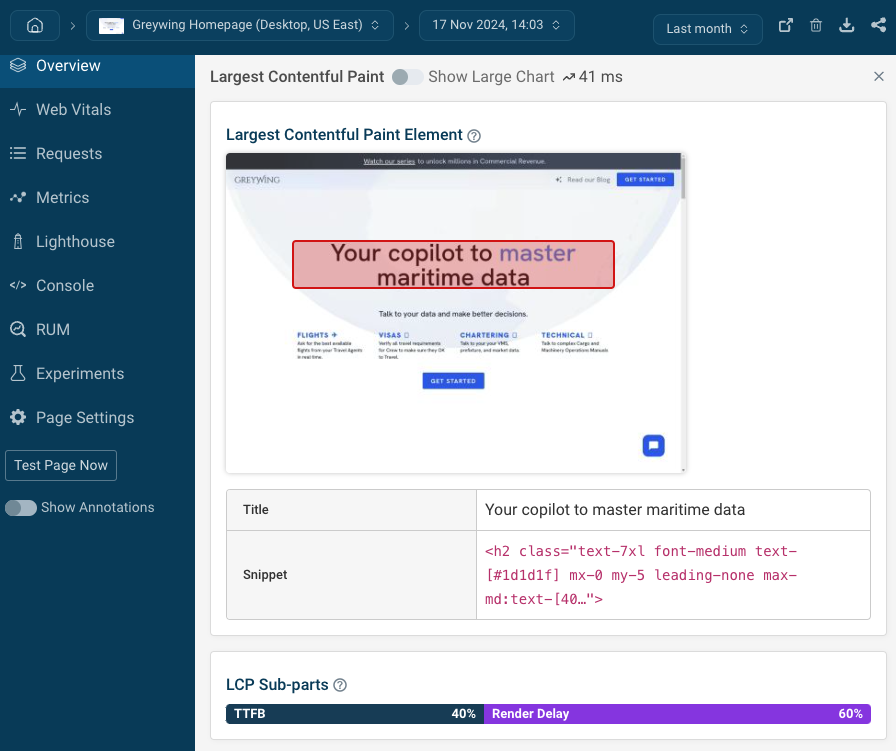
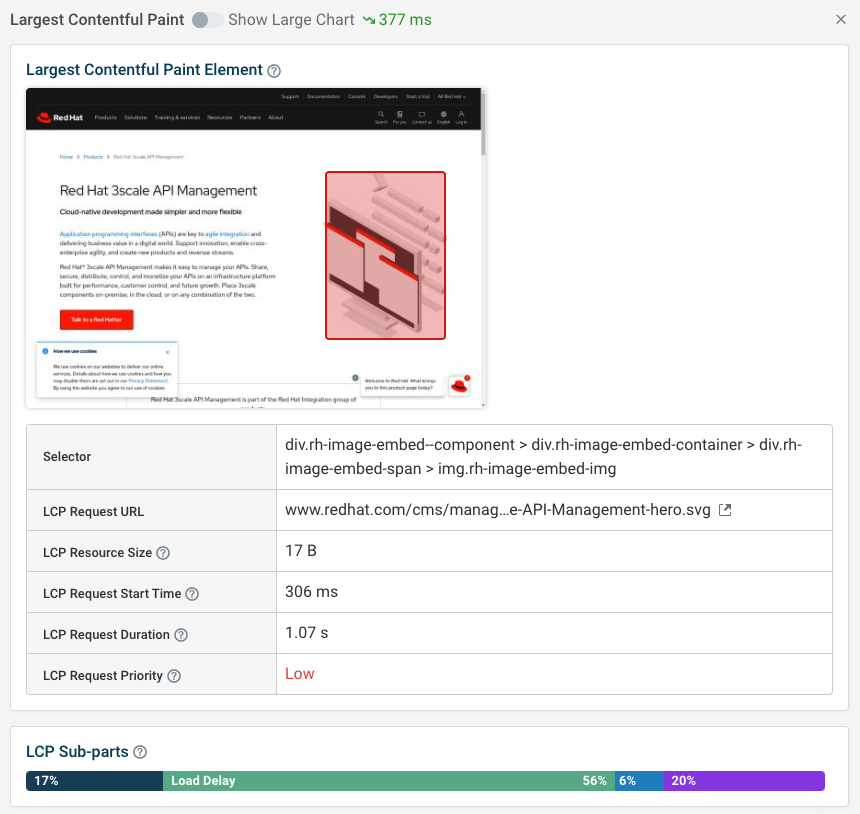
And here's an example from Google's Lighthouse test result on PageSpeed Insights, showing the Largest Contentful Paint element audit:
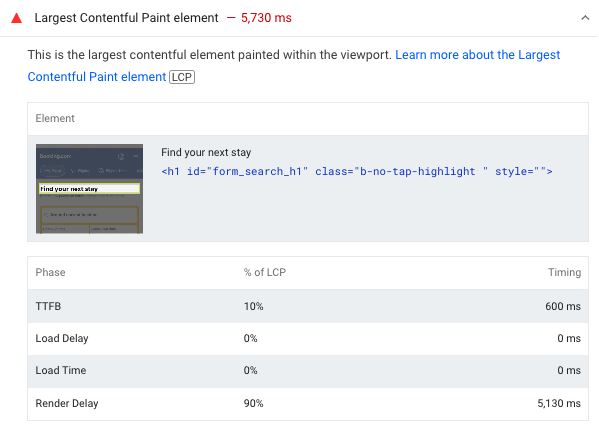
Both of these screenshots also show the LCP sub-parts breakdown. You'll see that the Load Delay and Load Time for text elements are always zero, as those only apply to downloading image files that are required to render the LCP element.
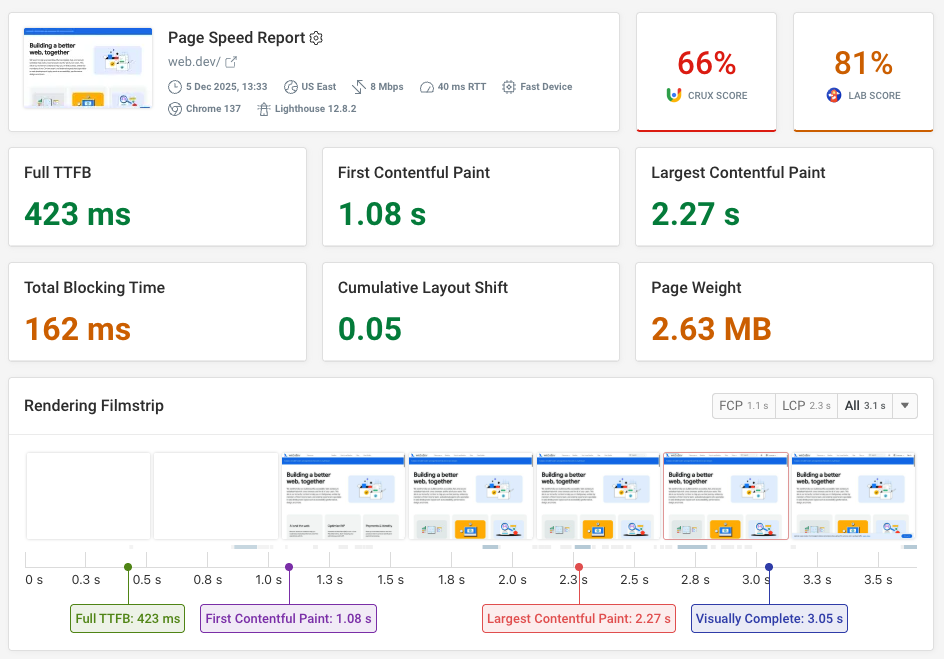

Run A Free Page Speed Test
Test Your Website:
- Automated Recommendations
- Detailed Request Waterfall
- Web Vitals Assessment
How to fix poor LCP for text elements
To fix LCP for text elements like headings there are a few things to consider:
- Is the server response slow?
- Are render-blocking scripts delaying content?
- Do fonts need to load to display the element?
- Is the element rendered using JavaScript?
Read on or watch this video to learn about how to identify and fix these issues.
Is the server response slow?
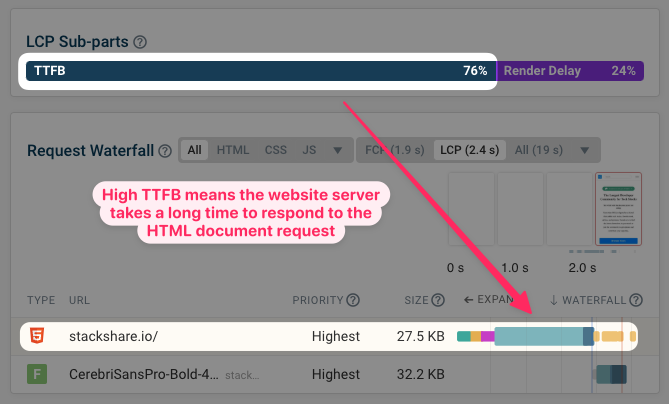
The first thing to check is whether the server takes a long time to serve the HTML document, or whether there are client-side rendering delays.
You can do that by looking at the Time to First Byte (TTFB) component of the LCP score. You can see an example in this request waterfall, where the poor TTFB means it takes a while for page content to appear.
Are render blocking scripts delaying content?
For browsers to display content it's not enough to load the HTML code. Important render-blocking files, like stylesheets and JavaScript code, also first need to load.
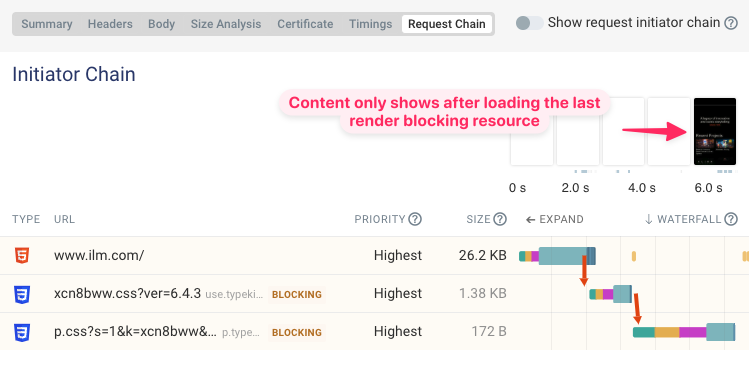
Here's an example of that. Two factors are slowing down the render-blocking resources:
- The first stylesheet references another one via
@import, so a new blocking resource is discovered by the browser over 3 seconds after the page has started loading - The HTML and the two stylesheets are all loaded from separate domains. That means new server connections need to be set up to download each file.
Do fonts need to load to display the element?
If a web font is required to render text then this will slow down your Largest Contentful Paint score. However, there are a few fixes for this:
- Use
font-display: swapto show a fallback font until the customwoff2file has been downloaded - Use a preload tag to load the font early and prevent delays
Is the element rendered using JavaScript?
For a typical application, text elements are rendered server-side and included in the document HTML.
However, sometimes JavaScript is required to display content:
- For single-page applications (SPAs)
- For modals like cookie banners and email signup modals
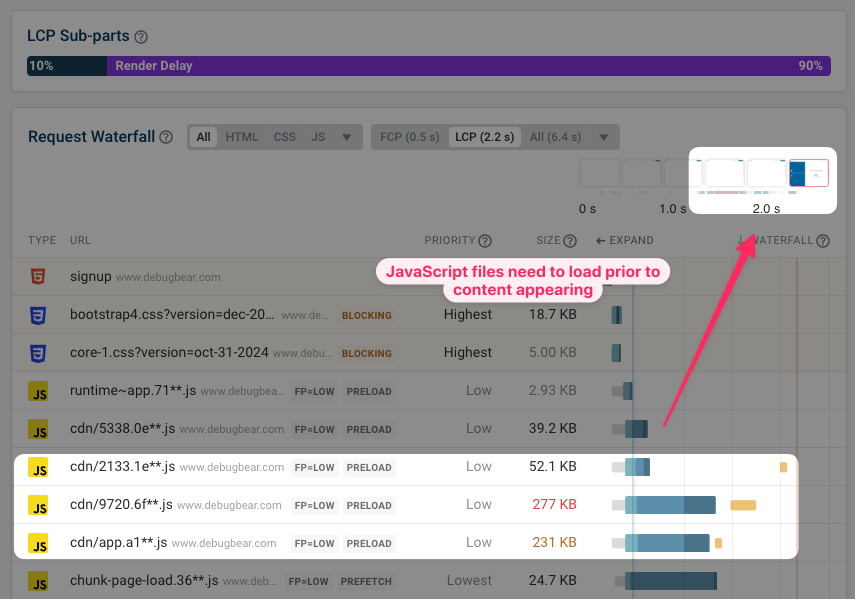
The screenshot below shows a very large render delay component, as it takes a while to download the JavaScript code files and run the code once it's loaded.
Optimize LCP when the LCP element is a p tag
Paragraph tags can also be responsible for the Largest Contentful Paint element, like in the example below. The steps to fix this are the same as for other text elements: start by checking your server response time and any render-blocking scripts.
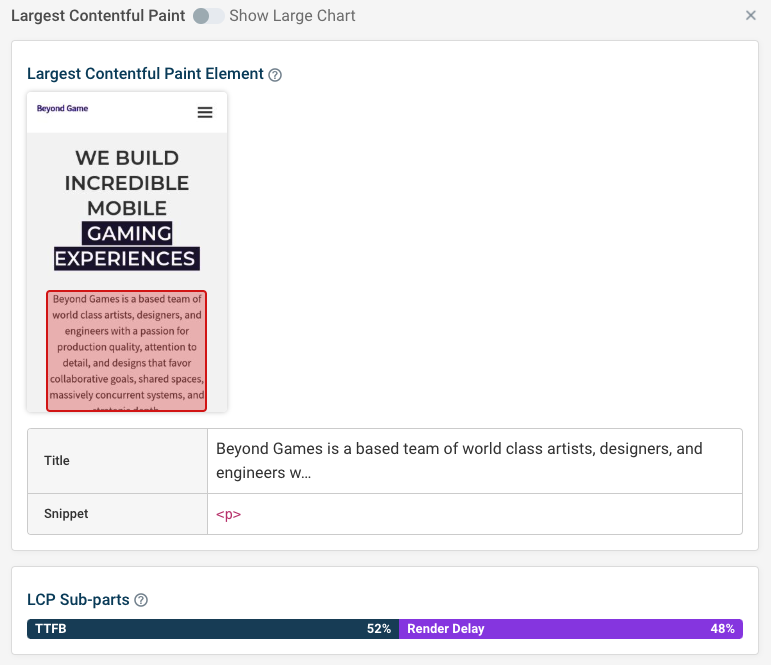
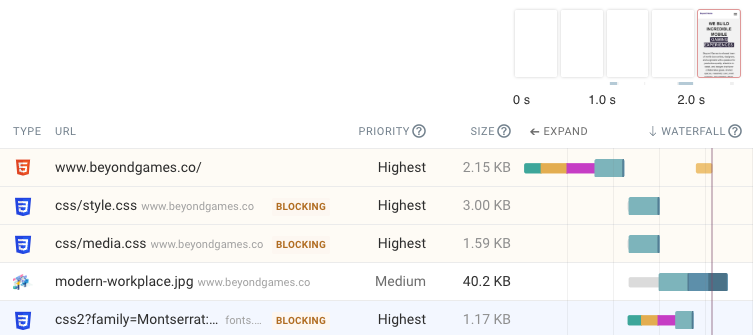
At about 2 seconds the LCP score for this example isn't too bad, but we can take a look at the request waterfall to see how we would go about optimizing it.
Two things need to happen to display the paragraph on this page:
- The HTML document needs to be loaded
- Three render-blocking CSS files need to be downloaded
Two of the stylesheets here load quickly, because they're hosted on the same domain as the document. But the third one is loaded from fonts.googleapis.com, so a new server connection is required. So this request finishes last and blocks the page content from appearing.
Since the server response time for the HTML is already good, you'll want to optimize this last render-blocking request here. You can do that by hosting the Google fonts CSS file on your own server, or even by embedding it in the page HTML.
Div tags as the LCP element
Like other elements that contain text, <div>s can also be the largest content element on the page. Here's an example:
The request waterfall view can give you a lot of insight into what's happening on the network and holding back rendering.
Headings, p, and div tags can also render images
Headings, paragraphs, and divs are all primarily wrappers for text content. But using CSS stylesheets, they can also be assigned background images. So sometimes you'll see an image LCP for these elements as well.
Improve Largest Contentful Paint on your website
Are you trying to fix your Core Web Vitals? DebugBear is a monitoring and optimization tool built just for that purpose.
We provide deep insight into your website performance, based on synthetic monitoring and real user data.
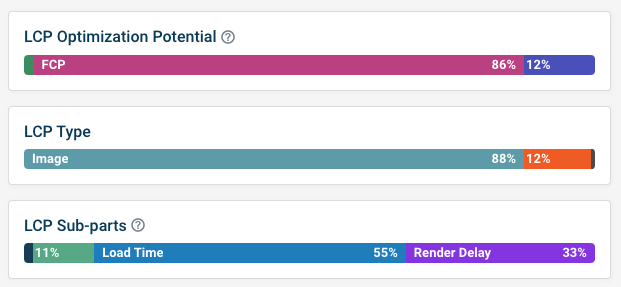
While the synthetic test reports provide a lot of detail on what's causing high LCP, our RUM data tells you how often different element types are responsible for the Largest Contentful Paint.
Sign up for a free trial today!


Monitor Page Speed & Core Web Vitals
DebugBear monitoring includes:
- In-depth Page Speed Reports
- Automated Recommendations
- Real User Analytics Data