Visually Complete Explained: What Does It Measure?
Visually Complete is a website performance metric that measures how long it takes for a website to fully load.
This article explains how exactly Visually Complete is measured and how it impacts user experience.
What does Visually Complete measure?
The Visually Complete metric measures how long after the initial navigation a web page finishes rendering. At this point all above the fold content has been fully loaded and no additional UI changes occur.
Every new paint increases the Visually Complete metric. That means that pages with a background video or even a small ongoing animation will have a high Visually Complete score.
Examples of Visually Complete
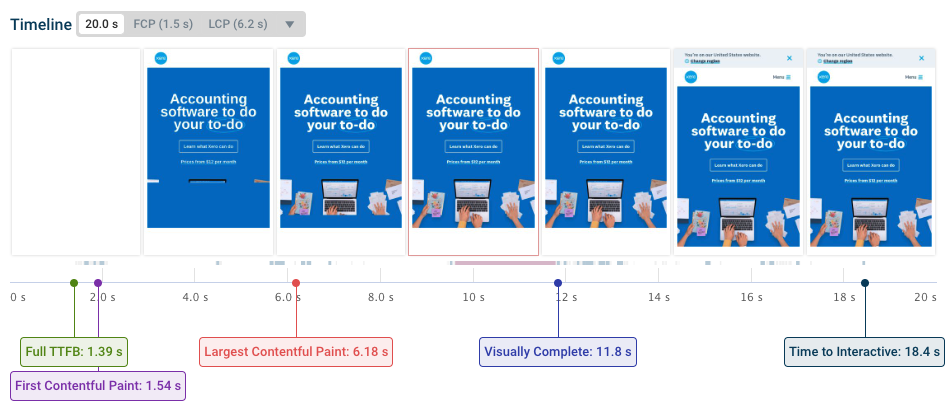
This filmstrip from DebugBear shows the Visually Complete milestone for the Discord homepage.
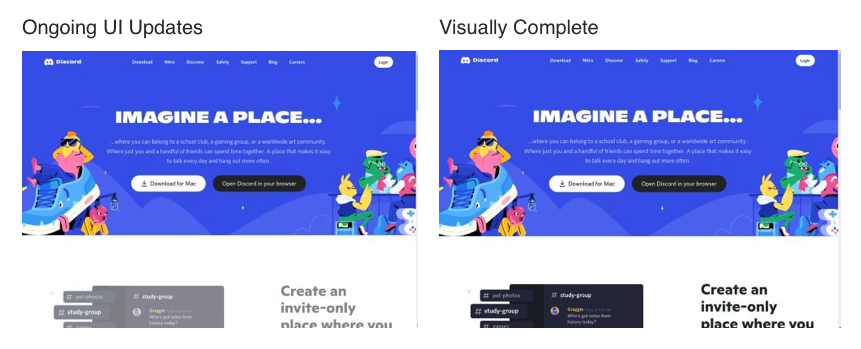
You can see that the largest page element is rendered early, as indicated by the Largest Contentful Paint marker. However, there are still ongoing UI updates further down on the page.
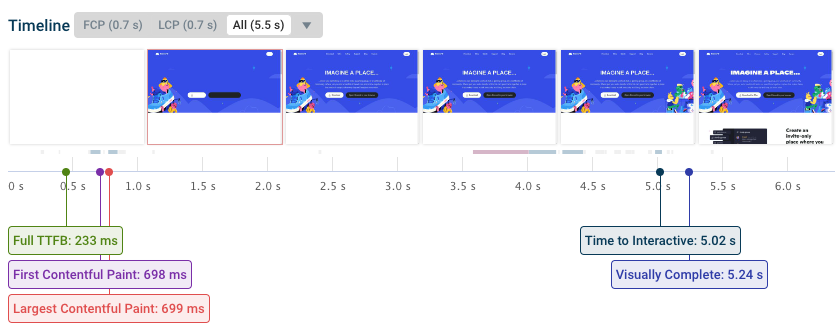
The Visually Complete state is only reached when all UI updates are complete.
If a page has continuous small updates the Visually Complete metric can occur very late. In some cases the Visually Complete value is only recorded when the page test itself is complete.
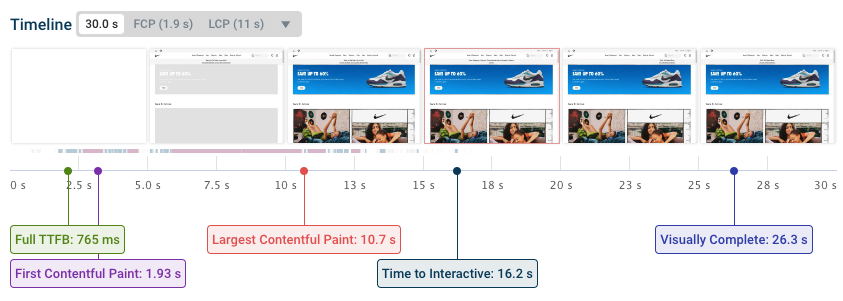
We can see that there are small ongoing UI updates, highlighting different product promotions.
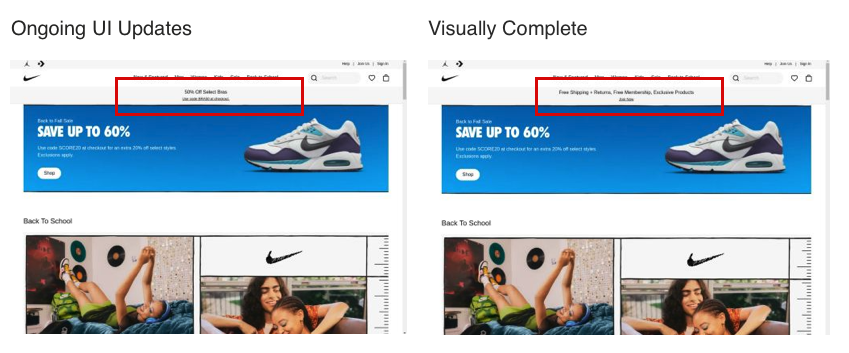
However, the page can also stop rendering before all background network and CPU activity have finished.
Should you optimize Visually Complete?
Visually Complete is a metric that's primarily used to debug page behavior and understand how long it takes for a page to fully render. However, small ongoing animations or similar features don't necessarily hurt user experience.
Other metrics like Largest Contentful Paint or Speed Index are a better measure of when the page has mostly finished loading. Both of these page speed metrics present a more nuanced view of visual rendering progress.
While Visually Complete can be impacted by small changes on your website, it also puts an upper bound on how long visitors need to wait for the full page content. In many cases, additional content like chat widgets or search fields is important for user experience, even if not every visitor wants to contact support or search through content.
Visually Complete vs. Speed Index
Visually Complete and Speed Index are similar metrics, because they both look at the rendered filmstrip rather than measuring paint events or request timings.
However, Visually Complete marks a specific rendering milestone. In contrast, Speed Index is a statistical measure of how much content is displayed at different points in time. That makes Speed Index less impacted by small changes, but it doesn't indicate that the page is fully loaded.
How to monitor Visually Complete and other website performance metrics
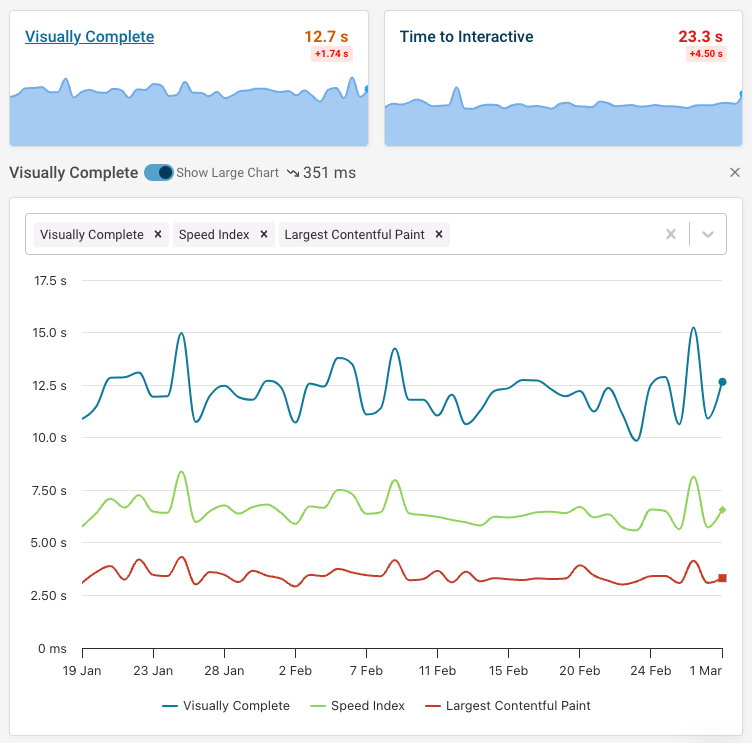
You can use DebugBear synthetic website monitoring to measure Visually Complete and other performance metrics like Largest Contentful Paint over time:
- Get alerted to regressions
- Inspect before and after results
- Identify opportunities for website performance optimization


Monitor Page Speed & Core Web Vitals
DebugBear monitoring includes:
- In-depth Page Speed Reports
- Automated Recommendations
- Real User Analytics Data