A Guide To Synthetic Website Monitoring
Synthetic website monitoring is a process for keeping your website fast and reliable. A variety of synthetic testing tools can help you deliver a good user experience.
In this article, we'll take a look at what synthetic monitoring is, what it can do, and what to look for in a monitoring solution.
What is synthetic website monitoring?
Synthetic monitoring is a way to test a website by regularly opening it in a controlled test environment and measuring characteristics like loading speed, SEO, or uptime. Continuously monitoring these metrics helps software teams optimize their website and prevent regressions.
In contrast to real user monitoring (RUM), synthetic tests don't rely on actual visitors to come to your website. That means synthetic data can be collected on-demand, including in staging environments or in a Continuous Integration (CI) pipeline.
What are lab and field data?
Lab data is another word for synthetic data, and field data refers to real user metrics.
The term "lab data" highlights that the user can control the test environment and specify characteristics like these:
- Device size
- Network speed
- CPU speed
- Test location
Types of synthetic monitoring
Many aspects of a website can be assessed as part of a synthetic test. For example, you can do the following:
- Web performance monitoring
- Availability monitoring
- SEO monitoring
- Transaction monitoring
Web performance monitoring
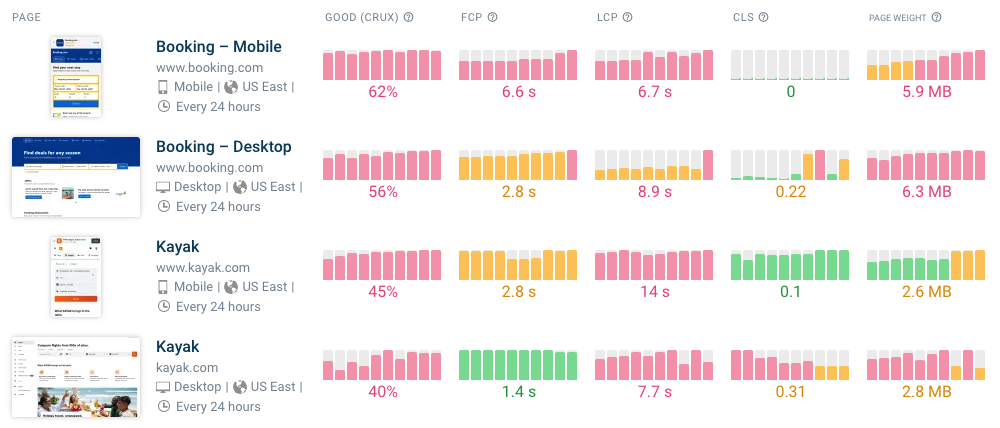
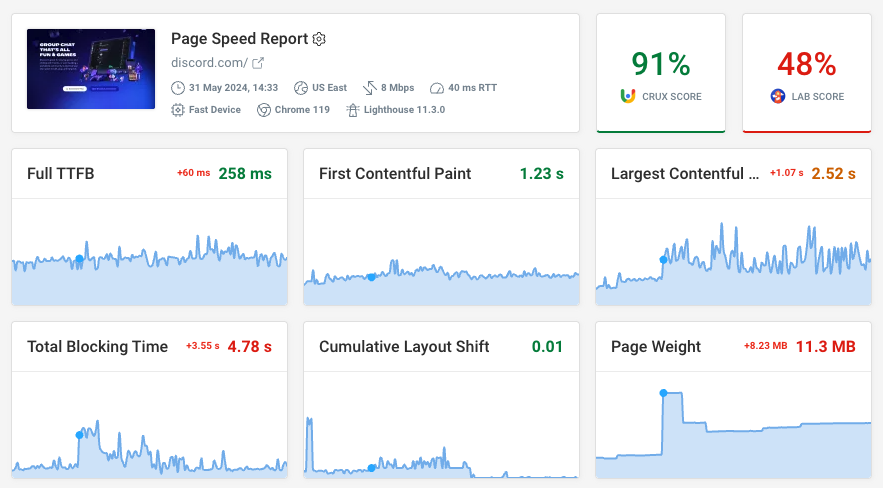
Web performance monitoring means keeping track of your page load time over time, for example, by looking at metrics like the Largest Contentful Paint.
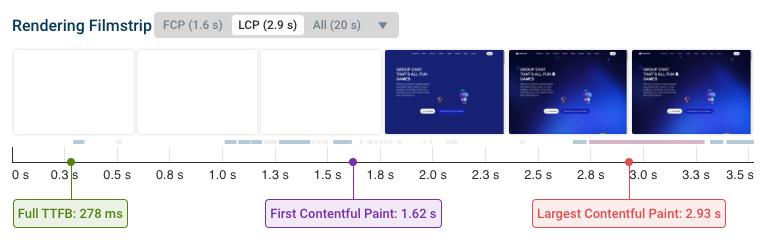
The page is opened in a browser as part of each test, so that realistic user data can be collected. Performance monitoring data also includes debug data, like rendering filmstrips or request waterfalls. This can help you optimize your page speed and identify the cause of performance regressions.
In addition to predefined metrics like page load time, page weight, or CPU time, you can also define custom metrics using the user timing API. These metrics can be tailored to your specific visitor needs and technical implementation.
Availability monitoring
Availability monitoring, or uptime monitoring, focuses on regularly checking if your website is still reachable and content renders as expected.
Tests are run at a high frequency, often every minute or more. In turn, the depth of each test result is often quite limited, focusing on overall test duration without providing details for optimization.
SEO Monitoring
SEO monitoring means testing your website regularly and assessing on-page factors that can impact search indexing. For example, tools like Ahrefs crawl your website and detect broken links or missing headings.
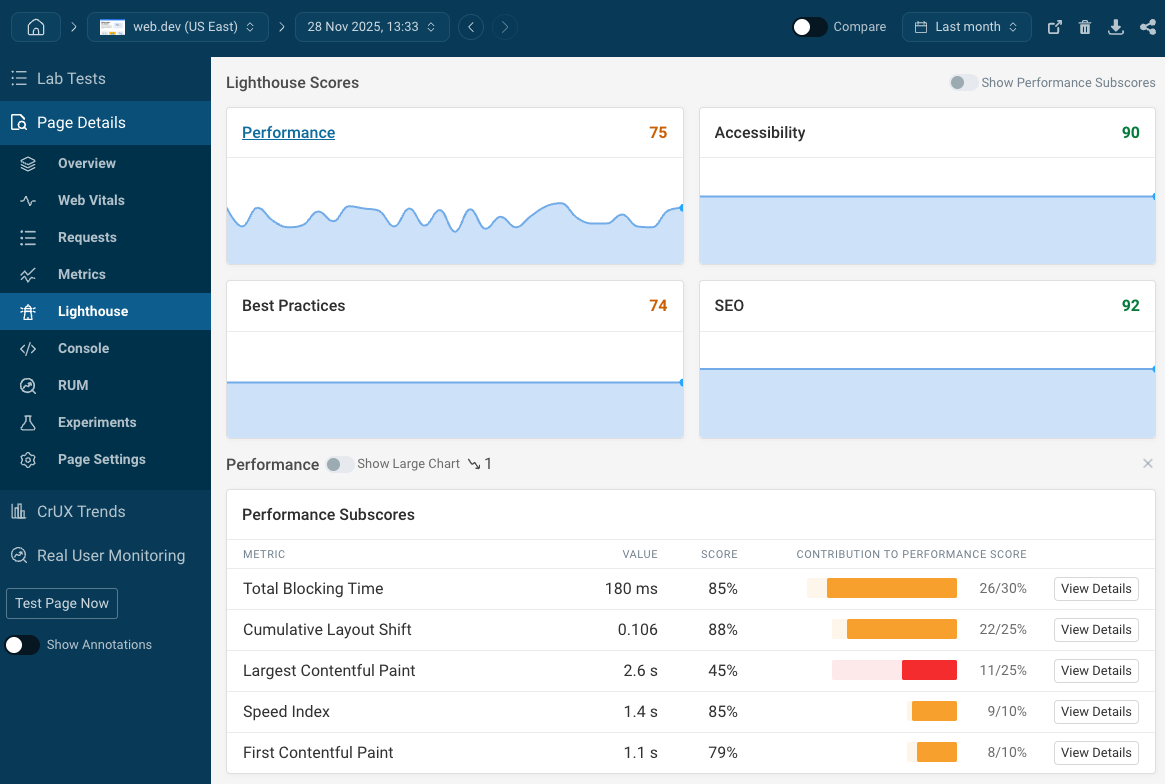
Google's Lighthouse tool can also detect common SEO problems like missing alt text or non-descriptive links. This is captured in the Lighthouse SEO score.
Transaction Monitoring
Synthetic transaction monitoring means running more complex tests that include page interactions and visits to different pages on your website. User input is scripted so that the browser navigates through several pages or screens over the course of the test.
That means that transaction monitoring can provide data for whole user flows, for example, the checkout flow on an ecommerce website.
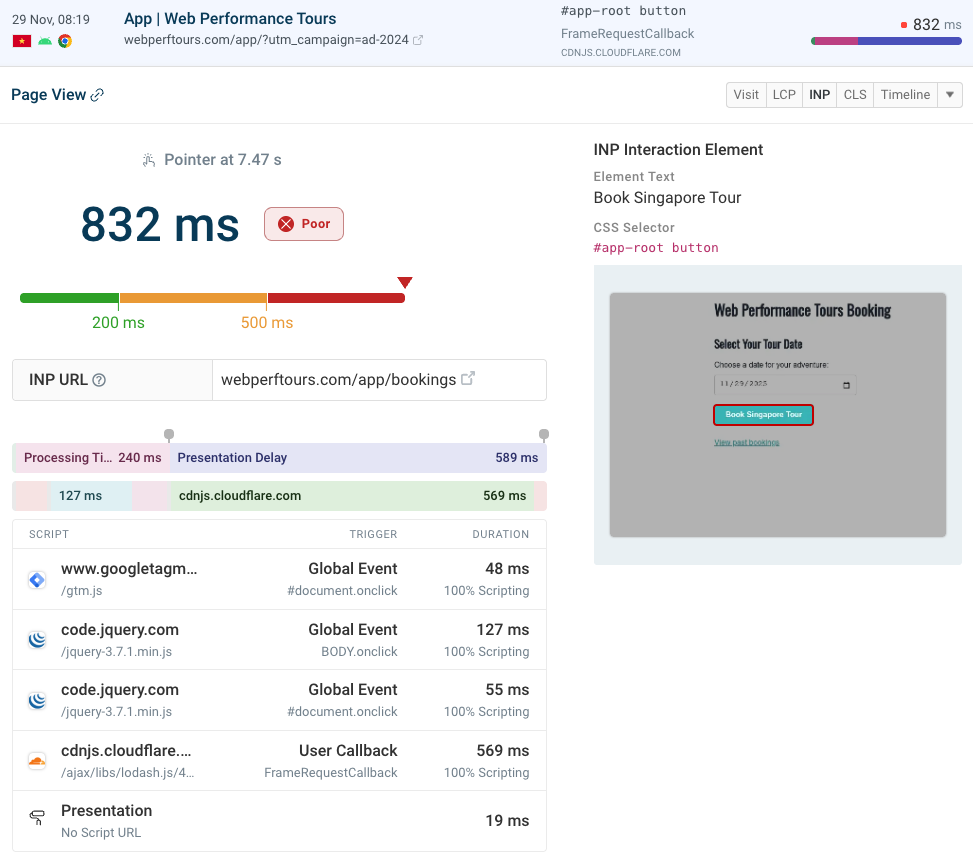
For example, you can track the load time of different pages or track Interaction to Next Paint scores for different UI elements.

Why is synthetic performance monitoring important?
Monitoring the performance of your website is needed for a few reasons:
- Page speed is important for user experience
- Faster sites have higher conversion rates
- Google's Core Web Vitals metrics impact SEO
- Reducing server load and hosting costs
Faster websites perform better on a number of business metrics. Monitoring puts you in the position of knowing how your website is performing, having data to identify optimizations, and getting notified when something goes wrong.
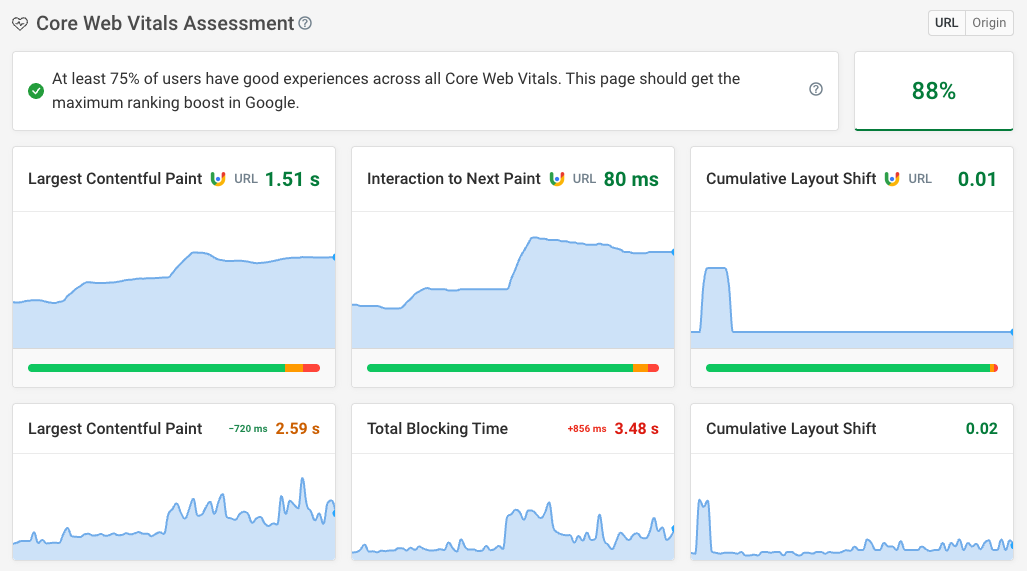
Core Web Vitals
Google's three Core Web Vitals metrics were developed to automatically assess user experience on a website. They've since become a search result ranking factor.
- Largest Contentful Paint measures page load time
- Cumulative Layout Shift measures visual stability
- Interaction to Next Paint measures website responsiveness
Synthetic monitoring can help you track and debug the Largest Contentful Paint and Cumulative Layout Shift metrics.
Real user monitoring lets you measure Interaction to Next Paint scores for real user interactions. For example, you can see what user interactions are most likely to be slow and what scripts are causing delays.
How to set up synthetic monitoring
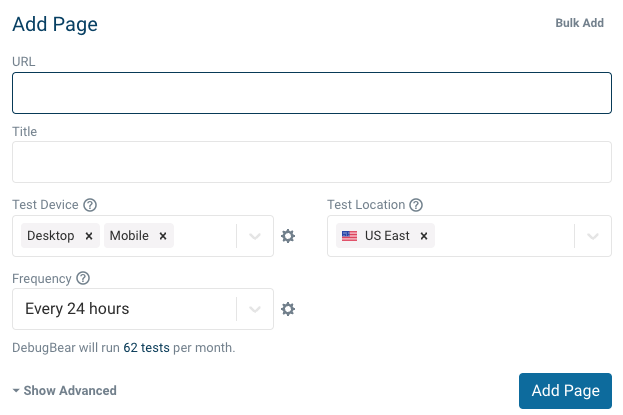
Synthetic performance monitoring is easy to set up—you just need to enter the URL of the page you want to monitor.
You can also configure the device type you want to test on and pick a test location that matches where your users are located. If you have customers across the globe, it makes sense to test your website from multiple test locations.
Sign up for a free DebugBear trial to get started.
How to use synthetic test data to optimize your website
Synthetic monitoring tools don't just track your metrics over time but also provide in-depth reporting as part of each test result. This helps you identify what's causing poor performance and how you can improve.
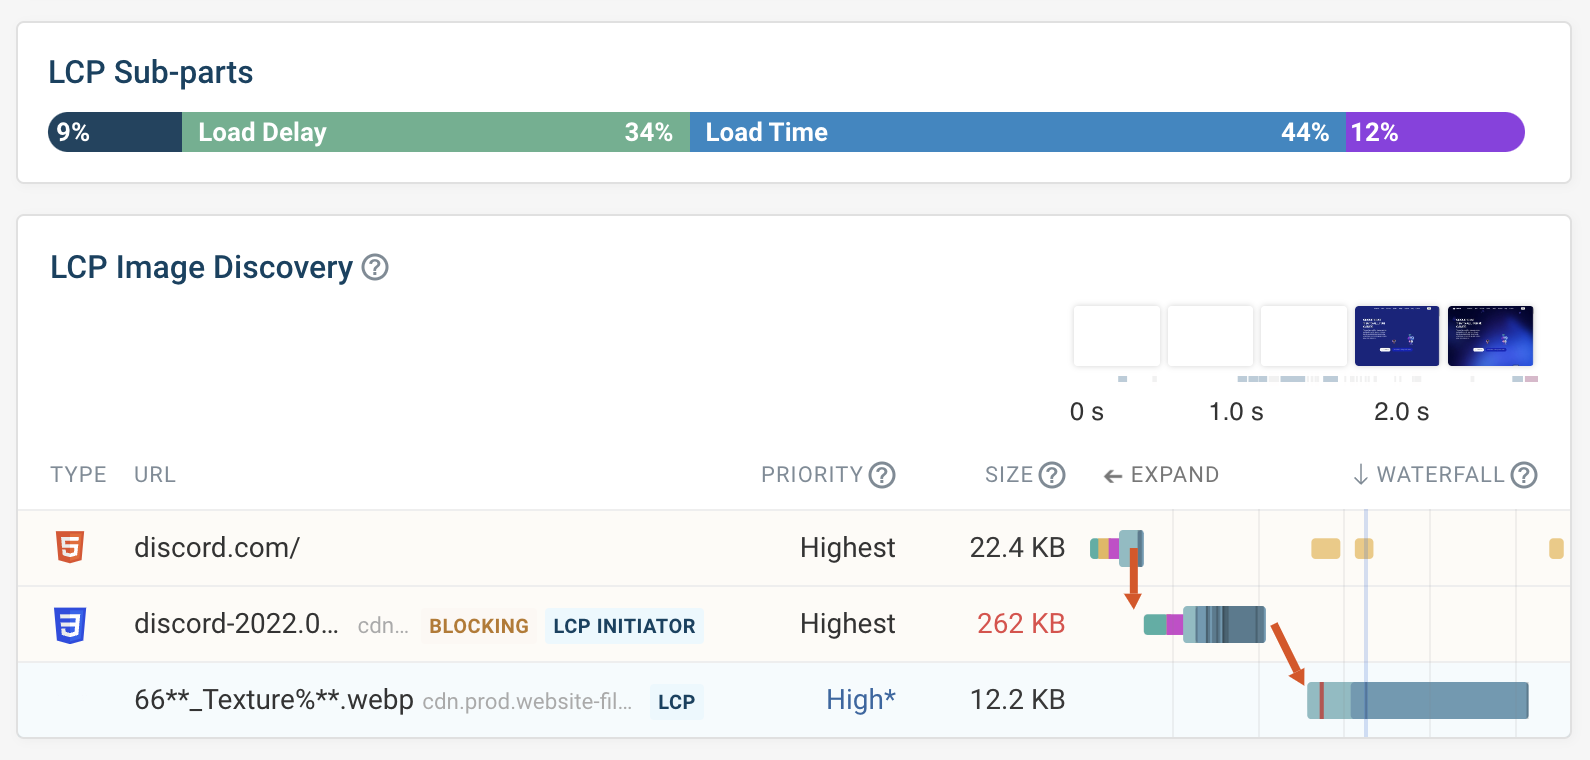
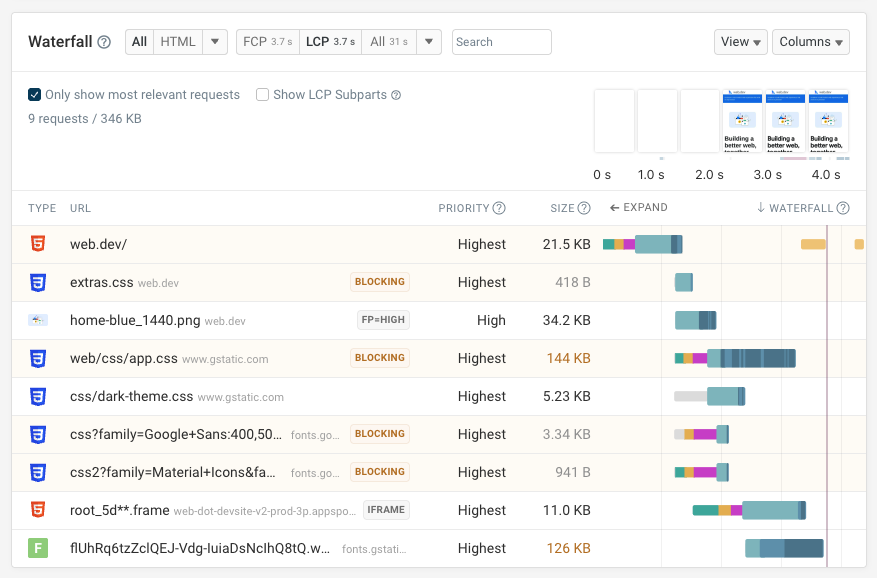
For example, if you have a high Largest Contentful Paint score, it's helpful to look at different LCP components to see which one is causing the delay.
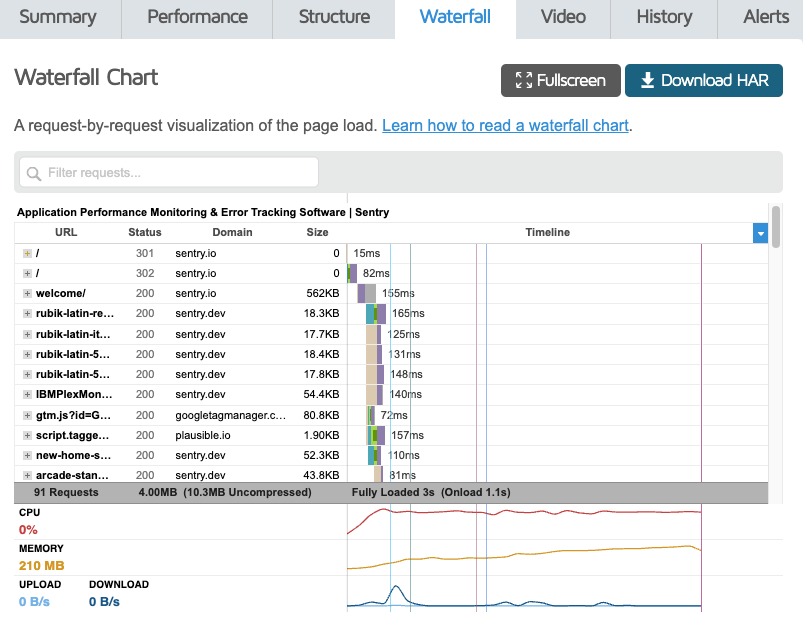
Request waterfalls are also an important tool to help you see what resources your website loads and how that impacts rendering. The waterfall view can show details like the request duration, priority, response size, and any server connections necessary to load the resource.
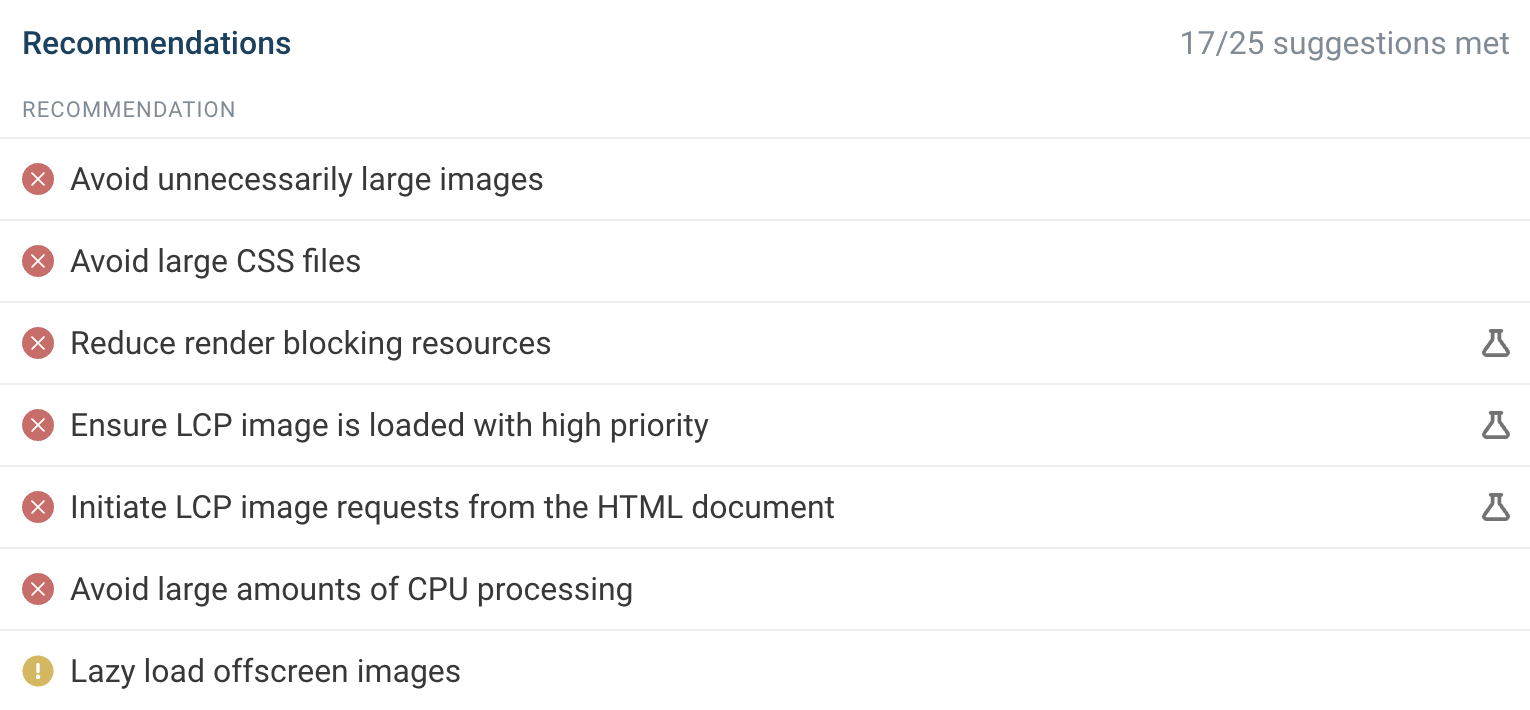
Page speed tools like DebugBear also provide a prioritized list of page speed recommendations that you can apply to make your website faster.
How can synthetic monitoring help fix regressions?
First of all, if you have monitoring set up, you'll get notified of any major changes to your website and be able to see when changes have occurred historically.
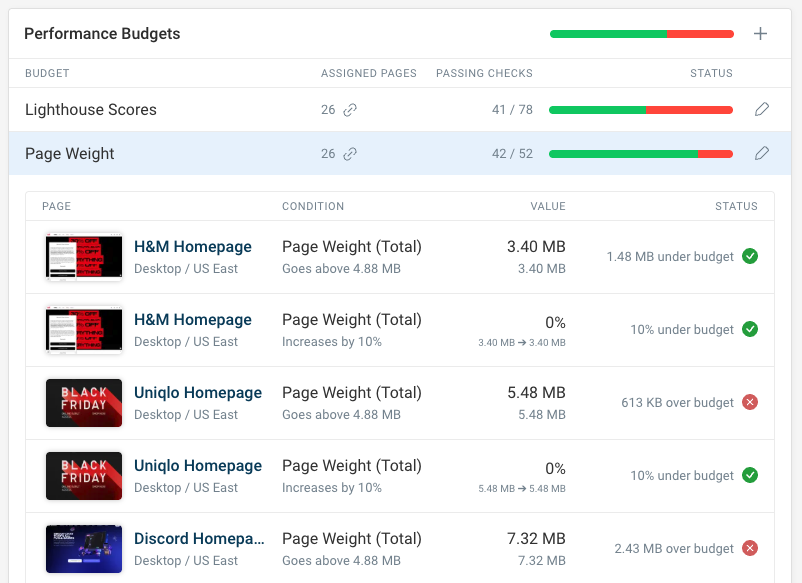
Alerting can be automatic, or you can configure custom performance budgets for your website.
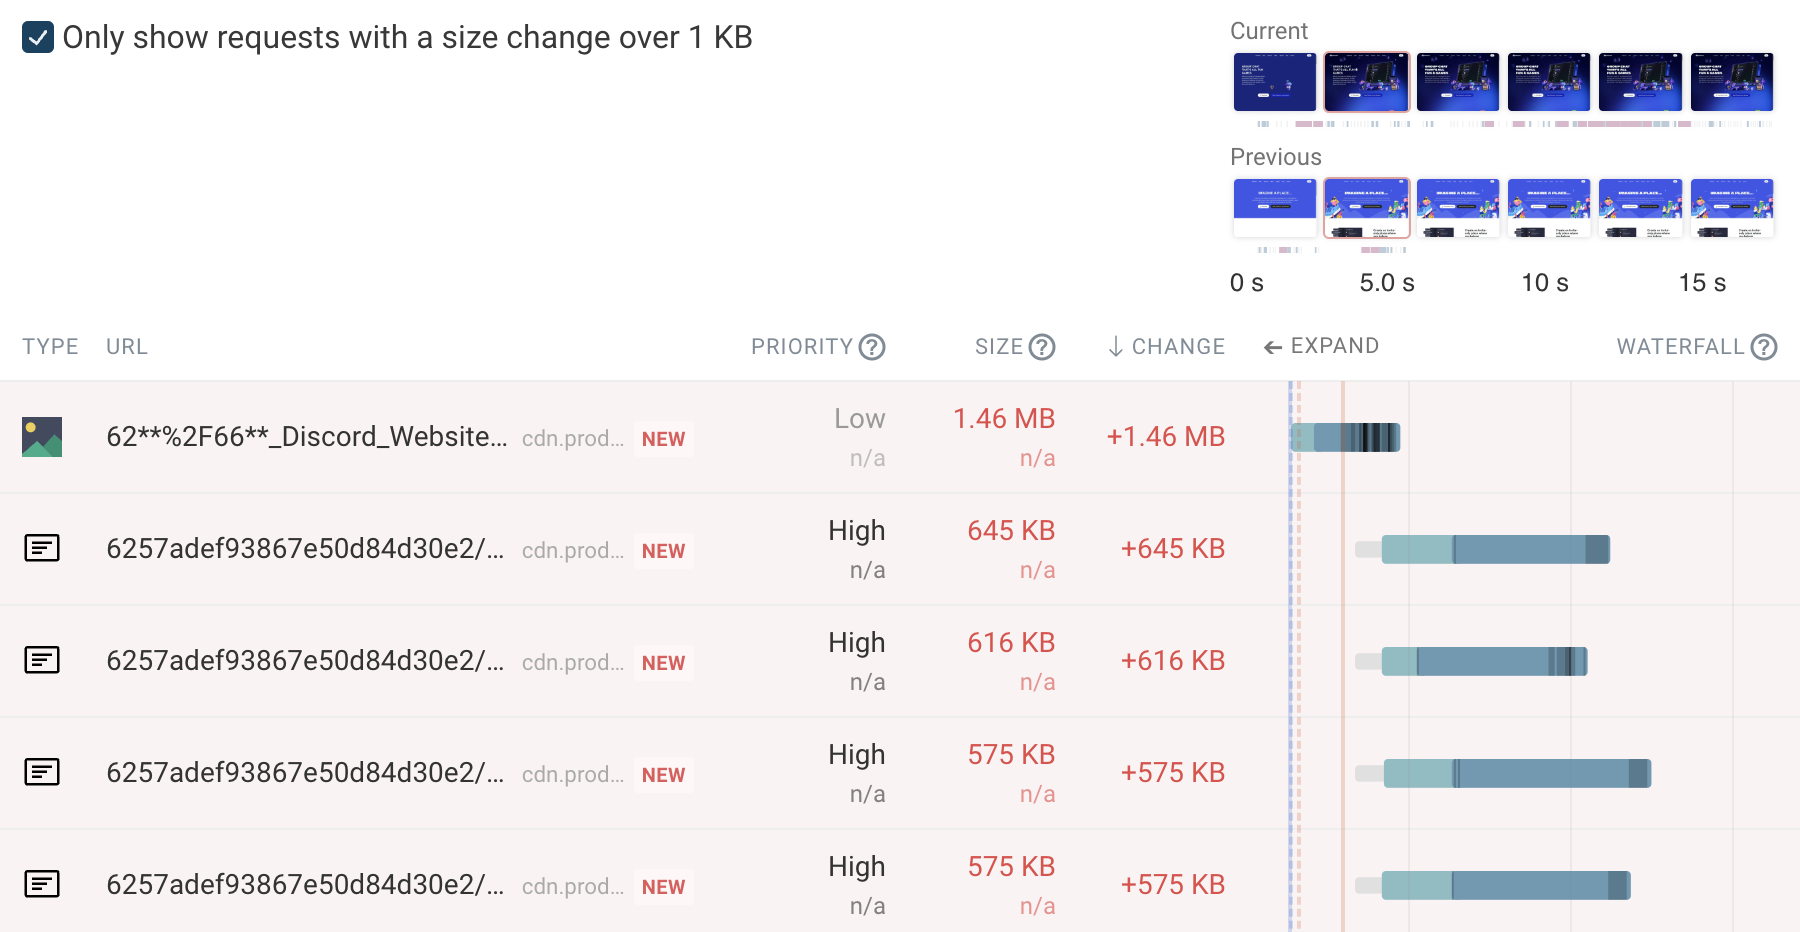
But having past monitoring data also means you can compare test results when you see a metric get worse. For example, if you see an increase in page weight, you can check your data to see what new files were added or which existing files changed in size.
What are the limitations of synthetic monitoring?
Synthetic website performance monitoring is a great way to get insight into your web performance and track page speed over time. However, as data is collected in a lab, synthetic data won't tell you how your visitors actually experience your website.
Lab tests also don't work very well for metrics that often depend on user interaction. For example, layout shifts often increase after the initial page load when a user interacts with the page.
What are the best synthetic monitoring tools?
There are a lot of great synthetic website monitoring tools out there. What's best for you depends on the needs of your team and your budget.
DebugBear
DebugBear is a full-service website performance monitoring tool that combines synthetic monitoring and real user data. You can also keep track of data from Google's Chrome User Experience Report (CrUX), which impacts rankings.
The tool is focused on optimizing the Core Web Vitals, but also provides over 70 metrics for debugging.
DebugBear provides a wide range of debug data:
- Detailed request waterfall
- Lighthouse report
- Custom recommendations
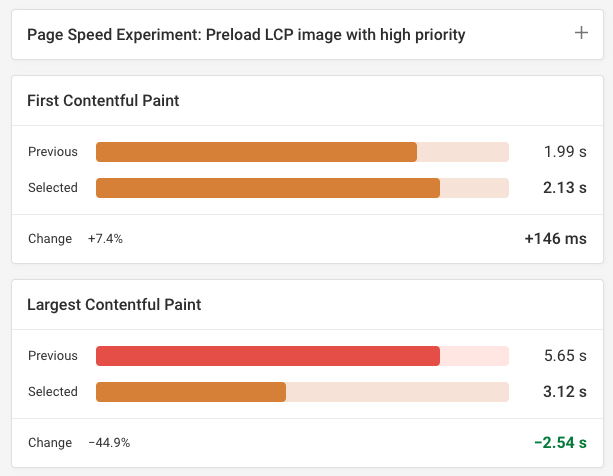
You can also try out optimizations on your website without making any production changes by using the experiments feature. Here's an experiment preloading the Largest Contentful Paint image that results in a 45% reduction in page load time.
Define custom budgets to stay on top of your performance. Alerts can be sent out via email, Slack, or in Microsoft Teams.
The budgets dashboard shows the overall status of your budgets as well as the specific page-level alert thresholds you've configured.
Pingdom
Pingdom provides a broader range of website monitoring features instead of focusing on just page speed. That means you can run synthetic tests, uptime monitoring, transaction monitoring, and real user monitoring all from the same tool.
However, that means that the tool is less focused on modern user-centric metrics like the Core Web Vitals. You also get less detailed debug data and performance recommendations.
GTmetrix
GTmetrix is a tool that's focused entirely on synthetic testing. You can get a detailed request waterfall and the performance recommendations from Google's Lighthouse tool.
Its pricing options also start from just $5 a month, making it a great tool for small companies to get started with web performance.
Features to look for in a synthetic monitoring tool
Here are a few key features to look for in the performance data:
- Rendering video view
- Request waterfalls
- Core Web Vitals data
- Performance recommendations
- Experiments
- Comparison between test results
- Global test locations
And this is what you'll want to look for in terms of alerting:
- Can you configure performance budgets?
- What channels are supported?
- Is there a weekly high-level report?
Get started with synthetic monitoring
Synthetic monitoring is one aspect of a good digital monitoring strategy. You can track page load time, technical metrics, Lighthouse scores, Core Web Vitals, and more.
DebugBear includes both synthetic monitoring and real user monitoring for comprehensive web performance coverage.
You also get in-depth insights to help you improve your page speed:
- Detailed request waterfall
- Video recording, including side-by-side before and after view
- Custom performance recommendations
- Size analysis for HTML and CSS


Monitor Page Speed & Core Web Vitals
DebugBear monitoring includes:
- In-depth Page Speed Reports
- Automated Recommendations
- Real User Analytics Data