Building a great website isn't just about good content and an attractive design. You also have to deliver a good user experience (UX).
There are a lot of factors that impact UX. In this article we'll look at the role website speed plays for your website and what web performance monitoring tools you can use to improve it.
What is website performance monitoring?
Web performance monitoring tools continuously measure page speed and overall site health to provide an assessment of your website and alert you to any performance issues that arise.
Why use a web performance monitoring tool?
By making sure your website is fast, you provide a good user experience for your visitors. That not only helps with conversions but also with Google rankings.
Website performance monitoring provides you with the data you need to optimize your website, as well as alerting you when any problems arise.
While there are many different types of website monitoring, in this article we'll focus on software that helps you measure and optimize your page speed. They help you keep track of your website's performance, get alerted to new issues, and find ways to optimize.
Comparison of website monitoring tools
In this article we'll take a look at a number of services to help you decide what the best website monitoring tool is for you. This will depend on factors like the purpose of your website, the size of your team, and available budget.
A big web application with many developers might be best served by one tool, while monitoring a marketing website based on a CMS might have different requirements. Comparing various available options will provide a strong starting point to pick a website monitoring service.
1. DebugBear
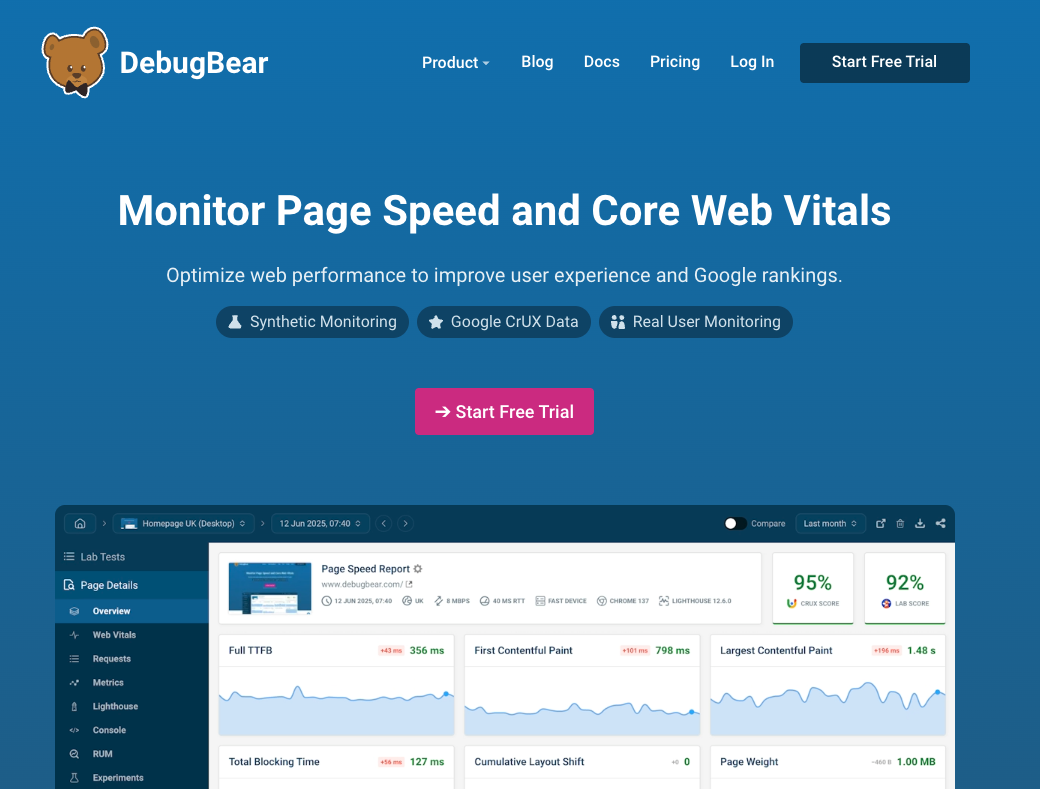
DebugBear is a website monitoring tool that combines three different types of performance data:
- Synthetic website monitoring: scheduled lab-based testing
- Real user monitoring (RUM): analytics on real visitor experiences
- CrUX monitoring: data Google publishes about real Chrome visits
DebugBear is focused on helping development and marketing teams optimize the Google Core Web Vitals of their website. The price starts from $49/mo.
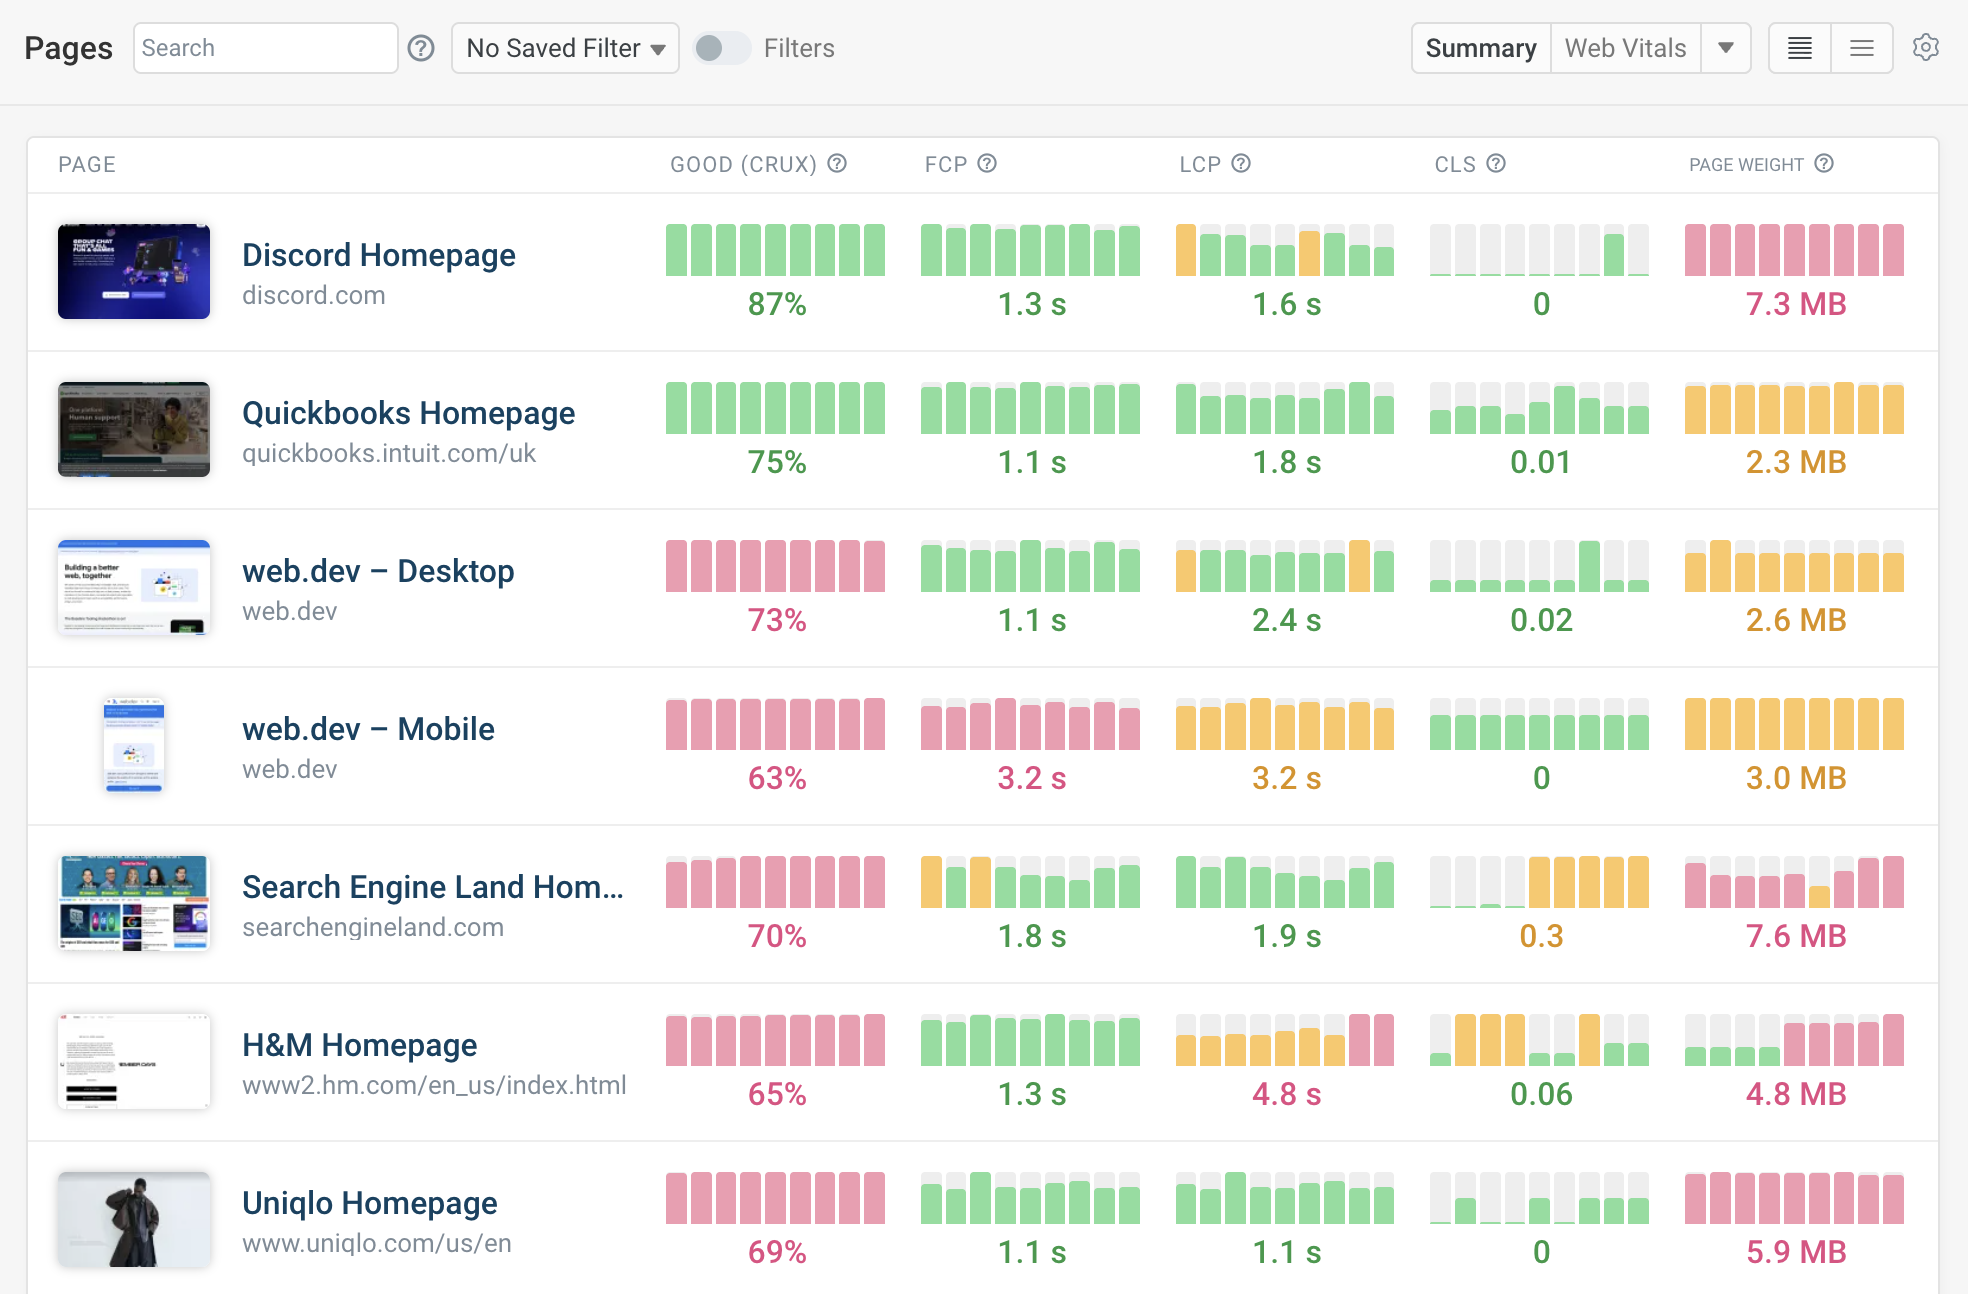
Scheduled tests on DebugBear let you keep track of your own website performance and get alerts when there's a problem. You can also track your competitor websites to make sure you're leading in the industry.
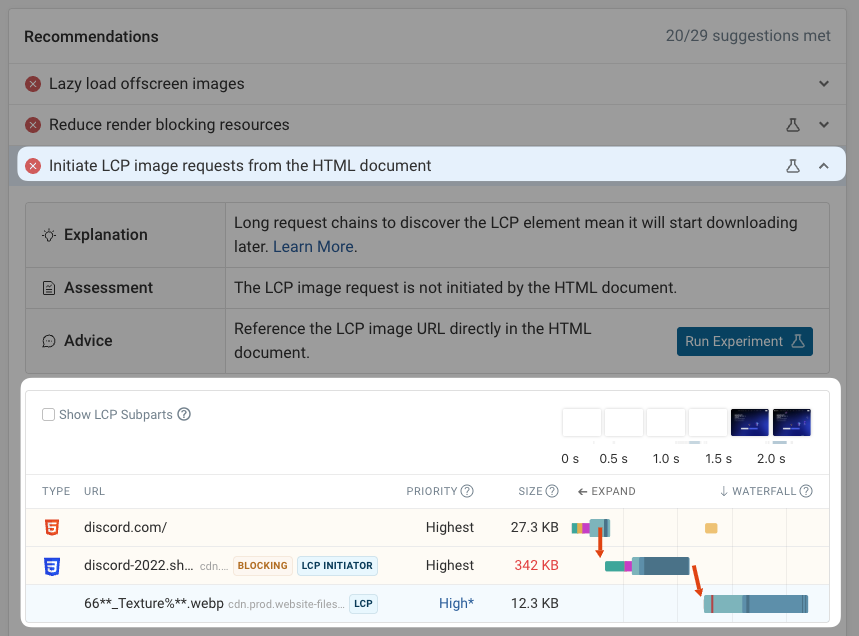
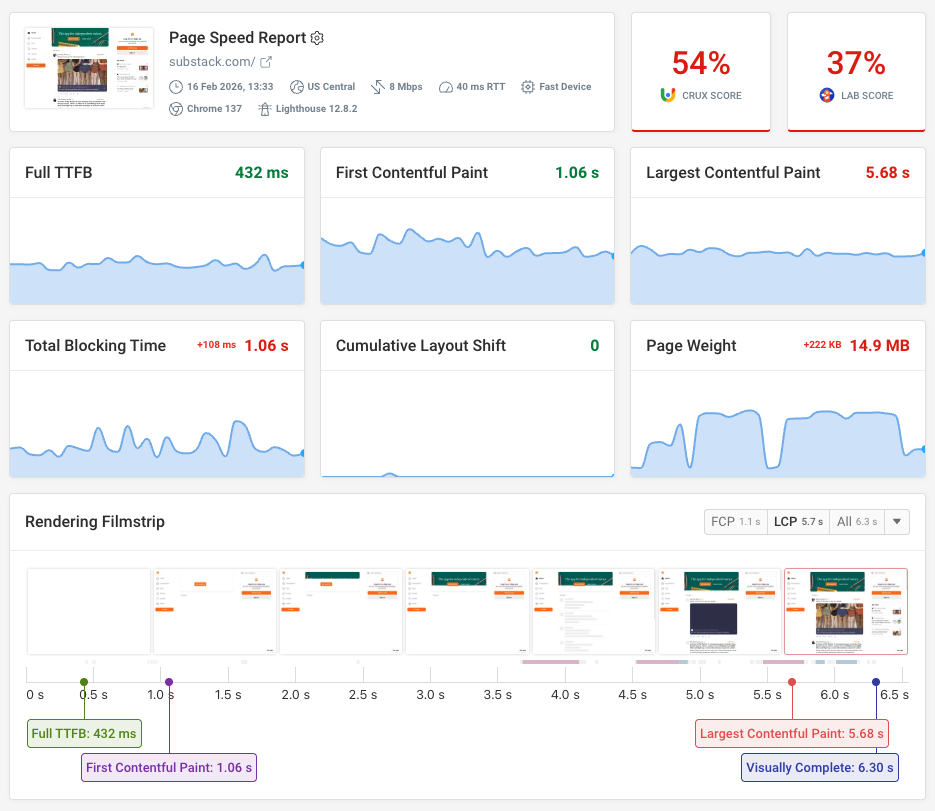
Each page speed test result includes a detailed technical report to help users identify high-impact optimizations on their website. For example, the report includes:
- Custom recommendations
- A network request waterfall
- Google Lighthouse scores
- Insight into slow CPU processing
- An analysis of third-party code
You can also try out some optimizations using experiments, so that you can quickly get an estimate of how effective the change would be.
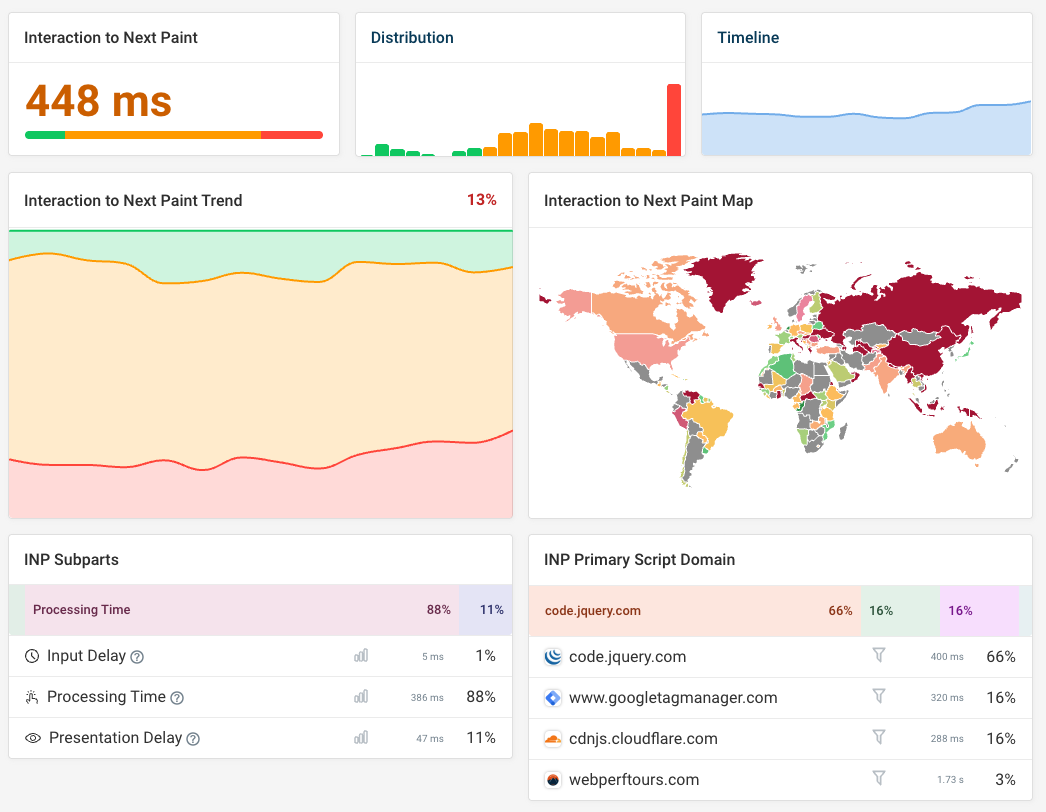
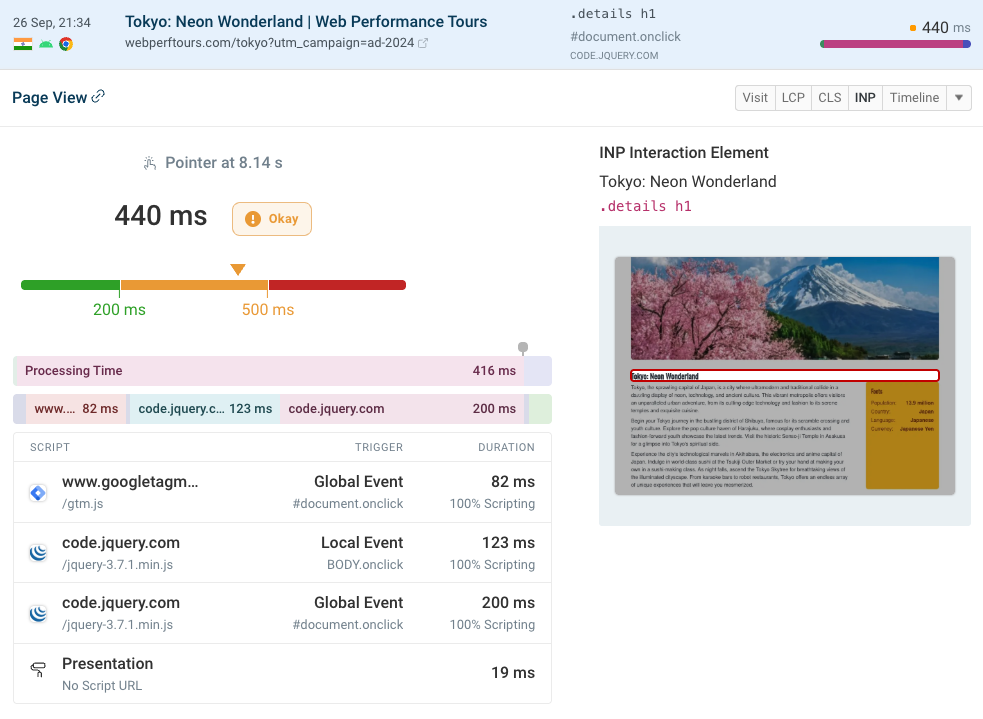
In addition to the scheduled synthetics tests, DebugBear also shows you how your actual visitors experience your website.
This is especially important to improve Google's Interaction to Next Paint (INP) metric, which depends on a real user action that can't easily be simulated in a lab environment.
Here are some of the key features of DebugBear:
- Over 30 different test locations and customizable mobile and network devices
- Real user Core Web Vitals monitoring with focus on Interaction to Next Paint
- Configurable alerting by email, in Slack, and in Microsoft Teams
- Easily share test results with team members and clients
There are also some advanced features like performance budgets and detailed data on slow user interactions.


Monitor Page Speed & Core Web Vitals
DebugBear monitoring includes:
- In-depth Page Speed Reports
- Automated Recommendations
- Real User Analytics Data
2. GTmetrix
GTmetrix has long been an established tool for running synthetic website speed tests. You can:
- Run website speed tests from a range of different test locations
- Track performance metrics over time
- View how the website renders and debug this with a request waterfall
GTmetrix does not support tracking real user or CrUX data.
Pricing: from $3.50/mo
Web performance monitoring with GTmetrix lets you track key metrics over time and get alerted when there's an issue with how your website performs. You can also start monitoring some of your slow loading pages to check that your efforts to make them faster are working as expected.
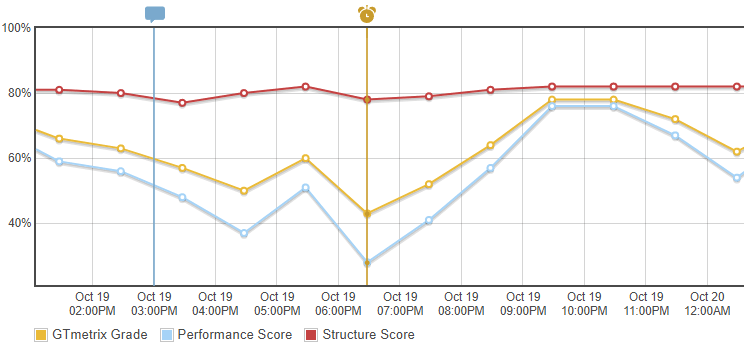
GTmetrix provides 22 locations worldwide, so you can see how users across the world experience your page load time.
If you're currently using GTmetrix, check out our list of GTmetrix alternatives.
3. SpeedCurve
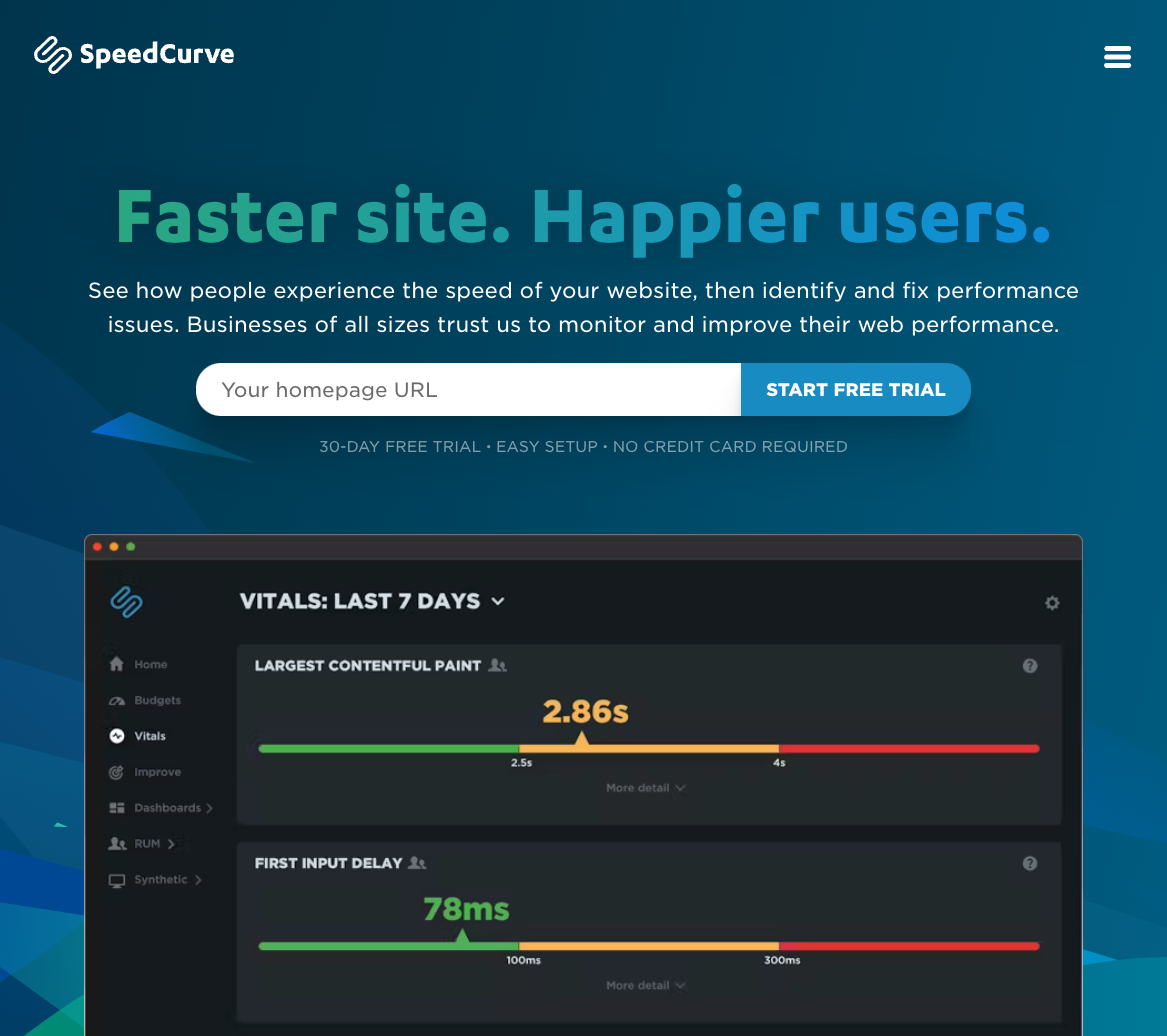
SpeedCurve is a great website performance tool, helping you keep track of both synthetic and real user data. It supports:
- Detailed request waterfall analysis
- Custom performance dashboards
- Real user web vitals debugging
SpeedCurve also supports monitoring Lighthouse scores, so you can see performance recommendations as well as an SEO, accessibility, and best practices assessment.
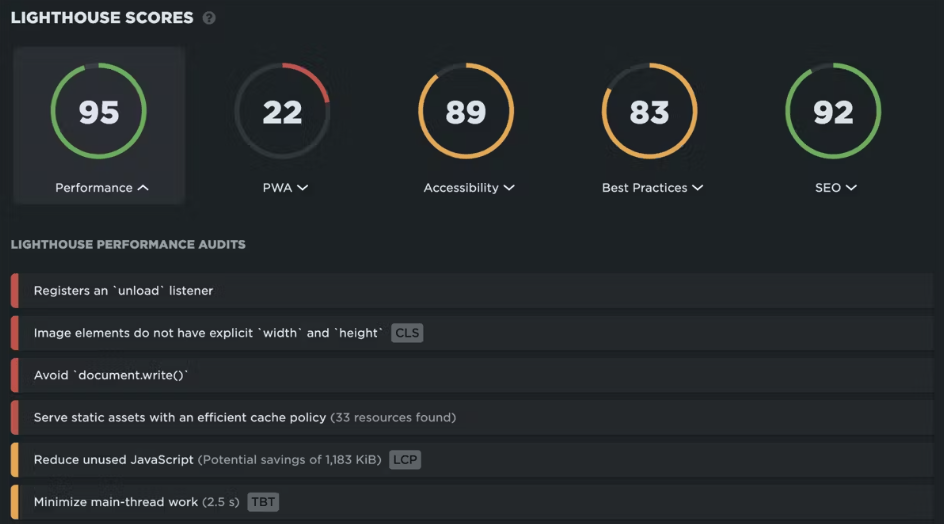
Pricing: from $12/mo
With SpeedCurve you get excellent design as well as impressive technical depth. However, it does not include Google CrUX data in its reporting.
4. Sentry
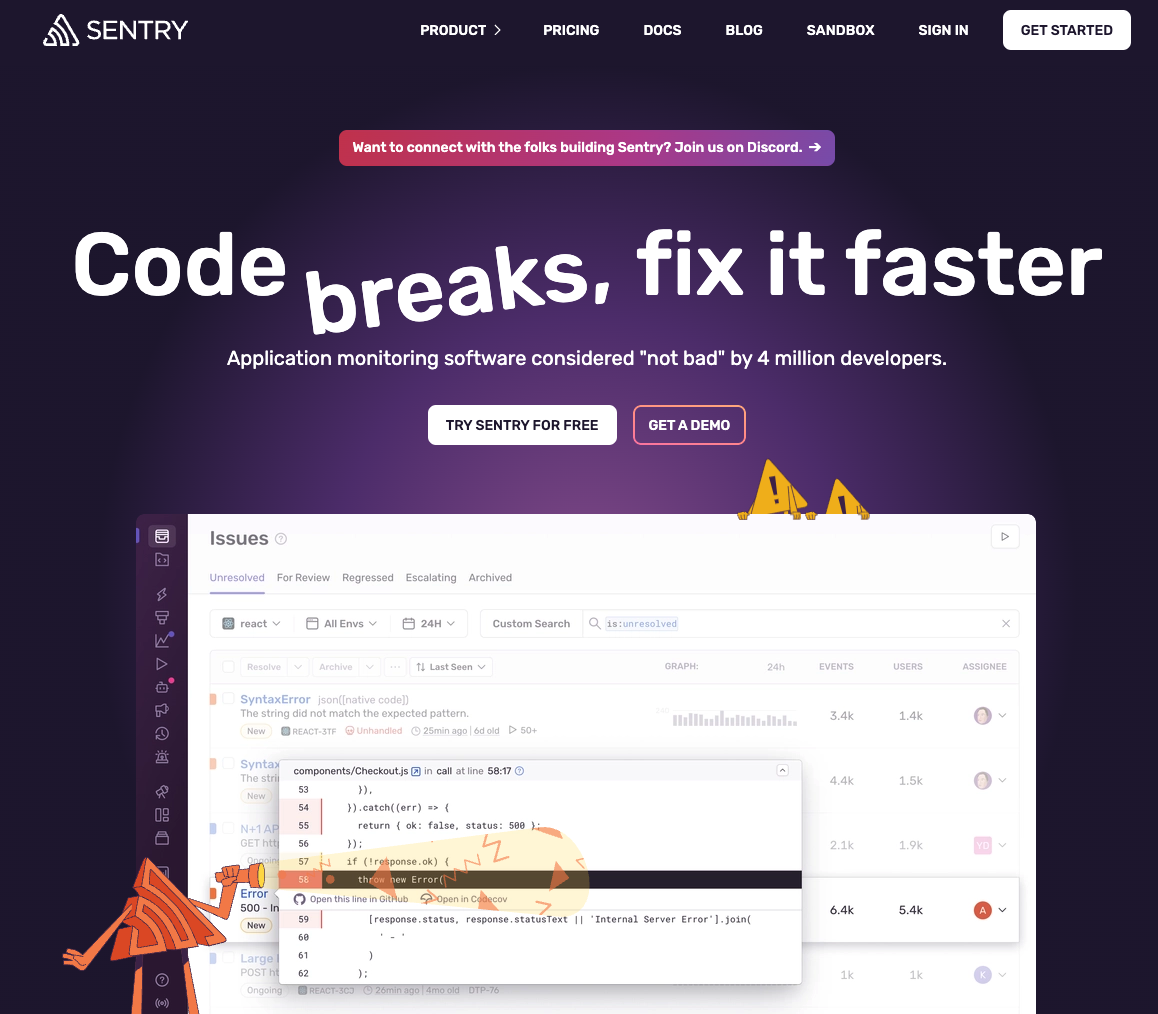
Unlike the tools we've mentioned so far, Sentry is a broader application monitoring service aimed at developers.
The product includes a wide range of monitoring features, including:
- Backend performance monitoring
- Real user monitoring
- Error monitoring
Pricing: from $26/mo
Sentry is built for coders, so it provides a large number of integrations and implementation guides for many different programming languages. You can use Sentry both on your website and for mobile applications.
5. RUMvision
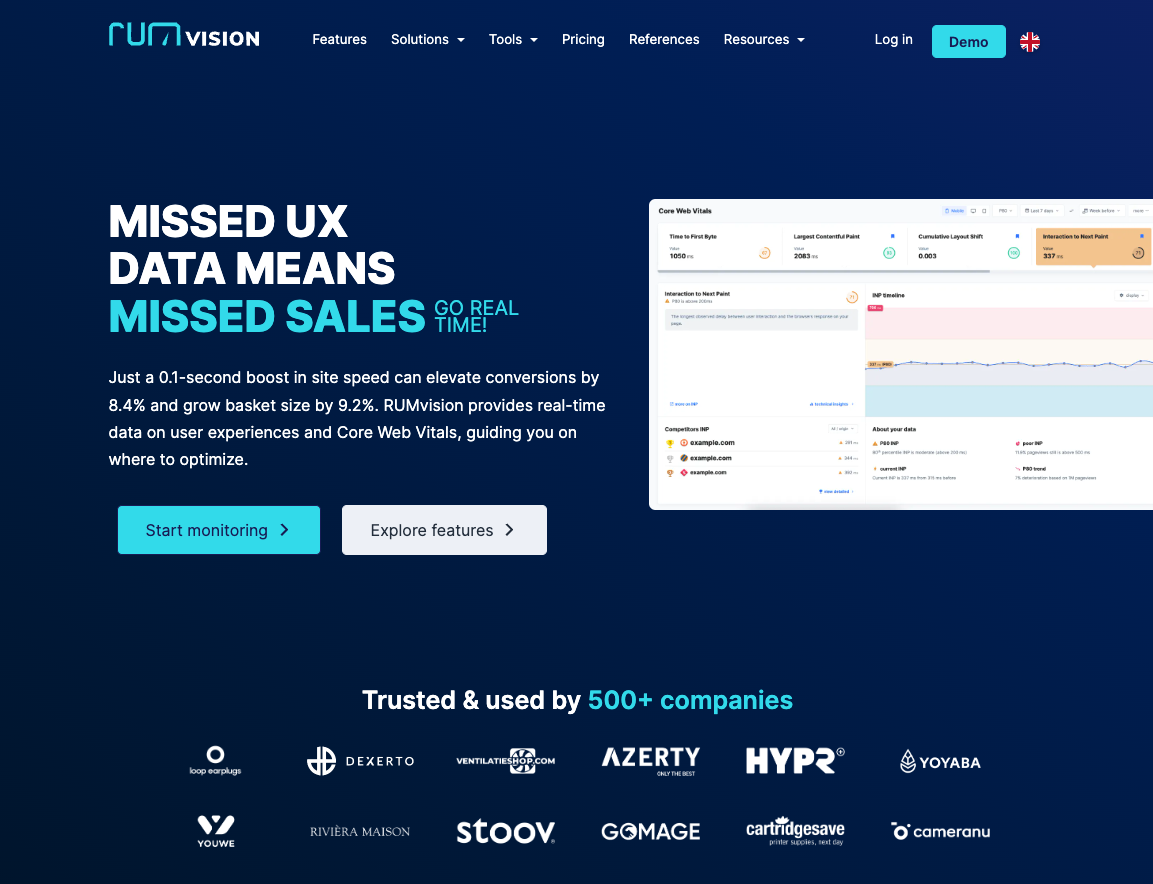
As the name suggests, RUMvision is a tool focused entirely around real user monitoring (RUM). Synthetic tests are not included.
RUMvision focuses on:
- User experience optimization
- Core Web Vitals monitoring
- Google CrUX data
Pricing: from $107/mo
RUMvision has great support for Google web vitals and can provide insight on each visitor interaction using the Long Animation Frames API that's launched in Chrome.
6. DataDog
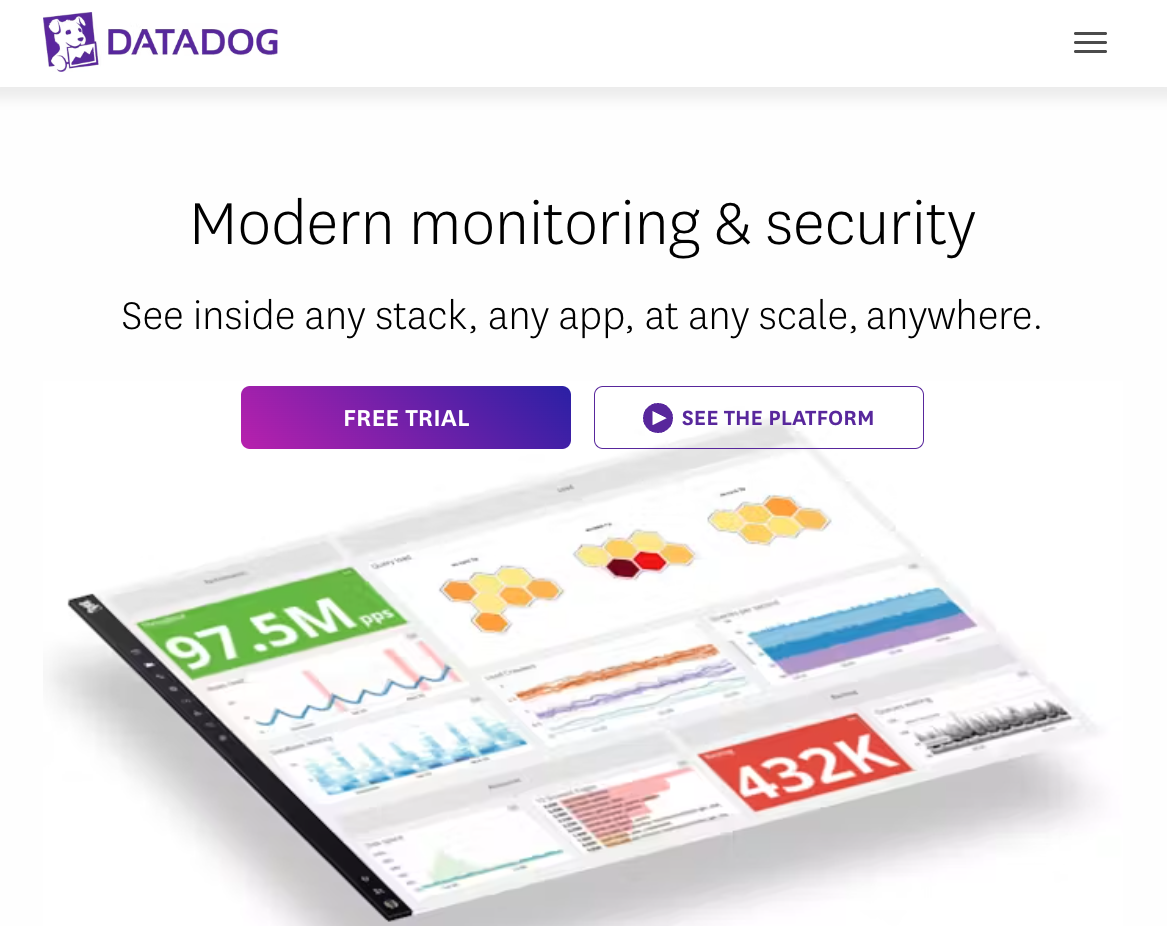
DataDog is a broad monitoring and security platform. It mostly targets developers and infrastructure teams.
Website monitoring with Datadog includes:
- Synthetic monitoring
- Real user monitoring
- Transaction monitoring
Price: various depending on functionality, from $12/mo for browser testing
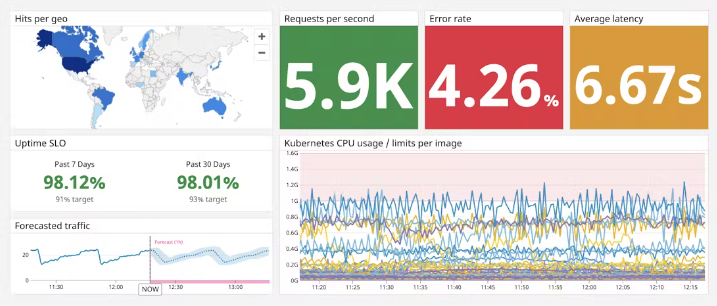
Here are some of the key features that DataDog provides to get complete visibility on your web pages:
- Backend and frontend data
- Website uptime monitoring
- Script and measure critical transactions
- Log data for performance debugging
- SSL monitoring to check validity and expiration
Keeping track of uptime is a good practice for better incident management, as you will get notified of downtime, can quickly fix issues, and keep customers informed as the incident progresses.
7. New Relic
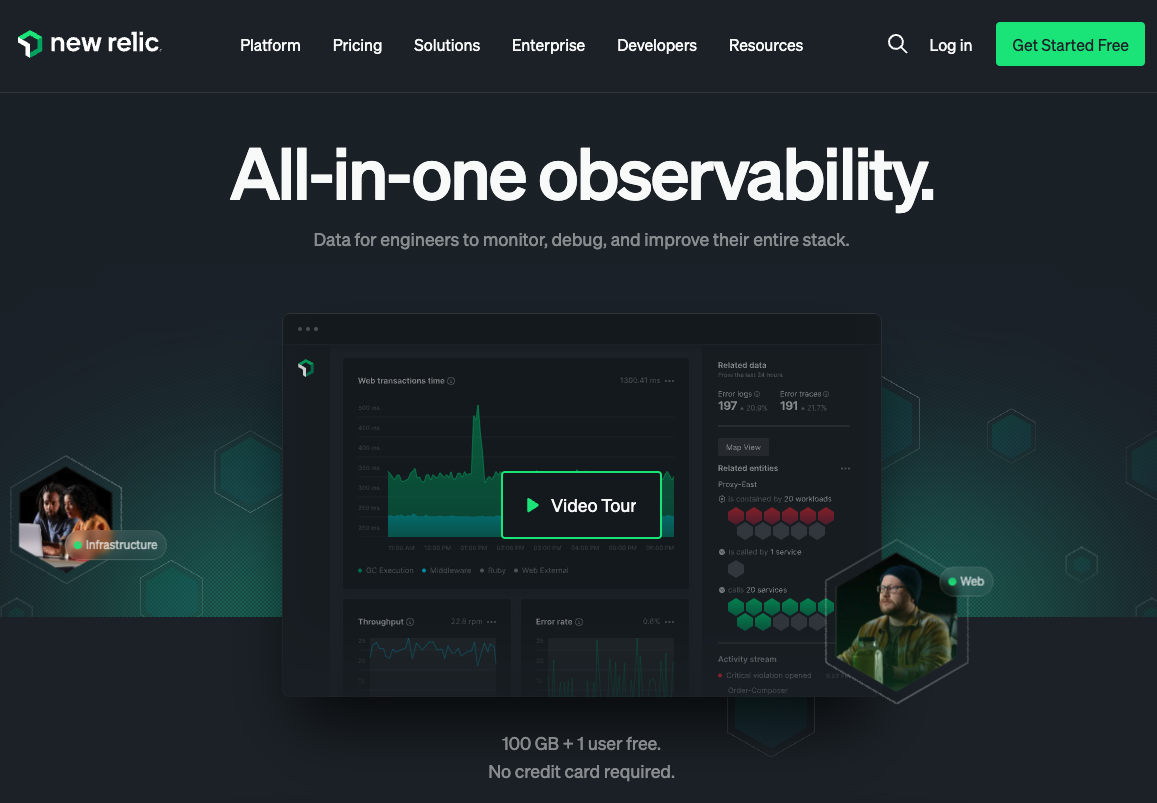
New Relic bills itself as an all-in-one observability platform, aimed at engineering teams.
The product provides a wide range of website monitoring features, including:
- Synthetic and real user monitoring
- Session replay
- Server-side performance monitoring
- Availability monitoring
While a broad set of features is supported, New Relic does not specifically target Core Web Vitals optimization.
Pricing: free, cost depends on amount of data ingested
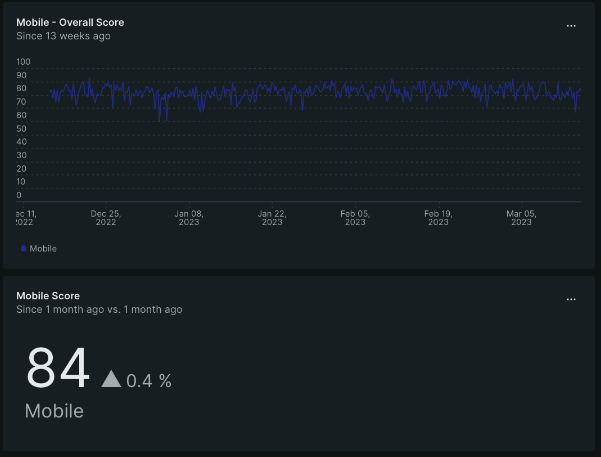
Overall, New Relic is a comprehensive application performance monitoring tool that tells you how your site performs in the lab, provides data on individual user sessions, and can track your website's uptime.
Combining all this data on the kind of experience your website visitors have provides enhanced troubleshooting options for your own web applications and for third party services.
8. Pingdom
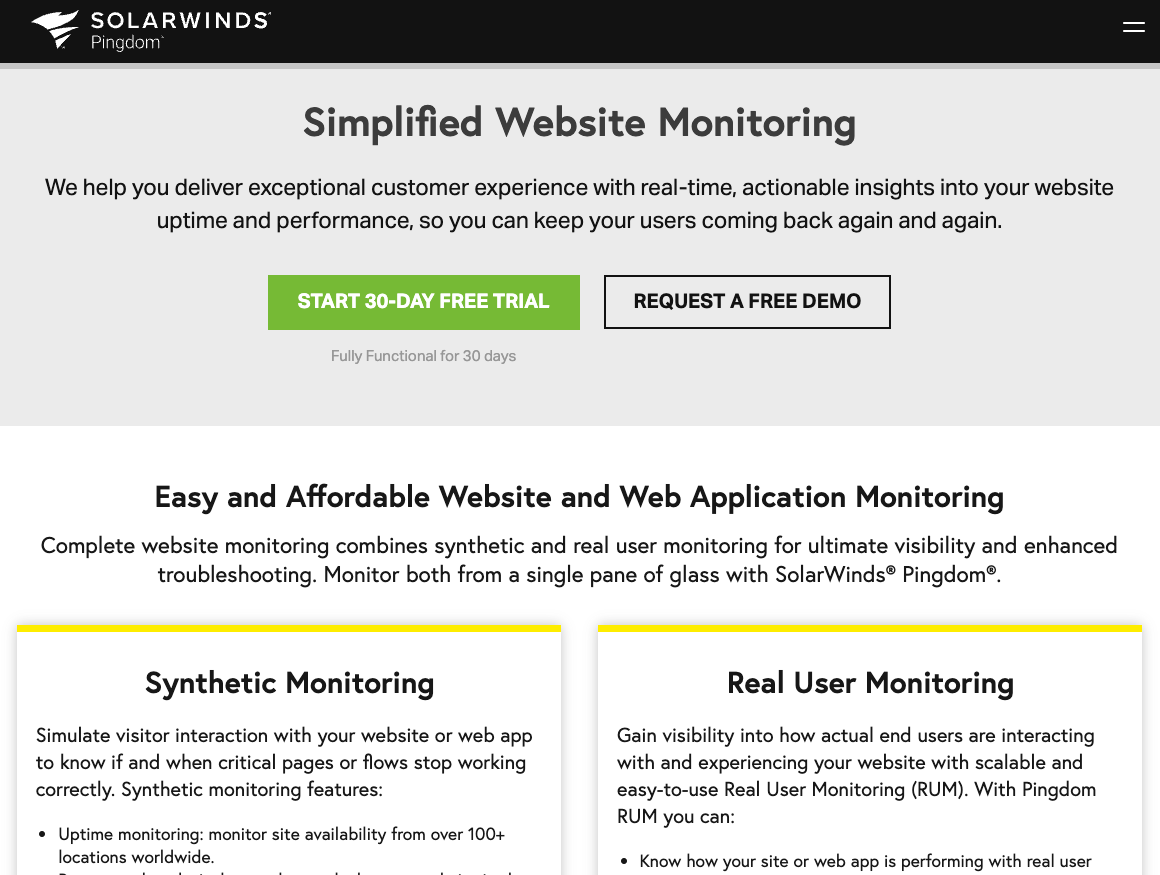
Pingdom is a website monitoring platform that supports both uptime monitoring and page speed monitoring. It offers:
- Synthetic tests and transaction monitoring
- RUM data
- Incident management
Pricing: from $10/mo
Unlike many other monitoring tools, Pingdom also lets you create public status pages. That way you can continuously keep your customers up to date and show how you've performed historically.
9. Google Search Console
Search Console is a free website monitoring tool by Google that provides reporting on real user experience as well as SEO metrics.
- Core Web Vitals data by page group
- Integrated with PageSpeed Insights
- Analysis of SEO issues
You get a Core Web Vitals report that shows you how many pages on your website pass the Core Web Vitals assessment, and which pages are performing poorly. Since the tool is offered by Google, it offers some unique insights on how to improve page speed for better SEO.
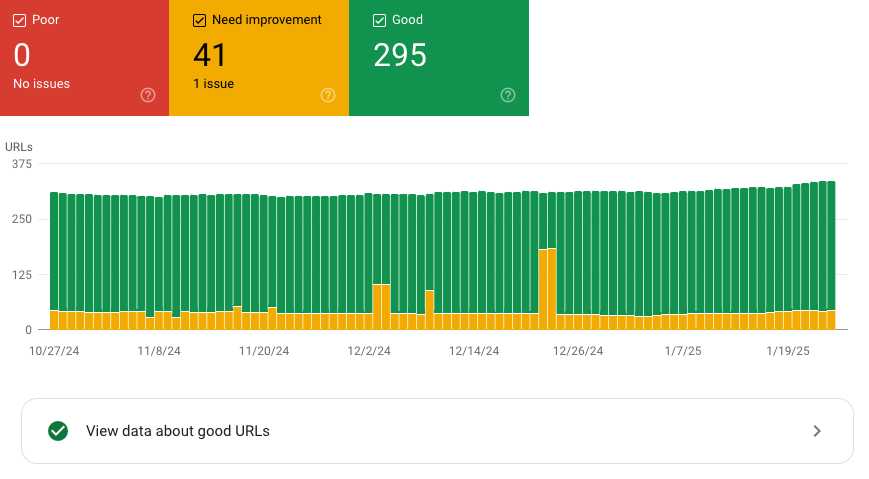
Unfortunately, Search Console does not provide much control about how data is collected and reported. You can't set up scheduled synthetic tests or track page speed for a URL over time. It also doesn't provide in-depth reports to help you fix performance bottlenecks.
Pricing: free
10. Raygun

Raygun is a monitoring platform for web and mobile applications. It doesn't offer synthetic testing, but provides a wide range of performance user data, including:
- Real user performance monitoring
- Error monitoring
- Server-side tracing
Pricing: from $80/mo
Raygun provides a suite of monitoring tools that help you deliver a online product. However, it does not include synthetic monitoring or availability monitoring.
Types of web performance monitoring solutions
There are two key types of data that most website performance tools provide:
- Synthetic website monitoring
- Real user monitoring
Synthetic tools run scheduled performance tests in a controlled test environment. For each run detailed data can be recorded. These lab-based tests can be run even on small websites or staging websites that don't get a lot of traffic.
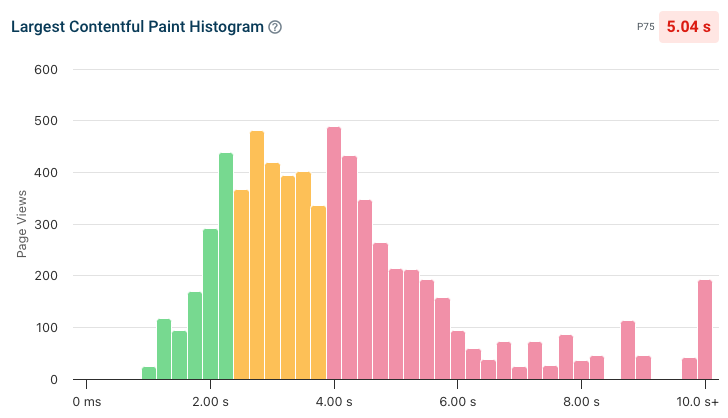
Real user monitoring tools collect data from your actual visitors. After making a change on your website you'll have to wait until enough page views have happened to be able to see the performance impact. Real user data is less detailed, but matters a lot because it represents the real user experience.
Synthetic reporting tends to focus on trends and specific test results, while RUM data is often reported showing distributions of experiences in a histogram or aggregate statistics using percentiles. Though you can always inspect specific visits as well.
How to pick a website performance monitoring service
There are a few factors to consider when picking a website monitoring tool:
- What types of monitoring are supported?
- Does the tool support all the metrics you need?
- How in-depth is the reporting?
- What options are available for alerting?
- What dashboard support is included?
- Can you monitor web performance from multiple locations?
- Is the performance data reliable?
- Are custom metrics supported?
What types of monitoring are supported?
If you're trying to improve your Core Web Vitals, does the tool support lab data, CrUX metrics, and real user data? Combining these different types of monitoring will give you the best chance of fixing your performance for the long term.
Monitoring solutions that provide data on individual user sessions offer you a lot of details on how actual users have experienced your web application.
Synthetic monitoring provides the most detailed reports on page load time. Check out this article if you're looking for a synthetic monitoring tool specifically.
Does the tool support all the metrics you need?
Google's Interaction to Next Paint metric is relatively new, so many real user monitoring products don't support it yet. Before buying a tool you need to make sure it's up to date with the web vitals metrics.
Generally, more metrics means it will be easier for you to identify what you need to do to improve your website's performance. For example, it's a lot easier to improve the Largest Contentful Paint score if the sub-parts breakdown is available.
Are custom metrics supported?
While general-purpose page load time metrics provide a great baseline, sometimes it's best to focus on a metric that's specific to your website. That way you can make sure you're measuring what matters for customer experience.
Many website monitoring services can track custom metrics, for example those recorded by the user timing API.
How in-depth is the reporting?
Going beyond metrics, you need in-depth debug data to understand user experience and apply the technical optimizations that have the biggest impact on your website.
For example you should consider:
- Does the tool contain an in-depth request waterfall view?
- Can you compare test results to each other?
- Does RUM data show you what elements caused slow interactions, and what scripts are responsible?
- Is a Lighthouse report available?
- Are there custom recommendations?

What options are available for alerting?
When something goes wrong on your website you need to find out quickly. That means setting up your monitoring tool to send alerts when a regression occurs.
For alerting you need to check:
- What alerting channels are supported, like email or Slack
- How configurable are the alerts?
What dashboard support is included?
Dashboards are an important tool to stay on top of performance:
- Automatic dashboards don't require custom configuration
- Custom dashboards need to be set up, but give you full control over your reporting
Many monitoring services include automatic dashboards that let you see all your monitoring data at a glance. Potential site speed issues and solutions can also be highlighted.
In contrast, custom dashboards can be configured to show just the data you need. This takes time, but the result will be fully customized to the needs of your organization.
Can you monitor web performance from multiple locations?
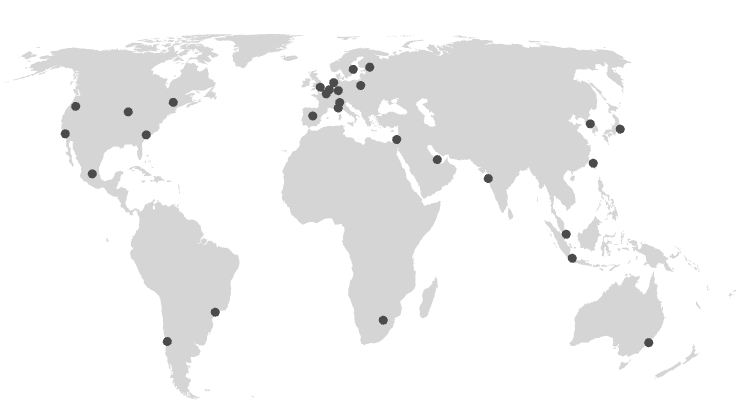
End user experience depends on where the user is located and where your website servers are. Check if the website monitoring tool you're using provides a global presence.
For example, DebugBear offers over 30 worldwide locations.
Is the performance data reliable?
When running lab-based tests there are different ways to collect the data, some are more or less reliable.
You should check whether page speed data is simulated or if it's actually collected on a slow network.
Best practices for website performance monitoring
There are a few best practices you can follow to get the most out of your website monitoring software:
- Focus on slow web pages with a lot of traffic
- Set up comprehensive monitoring across load time, user interactions, and visual stability
- Look at segmented real user data to identify visitor segments where your website performs poorly
- Consider multiple percentile values so you don't miss some users
- Make sure alerting is set up so you have comprehensive visibility on any issues that come up
Active monitoring of your website's availability and load speed helps you get the most out of your website for your business.
Benchmarking website performance
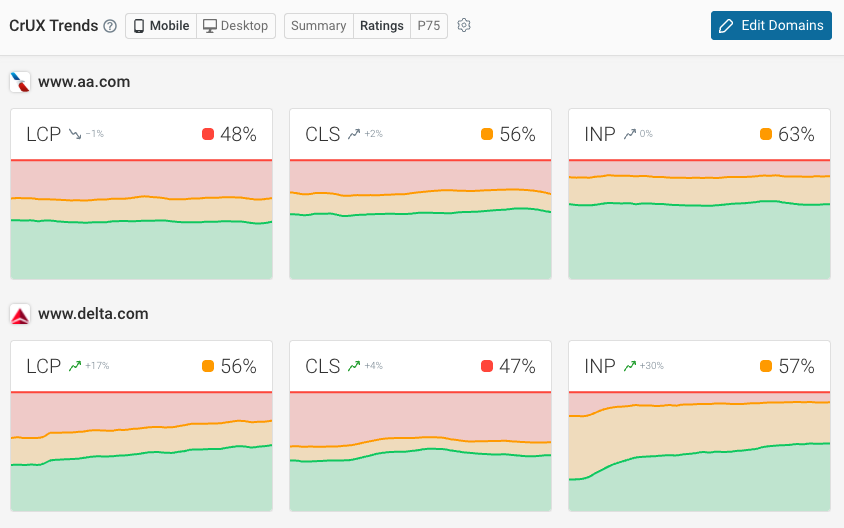
While some web performance tools focus on just your own website, many also allow you to track the page speed of your competitors.
For example, DebugBear offers the CrUX Trends dashboard where you can see how well your domain does relative to your competitors.
How to provide a great customer experience
From a performance standpoint, your website needs to do the following to provide a good user experience:
- Load fast
- Respond quickly to user interactions
- Be visually stable
- Have high uptime
What factors impact website performance?
The end user experience of your website depends on a lot of factors, for example:
- Back-end code causing poor server response time
- Issues with your hosting provider or CDN
- Front-end performance issues like render-blocking scripts
- Specific visitor interactions that are slow
- The internet service of your visitor
While not all of these are directly under your control, website performance monitoring tools can give you insight into both page load times and whether visitors are likely to use a slow network or device CPU to access your website.
Often monitoring services provide advanced features to configure bandwidth, latency, and CPU speed when running a synthetic website speed test.
Fixing your page load times might involve changing web hosting providers, implementing a Content Delivery Network, implementing custom performance fixes, or getting rid of third-party services that are slowing you down.
How are website monitoring tools priced?
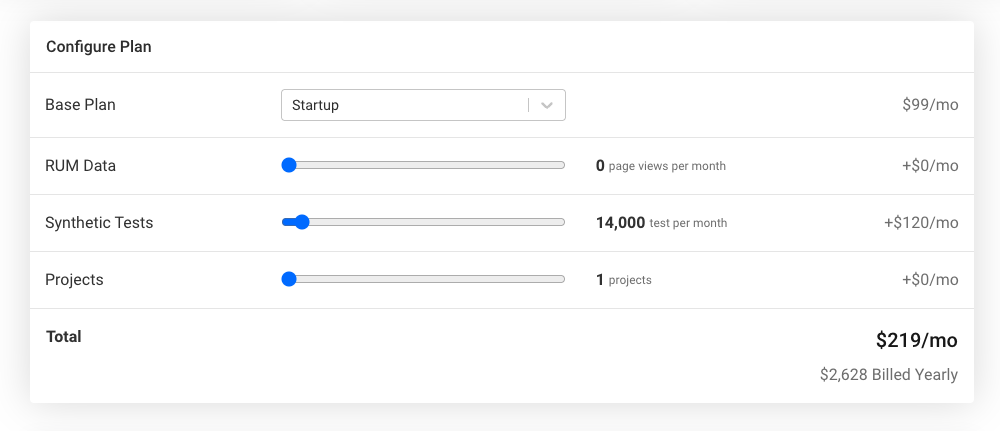
For synthetic monitoring, pricing typically depends on test frequency and the number of page monitors you need to set up. For example, you might want to run tests every hour or only once a week. Using multiple monitors means you can test how your site performs on different device types and across different locations.
RUM is typically priced per page view or user session that's being tracked. If you get a lot of traffic, sampling can help you reduce your monitoring spend. For example, if you get 100 million visits a month but only track 5% of your traffic, then you'll only pay for 5 million views monthly.
Some web performance monitoring tools let you subscribe to a fixed-cost monthly subscription plan. Others offer usage-based pricing based on your monthly quota consumption. That way you only pay for what you need, but you also risk running into overages and your spend will vary month to month, potentially making it difficult to budget.
On DebugBear's pricing page you can select a base plan as well as use the price calculator to build a custom plan based on your needs.
Is it easy to set up website performance monitoring?
Getting started with page speed monitoring is easy, but it can take time to set up fully.
Synthetic testing is the easiest way to start, as all you need to do is enter your URL into a monitoring or testing tool. The tool just needs access to your public-facing website. However, if you have bot protections in place or want to monitor a staging site then this will usually take a bit more time. You can allowlist specific test server IP addresses, or perform a Basic Authentication login prior to running the test.
To start collecting real user metrics you need to install analytics code on your website. That way you can see how your website behaves for actual users. There can be security and privacy concerns associated with this, so it may take a bit of time for you to review this. If loading a script from a new monitoring provider is not an option, you can use a proxy so that personal data never reaches the monitoring tool and so you can control exactly what code runs on your website.
What pages should you monitor for synthetic monitoring?
If your website has thousands of pages it will be difficult to monitor all of them regularly. You'll need to pick a set of pages you want to monitor.
- Make a list of key pages and templates, for example a landing page, a product page, etc.
- Identify slow pages based on CrUX or RUM data
You can then paste that list into the monitoring tool to start tracking performance on these pages. The DebugBear website scan can also help you come up with a list of pages to monitor.
Website monitoring beyond performance
In this article we've focused on website performance monitoring tools, but there are a number of other aspects of your website that you can monitor with online services. For example:
- User experience and feature adoption
- Search Engine Optimization (SEO)
- Security
- Cloud cost
- Functional testing
For these website monitoring purposes, other tools like Ahrefs, Hotjar, or CloudForecast.io can be helpful. Usage metrics in particular can help you learn more about what content your visitors care most about, and identify use cases where your customers struggle. Fixing these problems will help you attract and retain customers.
Digital experience monitoring is a term that's sometimes used to talk about all aspects of website monitoring, from end user performance to network activity. It forms part of a broader IT monitoring strategy.
What's the best website performance monitoring solution?
If your focus is on optimizing user experience and Core Web Vitals, we think DebugBear is a great solution. We've built it for teams who want to improve their front-end website performance and rank higher in Google.
If you're looking for a comprehensive solution for your development team, a service like DataDog or Sentry might be a better fit. These monitoring services provide both server monitoring for your backend and browser monitoring for your front-end performance.
For a smaller business GTmetrix could be a good choice. It's budget-friendly and provides all the basic features to test and monitor your website. However, it is not a real user monitoring tool.
Our advice is for your team to try a few different page speed tools to find the best website monitoring tool for you.
Get started with website performance monitoring
There are lots of monitoring tools out there. Most of them offer a free trial, so you can see how well they work for your use case.
If you proactively monitor your site performance you can increase user satisfaction and attract more customers. With a good tool you can easily identify slow loading pages and address performance issues quickly.
Ready to get started? Sign up for DebugBear to get a detailed analysis of your website and see how fast it is for real users.


Monitor Page Speed & Core Web Vitals
DebugBear monitoring includes:
- In-depth Page Speed Reports
- Automated Recommendations
- Real User Analytics Data
