
In this article, we’ll explore how Resource Load Delay can impact a page’s Largest Contentful Paint (LCP) score. Improving Resource Load Delay allows the browser to identify the LCP image as early as possible, reducing unnecessary wait time for the visitor.
What is Resource Load Delay?
Resource Load Delay measures how quickly after receiving the HTML document the browser starts loading the LCP image. The LCP image file is the resource that's being delayed.
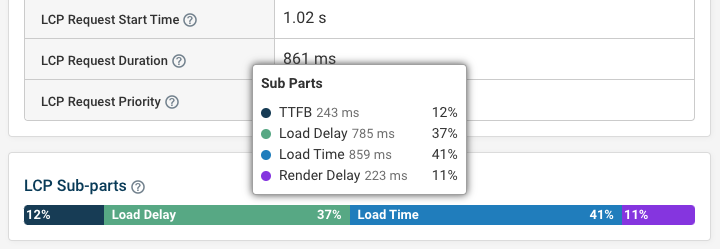
Load Delay is one of the four LCP sub-parts:
- Time to First Byte: time to start loading the HTML document
- Resource Load Delay: time to discover the LCP image
- Resource Load Duration: time to download the LCP image
- Render Delay: time to display the LCP image
Both Resource Load Delay and Resource Load Duration only apply to images and videos. For example, if the LCP element of a page is a H1, the LCP measurement will only have two sub-parts: TTFB and Render Delay.
How to interpret LCP image Load Delay
Understanding each LCP sub-part can help make focus your efforts on the page speed optimizations with the biggest impact.
Google recommends that Resource Load Delay should account for less than 10% of the total LCP sub-parts. The LCP image should be referenced directly in the document HTML, so that there's no significant delay before it starts loading.
In many cases, the LCP is triggered by an image element on the page. Resource Load Delay evaluates how quickly the browser identifies the image resource and begins downloading after receiving the server response.
How improve LCP resource load delay
Now that we understand what each of the sub-parts are, what causes Resource Load Delay? Here are a few common factors that delay resource loading:
- Request chains (e.g. for background images)
- Large HTML files
- JavaScript-inserted content
- Lazy loaded LCP images
Analyzing the request waterfall to see if the LCP request is made late on in the page load process can help identify the cause. Once that's done you can follow specific techniques based on why the load delay is happening. Let's look at some real-world examples and how to reduce load delay in them.
Request chains and background images
Below we have an LCP image discovery request waterfall for a background image. In this example we can see that the LCP element is initiated from the CSS stylesheet.
The background image only starts loading once the page starts rendering, which is when the browser realizes that the element with the background image is in the viewport.
In the waterfall we can see that the LCP image doesn't start downloading even after the stylesheet request is complete. Only once the page starts rendering, as indicated by the blue First Contentful Paint marker, does the image start to load.
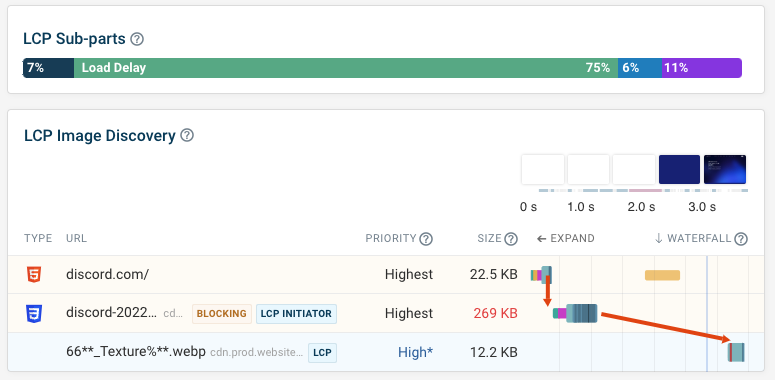
Once the request begins, the time spent downloading the image is minimal. Accordingly the Load Time component of the LCP breakdown makes up less than 10% of the overall LCP score.
To fix request chains causing Load Delay you can preload the LCP image. That way, the LCP image can download without waiting for the CSS file or for the page to start rendering.
Preloading the image will improve LCP overall, but might also shift some of the Load Delay time over to Render Delay. In that case you'll need to reduce the number of render blocking resources on your website to further optimize your Largest Contentful Paint score.
Large HTML files
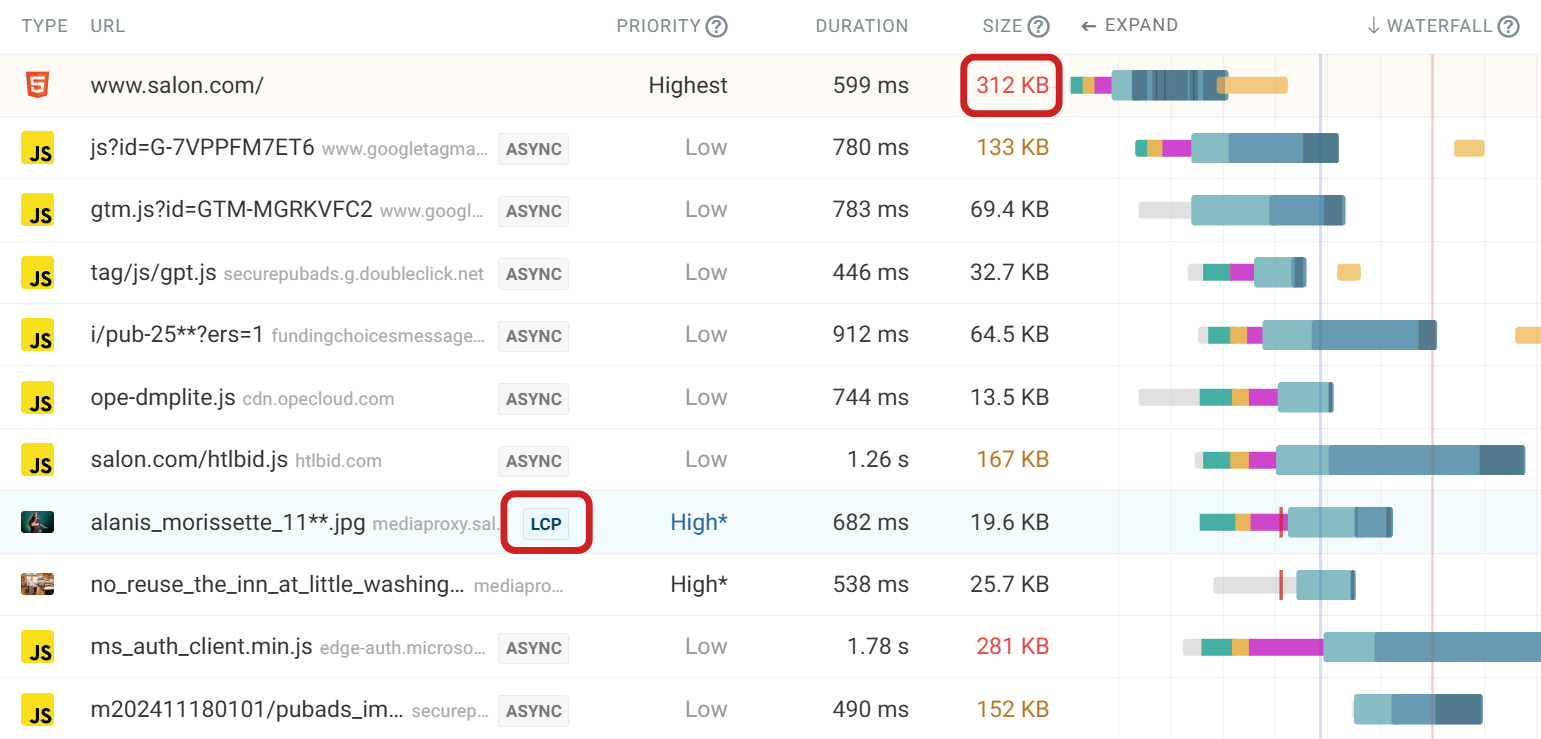
A larger HTML file can cause a load delay for the LCP image, if the image element is not included in the first downloaded chunk (roughly the first 10kb of data). To load further chunks, additional round trips are required between the client and the server.
In this example we can see a file size of over 300 kilobytes. As the img tag is not discovered for some time this causes load delay.
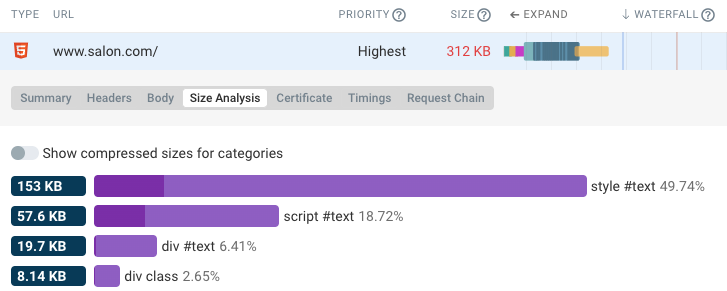
To fix large HTML, check that the resource is compressed with Gzip or Brotli and use the size analysis feature in DebugBear to see what is contributing to the overall HTML size. Often you'll find embedded images or fonts.
JavaScript-inserted content
JavaScript inserted content follows a similar pattern to the background image we looked at previously. A bunch of code needs to be loaded and executed before the browser discovers the LCP image.
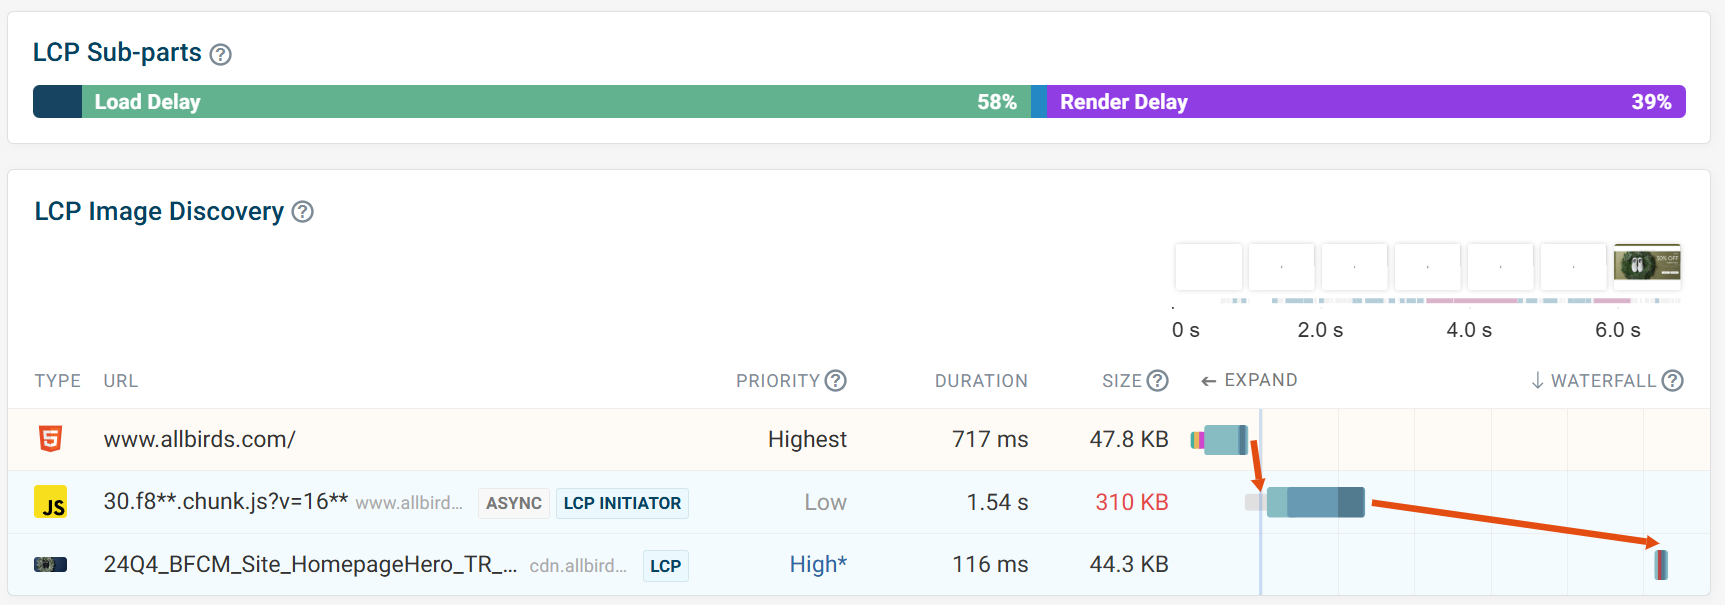
Aside from preloading the LCP initiator, another option could be to utilize server side rendering so that the LCP image is included in the initial response.
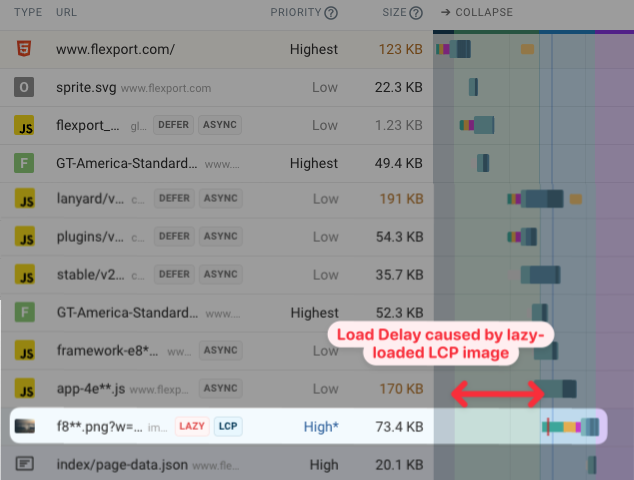
Lazy loaded LCP images
The purpose of using the lazy="loading" attribute is to tell the browser that certain resources don't need to be loaded right away. This attribute is typically used for elements that load below the fold, allowing more important resources to load sooner.
However, LCP elements should not be lazy loaded as it causes unwanted delays. Remove the loading attribute to fix this, and consider adding fetchpriority="high" instead to tell the browser that it should prioritize loading this image.
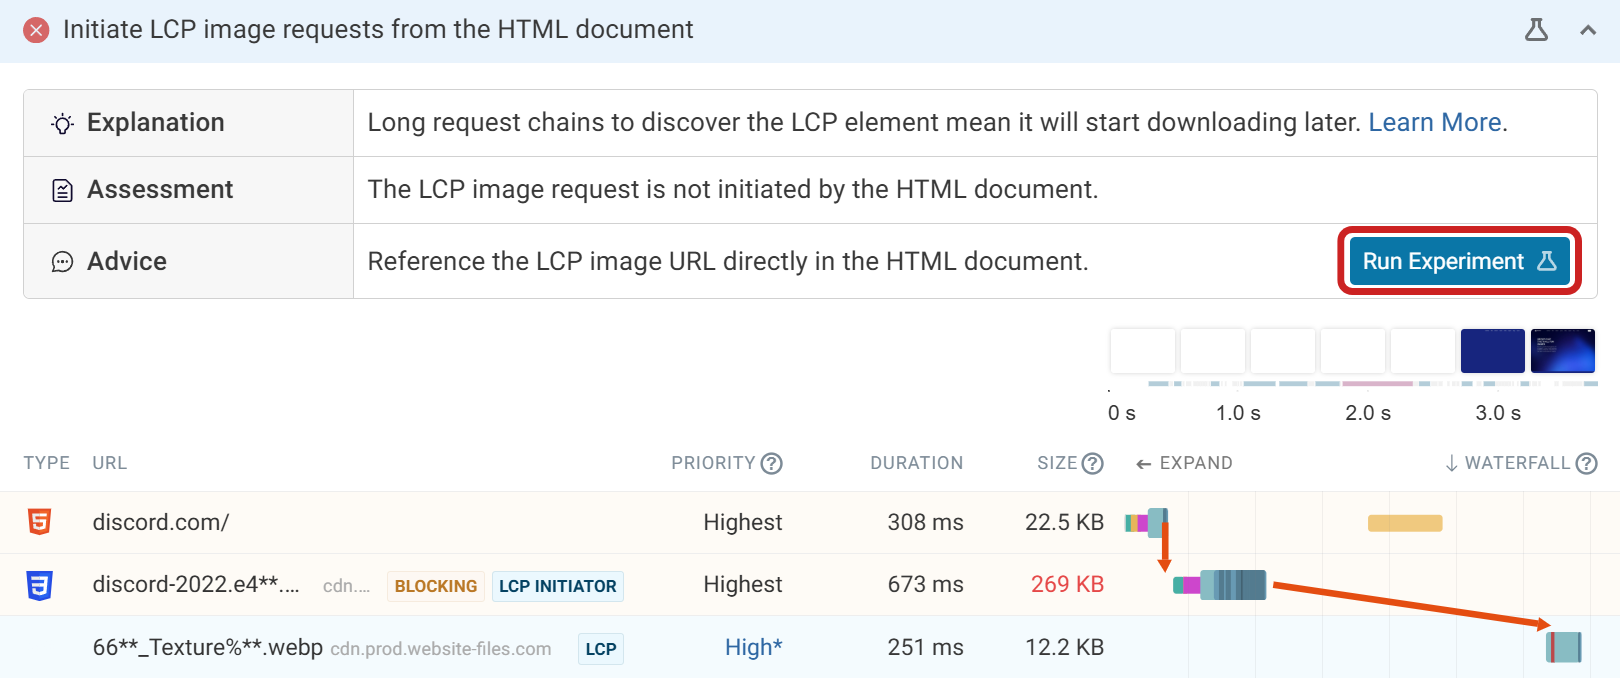
Initiate the LCP image requests from the HTML document
When running a lab test in DebugBear, automated recommendations are highlighted at the bottom of the page. This is a great way to spot potential optimizations.
One recommendation is to initiate LCP image requests from the HTML document. If the request is not included in the HTML, the issue will be flagged. DebugBear also shows an option to run an experiment to try out this optimization.
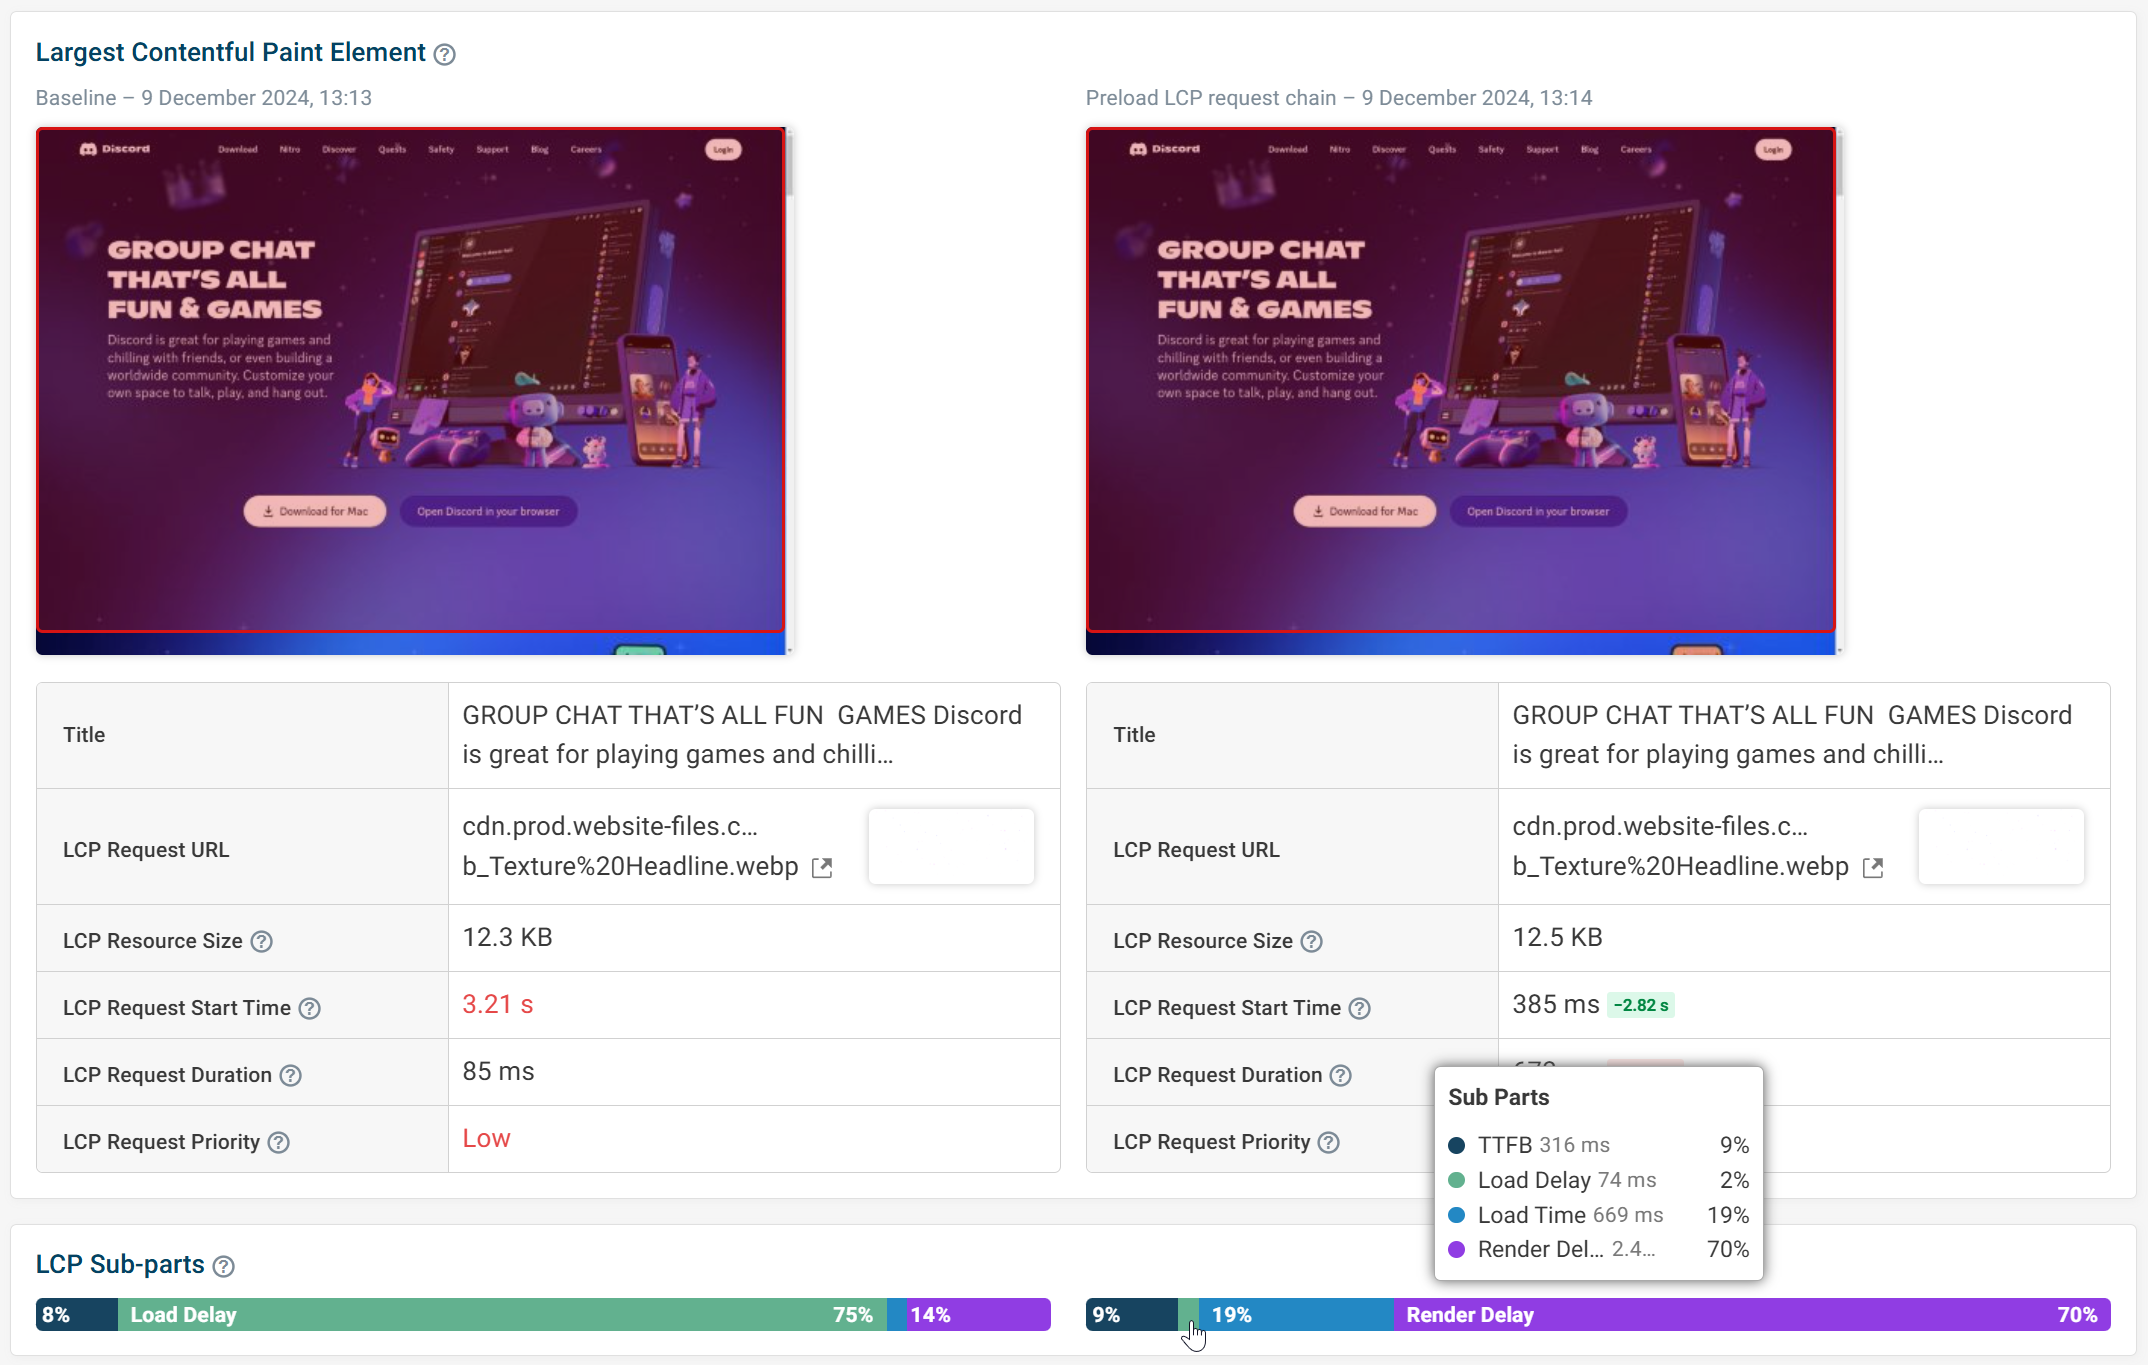
After running the experiment to preload the LCP request chain. The Resource Load Delay has reduced from 75% to just 2% as the browser discovers the LCP image sooner.
Measure Resource Load Delay for real users
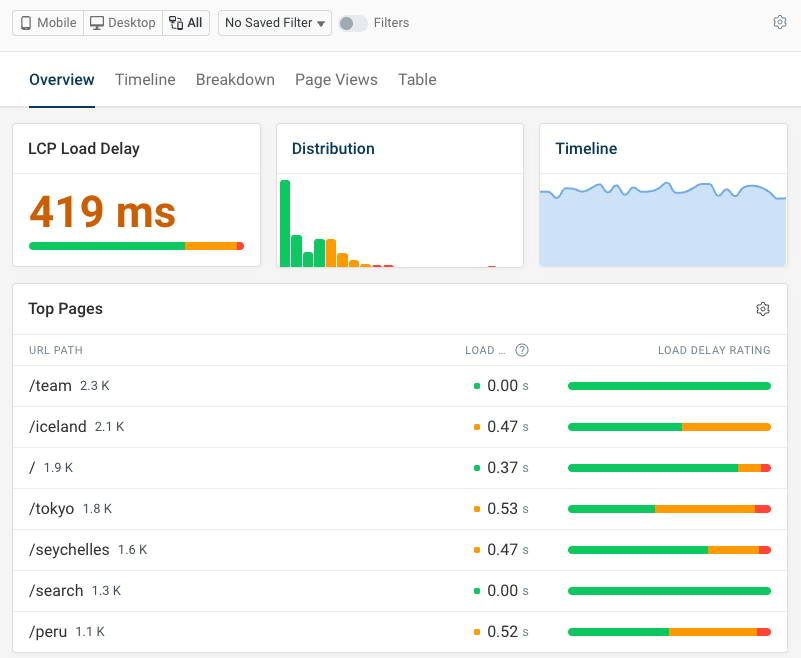
Using lab tests is a great option for identifying high Resource Load Delay and the cause. After making optimizations, you can see how real users are experiencing the LCP element by using a Real User Monitoring tool. Each LCP sub-part has a dedicated dashboard for deeper analysis.
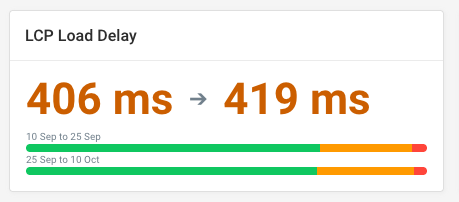
After optimizing a page, you can compare the percentile bars for the selected periods to see improvements in LCP Load Delay.
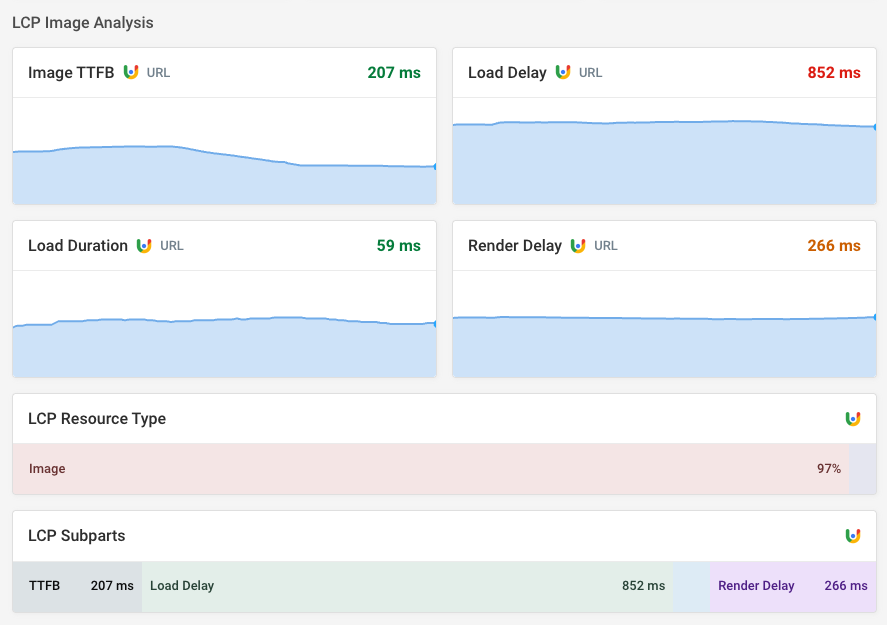
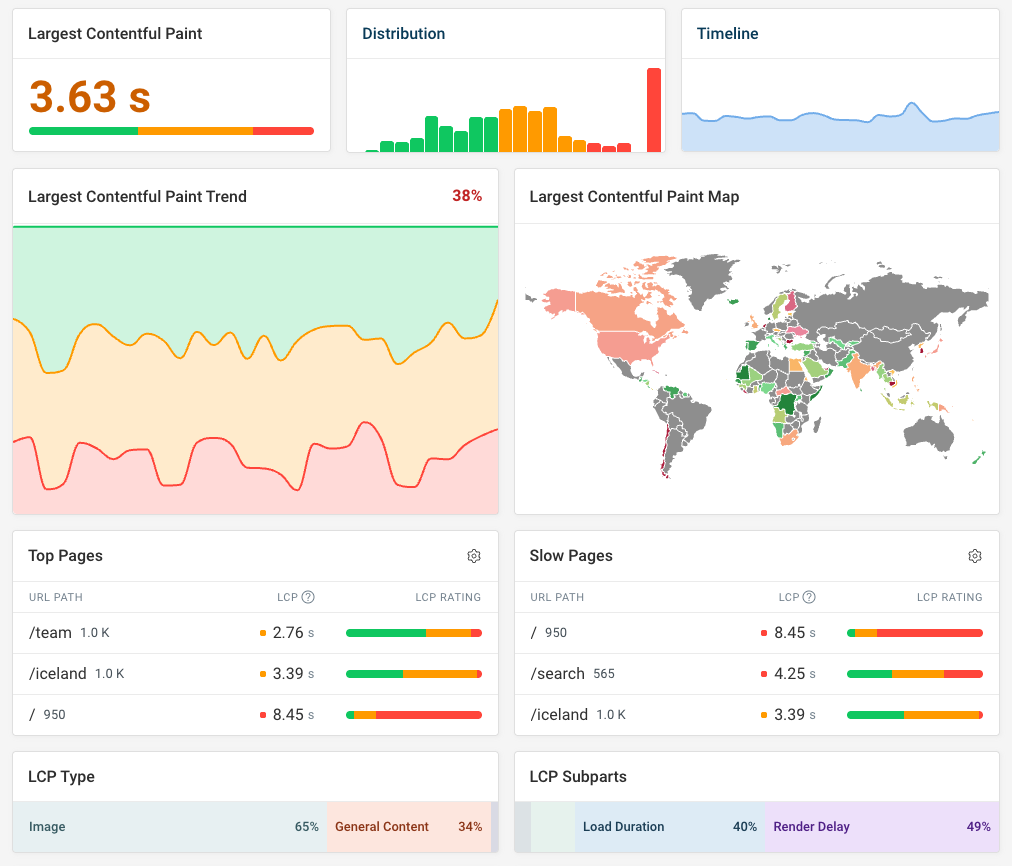
DebugBear provides a full dashboard not just for the Largest Contentful Paint metric but also for each subpart like Load Delay.
Resource load Delay in Google CrUX data
In February 2024 Google started reporting LCP subparts as part of the Chrome User Experience Report (CrUX).
You can find each subpart in the Web Vitals tab of your DebugBear test result. Since the Load Delay and Load Duration subparts only apply if the LCP image, Google only shows the subparts data for page views with an LCP image element.
To help interpret the data you can also see how often the LCP resource type is text or an image.
Measure Load Delay in Lighthouse
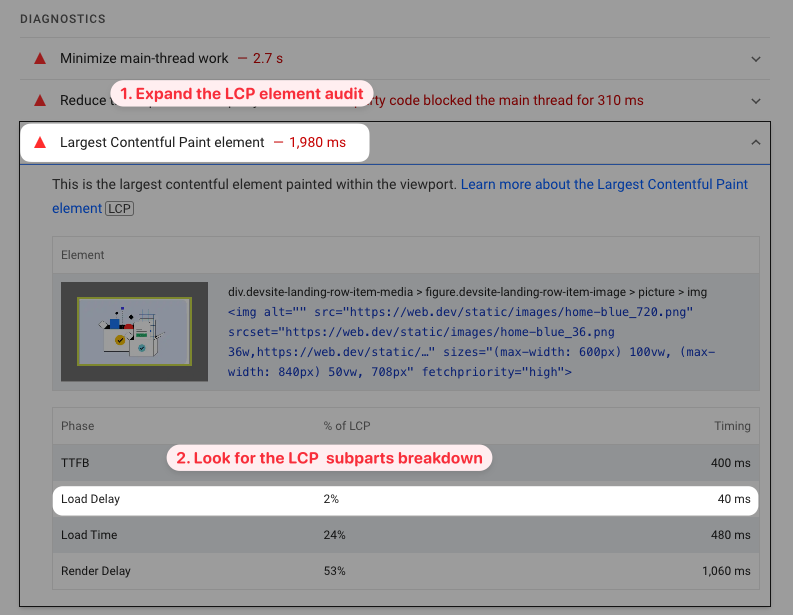
If you run a Lighthouse test with a tool like PageSpeed Insights or DevTools you find the LCP subpart breakdown in the Largest Contentful Paint element audit.
Conclusion
Resource Load Delay only affects images and videos. Common causes include:
- Not initiating the LCP request in the HTML document.
- Large HTML sizes delaying element discovery.
- JavaScript-inserted content.
- Incorrect use of the lazy loading attribute.
Any of these causes can have an impact on the LCP score for a page.
Monitor Load Delay and web vitals
Monitoring your site and analyzing request waterfalls can help identify these issues. Using a RUM tool provides further insight, allowing you to track optimizations and understand real-world user experiences.
DebugBear can track your web vitals including subparts in synthetic tests, CrUX data, and real user analytics. For example, the real user data dashboard for the Largest Contentful Paint metric shows a component breakdown of LCP across your website.


Monitor Page Speed & Core Web Vitals
DebugBear monitoring includes:
- In-depth Page Speed Reports
- Automated Recommendations
- Real User Analytics Data