How To Check Site Speed From Multiple Locations
Want to check your website speed from different locations around the world? In this article we'll look at three ways to measure site speed from different places across the world.
Run a global Time to First Byte test
One quick way to test your page speed from multiple locations at once is using a free Time to First Byte testing tool.
Time to First Byte (TTFB) is a website performance metric that measures how quickly your website server responds to the request for the HTML document of the page.
A global TTFB testing tool contacts your server from different locations and reports how long it took to receive a response. Simply enter the URL of any website to test it.
If you don't use a Content Delivery Network (CDN) you'll likely see that your website is fast when accessed from a location close to your server, but gets slower as you get further away. That's because the network round trip time (RTT) on the connection is getting higher.
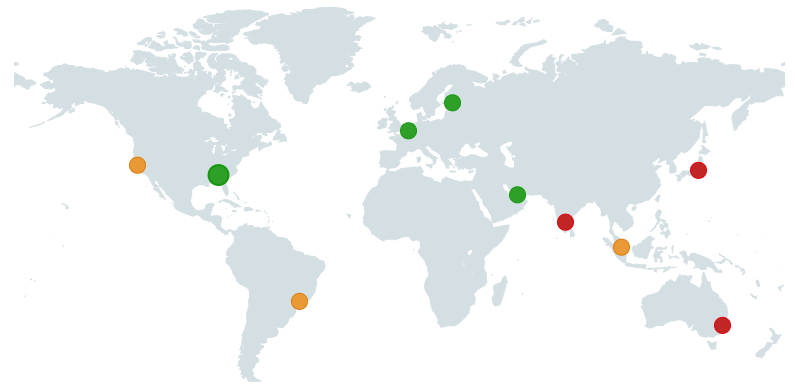
When testing your site speed from multiple locations you'll sometimes also be able to see what regional server each response was served from.
For example, here we can see that a request from Sydney is served from a server in Sydney, while a request from Dubai is served from a data center in Tel Aviv.
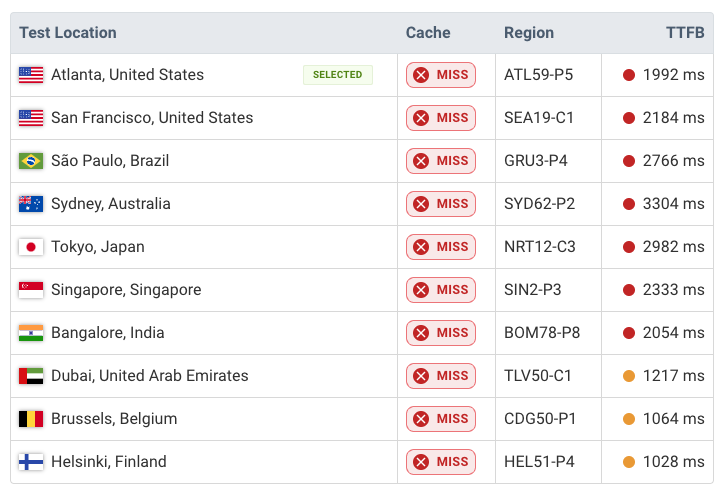
We can also see whether the response was served from a cache, either from a CDN cache or somewhere else in the application's server infrastructure.
Monitor your website speed from locations across the world
Measuring Time to First Byte is a great start to understanding your global website performance. Resources beyond the initial document HTML are often static and can be served from a cache close to the visitor.
However, you still want to look at other page load time metrics, like First Contentful Paint (FCP) and Largest Contentful Paint (LCP).
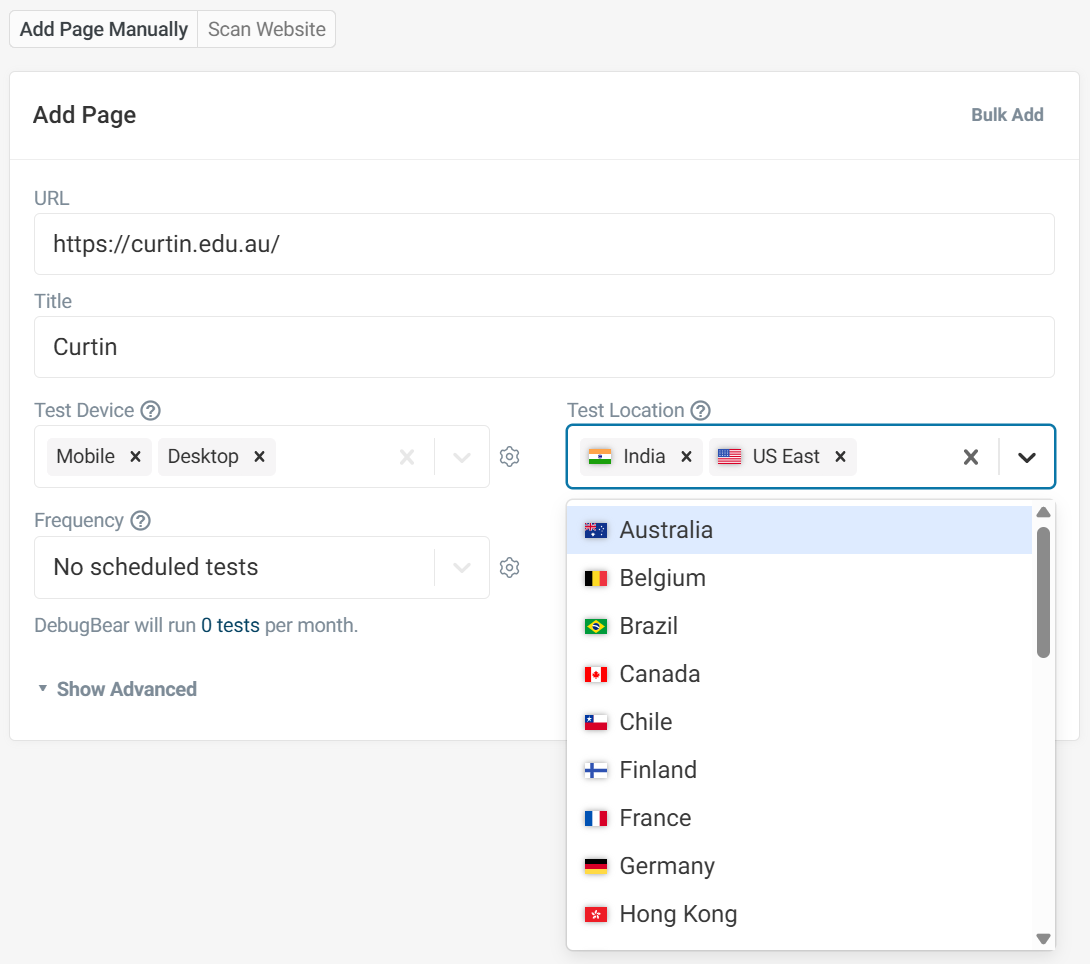
To do that, you can monitor your website with a synthetic monitoring tool like DebugBear. When adding your page you can select from over 30 global test locations.
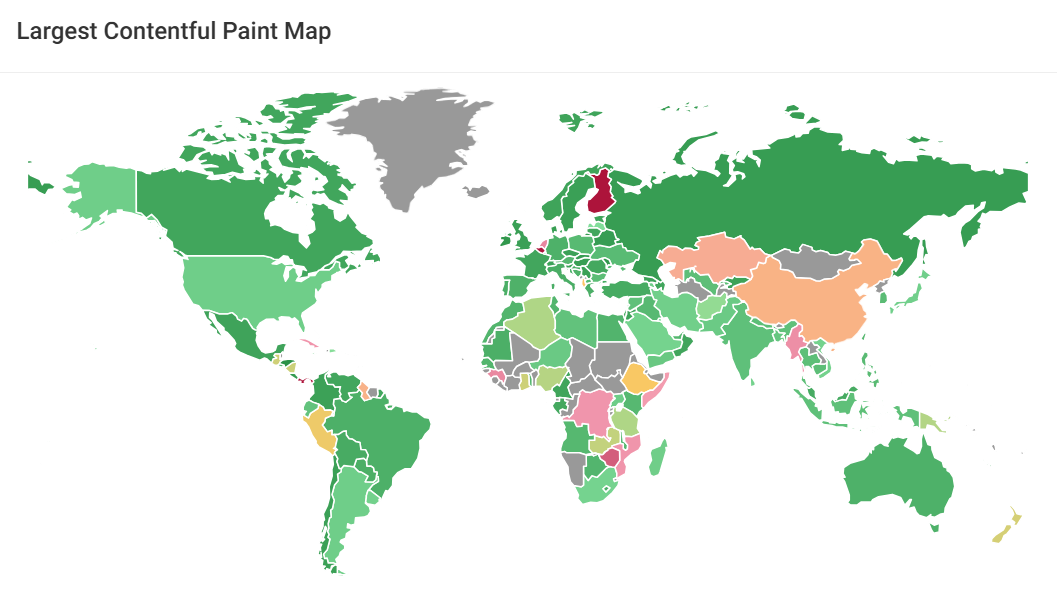
You can then see that page load time varies depending on the test location.
For example, this test website achieves an LCP score of 1.5 seconds in Australia, but takes 3.5 seconds to load when accessed from Brazil.
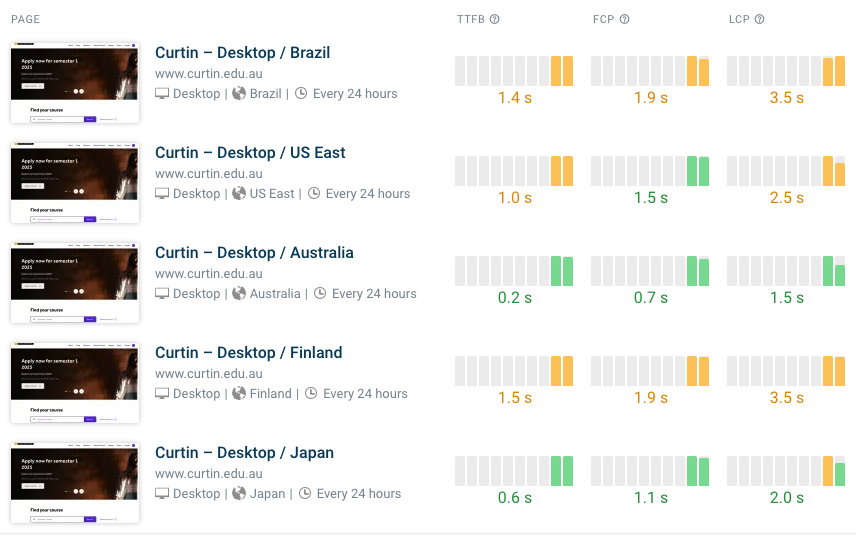
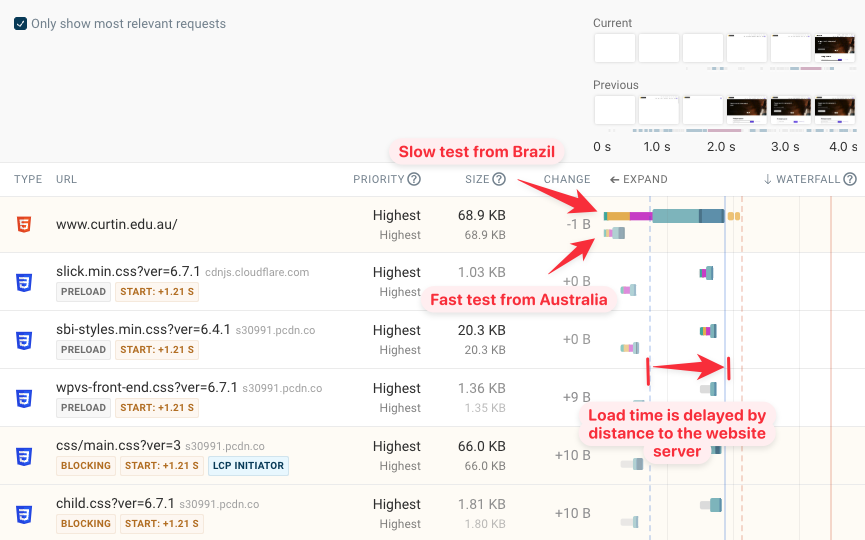
We can even compare test results between different locations to understand more about why website speed differs.
Here we can see that the HTML document especially is loading more slowly. Other resources don't show such a big difference, because they are loaded from cdnjs.cloudflare.com, use.typekit.net and pcdn.co, content delivery networks with server locations across the world.
View page speed data for actual visitors
While running synthetic tests from across the world is great to understand how experience differs, it doesn't tell you how fast your website is for visitors across the world.
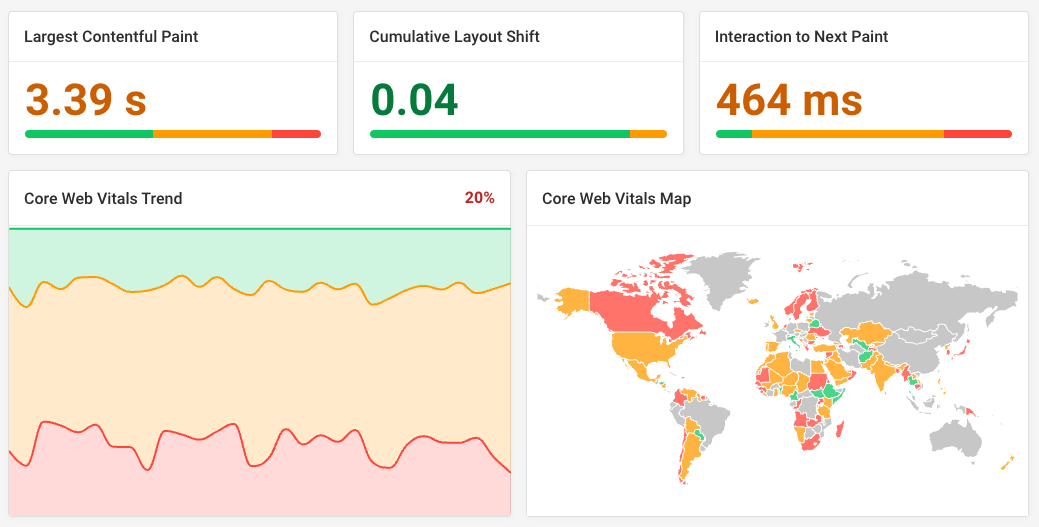
That's why collecting real user monitoring data for your website is helpful. You can see how many visitors you got from each country, and how long it took for your website to load for them.
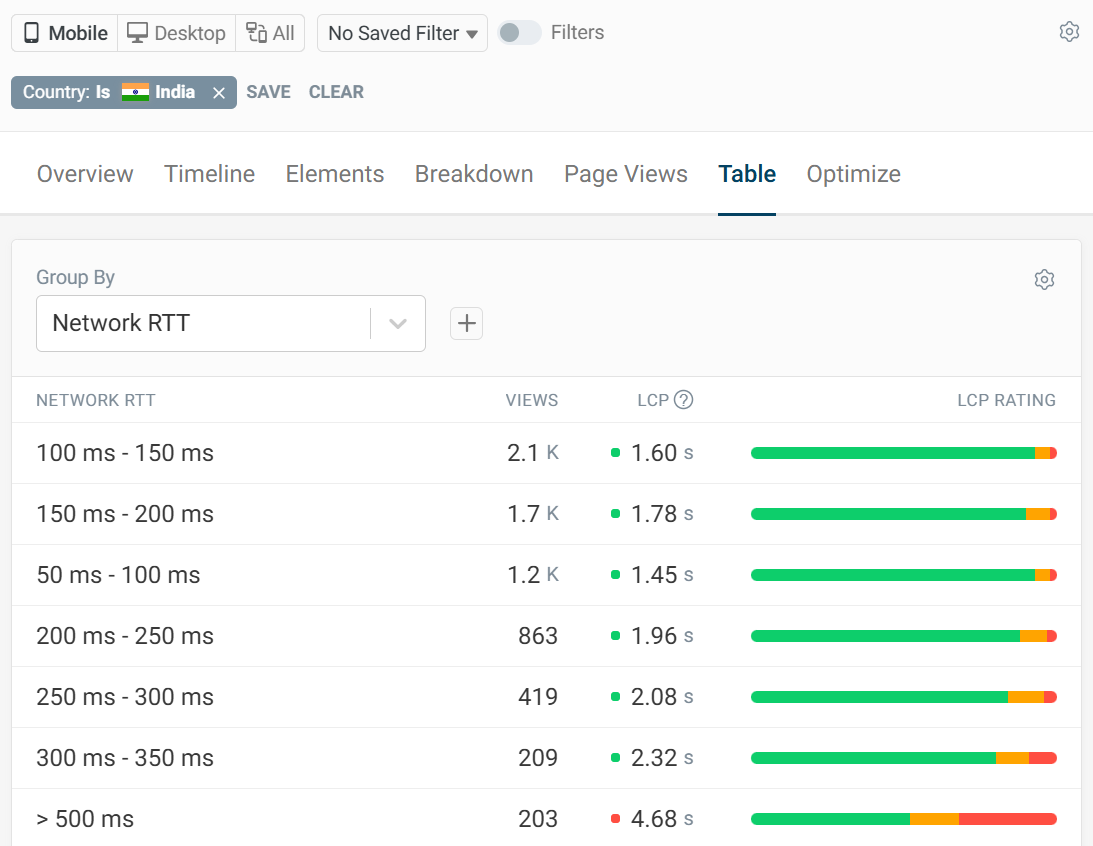
Differences across countries often aren't just caused by distance to your server. Depending on the country, visitors are likely to have more or less powerful devices, as well as faster or slower network speeds.
For example, if we just look at visits from India, we're more likely to see users with a slow network round trip time, sometimes 400 milliseconds or over. Visits from these networks will fundamentally be slower.
Why does global page speed matter?
Optimizing your website for different regions means you'll deliver a better, more consistent user experience to your visitors.
You'll also get SEO benefits from better page speed. Google uses the Largest Contentful Paint metric as one of the three Core Web Vitals with ranking impact.
SEO impact is based on Google's Chrome User Experience Report (CrUX). Here Google looks at global data. If you get a lot of visits from countries where your website is loading more slowly, this can drag down your metrics and cause you to fail Google's Core Web Vitals assessment.


Monitor Page Speed & Core Web Vitals
DebugBear monitoring includes:
- In-depth Page Speed Reports
- Automated Recommendations
- Real User Analytics Data