Clear connection and DNS caches in Chrome
Chrome's net internals tool provides network debugging functionality that goes beyond what's available in Chrome DevTools.
Learn how to use net internals to clear connection and DNS caches, as well as to view shared compression dictionaries.
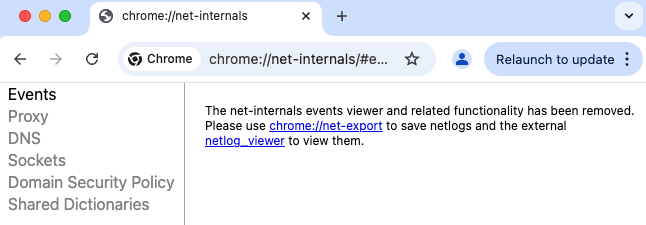
How to open Chrome's net internals page
Open a new tab, paste chrome://net-internals into the URL bar, and press enter. Chrome will then display the net internals tool, allowing you to debug network issues and clear specific caches.
Closing all server connections
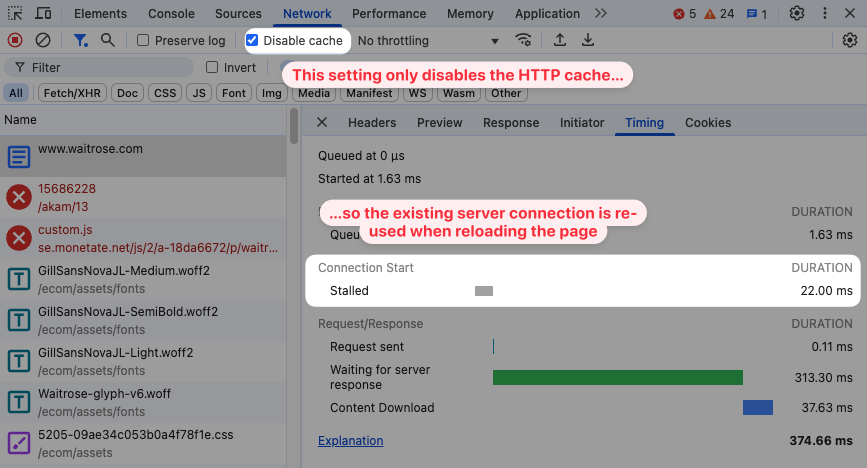
While the Disable cache option in the DevTools network tab disables the HTTP cache, it does not prevent existing server connections from being re-used.
So if you're reloading a page you'll often see that no time is spent on connecting to the server.
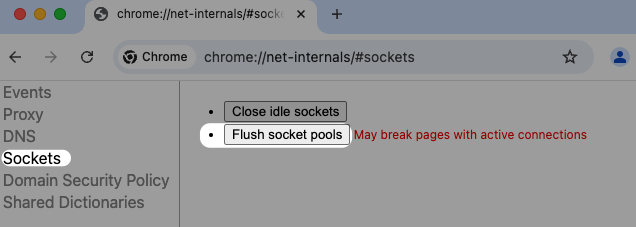
To actually test a fresh page load you need to terminate any open connections. To do that, open the chrome://net-internals page, select the Sockets tab, and then click on Flush socket pools.
You can also open the sockets tab by going directly to chrome://net-internals/#sockets.
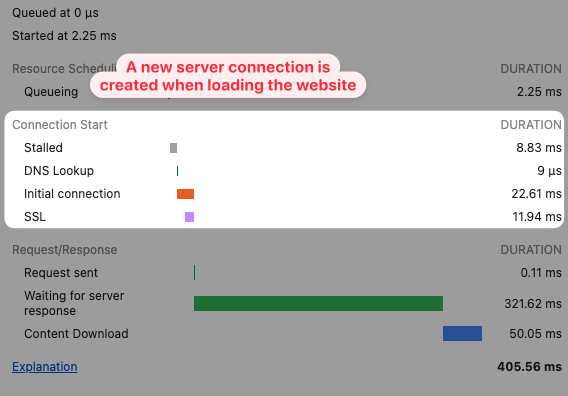
If you now visit the page again you can see that Chrome creates a new server connection, spending time on the TCP and TLS connection setup.
Troubleshooting
Sometimes you still won't see a new connection after closing existing connections on the net internals page.
One reason for that is that a new connection was already created. For example, this might be the case if you've kept the page open in a tab and the page made a new request. Close the tab before clearing open connections.
I'm also not sure if closing the connections is instant, so consider waiting a few seconds before loading the page again.
Clearing the DNS cache
In the previous example you can see that even after clearing the connection, the DNS lookup still only takes 9 microseconds as it's cached locally.
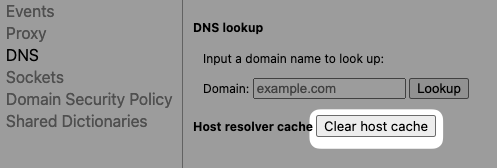
To fix that, we can open the DNS tab on the net internals page or go directly to chrome://net-internals/#dns.
Then click on Clear host cache. The host here is the operating system on the device that Chrome is running on.
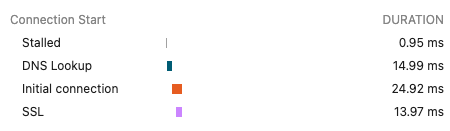
If we clear connections now and reload the page, Chrome tells us that just under 15 milliseconds was spent on the DNS lookup to get the server IP address.
DNS Lookup
The net internals tools also lets you run a DNS lookup directly and view what IP address the website is served from. Just enter a domain name and click Lookup.
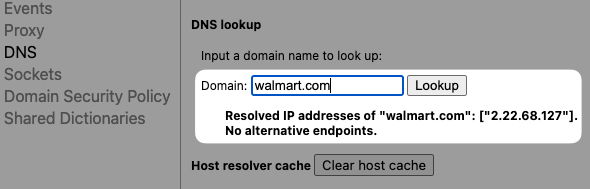
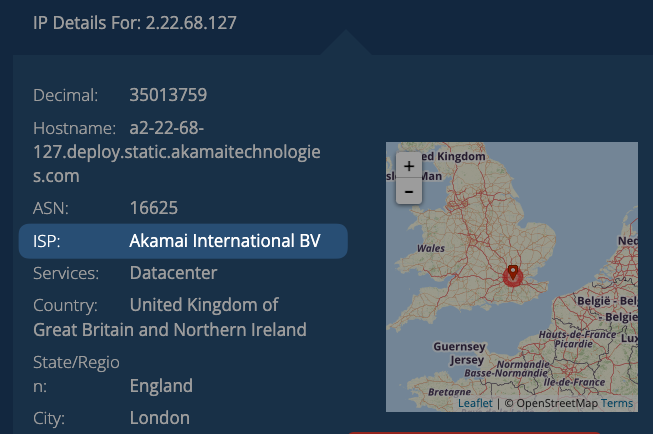
In the case of the Walmart website I get an IP address of an Akamai data center in the UK, according to whatismyipaddress.com.
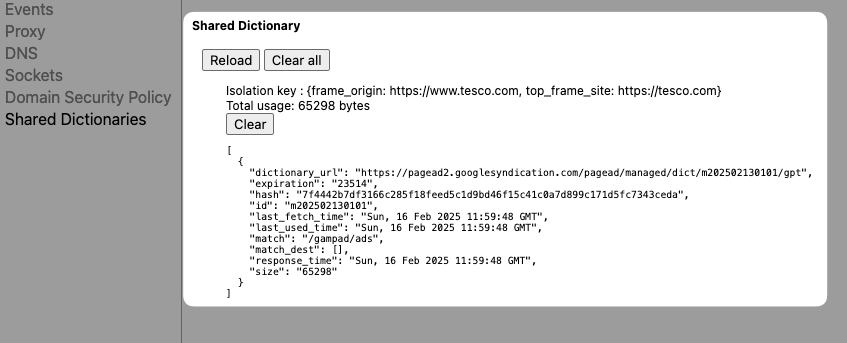
Debugging shared dictionaries
Shared compression dictionaries are a way to re-use previously transferred website data, even when the exact file contents have changed.
Chrome's net internals tool can show you what pages are using shared compression dictionaries and allows you to remove them by clicking Clear or Clear all.
Test first visits in a controlled environment
Clearing all necessary caches and enabling high-quality network throttling can be a hassle. If you want to test a fresh visit to your website, you can instead use DebugBear's free website speed test.
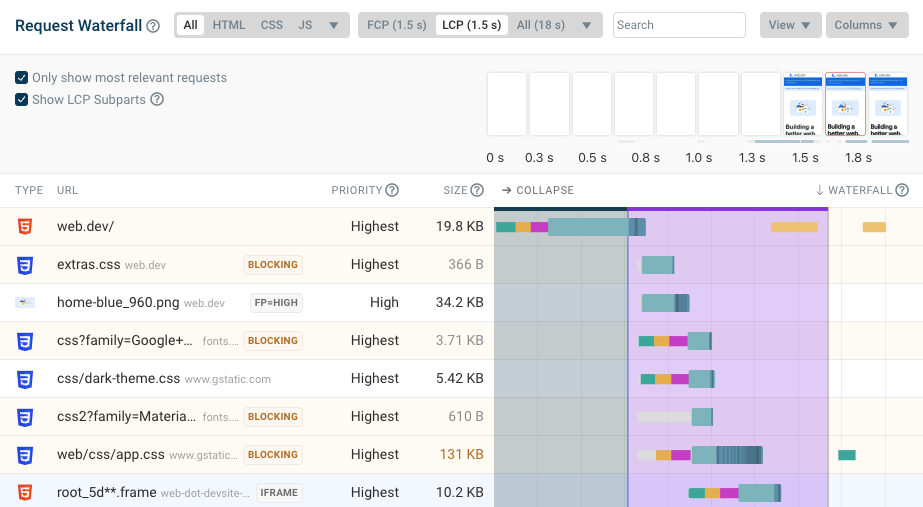
DebugBear can give you detailed insight into how your website loads and what origins Chrome is connecting to. For example, you'll get a detailed network request waterfall.
With continuous synthetic website monitoring you can quickly detect performance regressions, track your optimizations, and compare different test results.
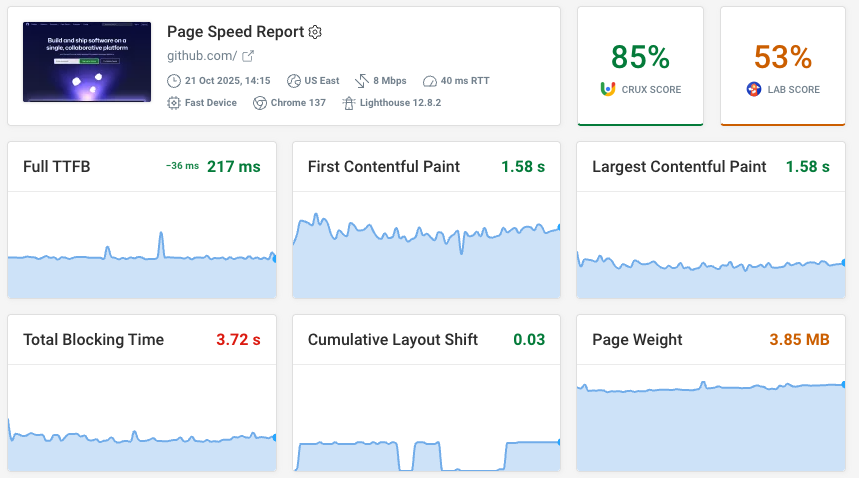


Monitor Page Speed & Core Web Vitals
DebugBear monitoring includes:
- In-depth Page Speed Reports
- Automated Recommendations
- Real User Analytics Data