
Google's Core Web Vitals metrics impact user experience and Google rankings for your website.
Find out how to find web vitals data in SEMrush and how to interpret it to make your website faster.
How to view Core Web Vitals data in SEMrush
Follow these steps to view web vitals reporting in SEMrush:
- Find the On page and tech SEO section in the sidebar
- Click Site Audit
- Select the site you want to audit
- Under Thematic reports, find the Core Web Vitals box
- Click View details
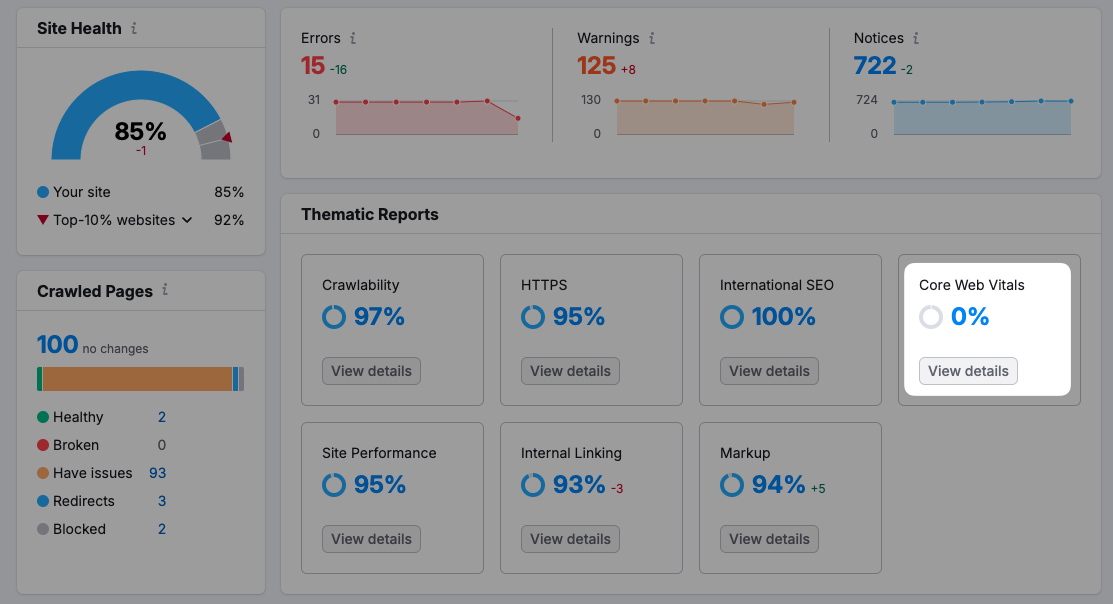
You'll then see SEMRush's Core Web Vitals report, highlighting web performance issues on your website.
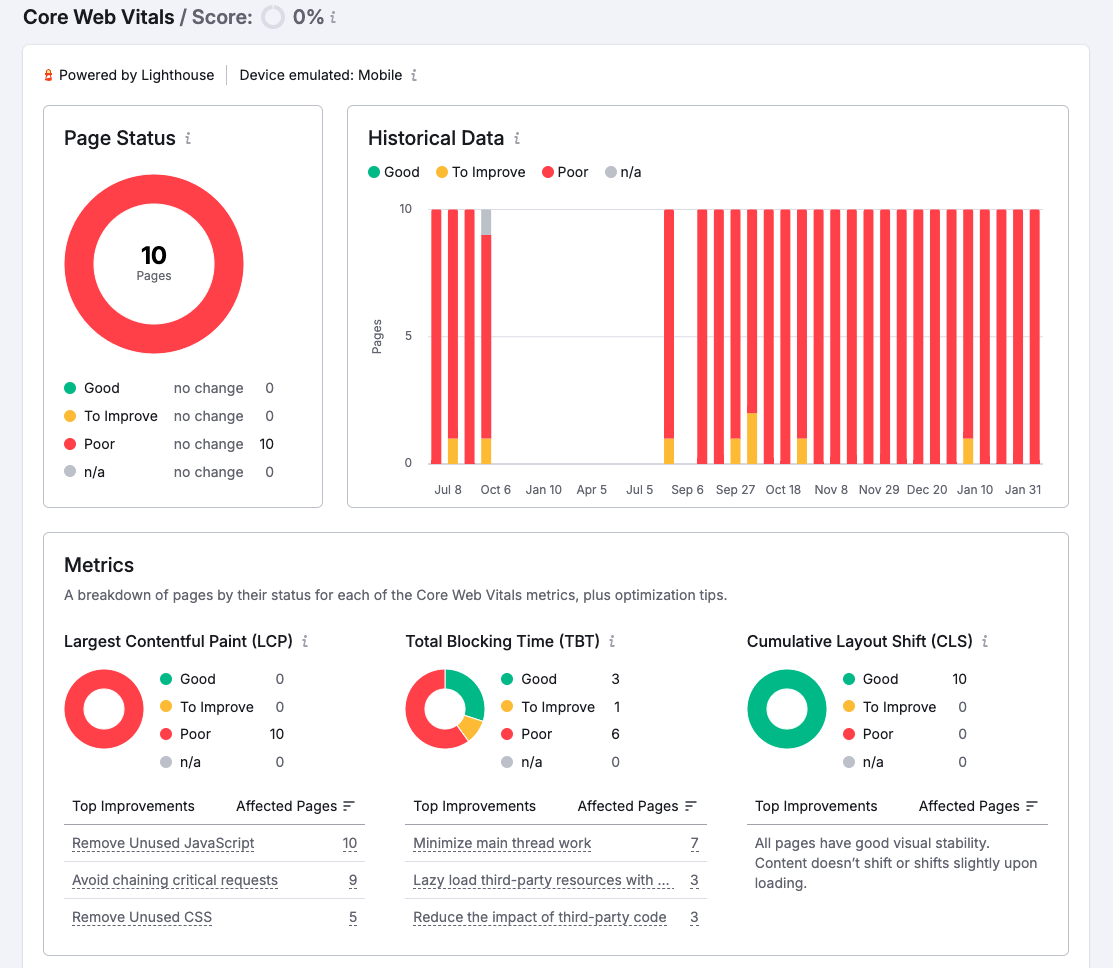
Understanding the SEMrush Core Web Vitals report
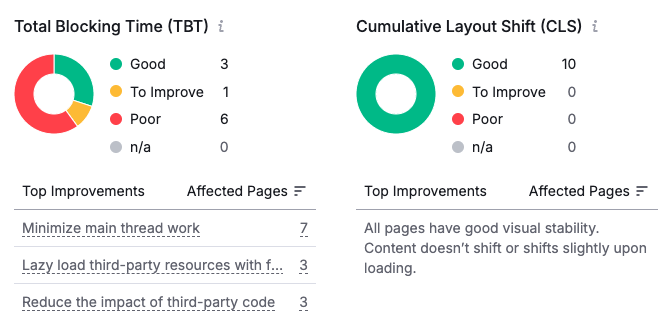
SEMrush shows you how many of the pages on your website perform well according to metrics like the Largest Contentful Paint, Total Blocking Time, and Cumulative Layout Shift
You can also look at specific pages on your website to see:
- How performance has changed over time
- What page element is responsible for the Largest Contentful Paint
- Tips to improve your website
In the example below, we can see that the LCP element is an H1 tag.
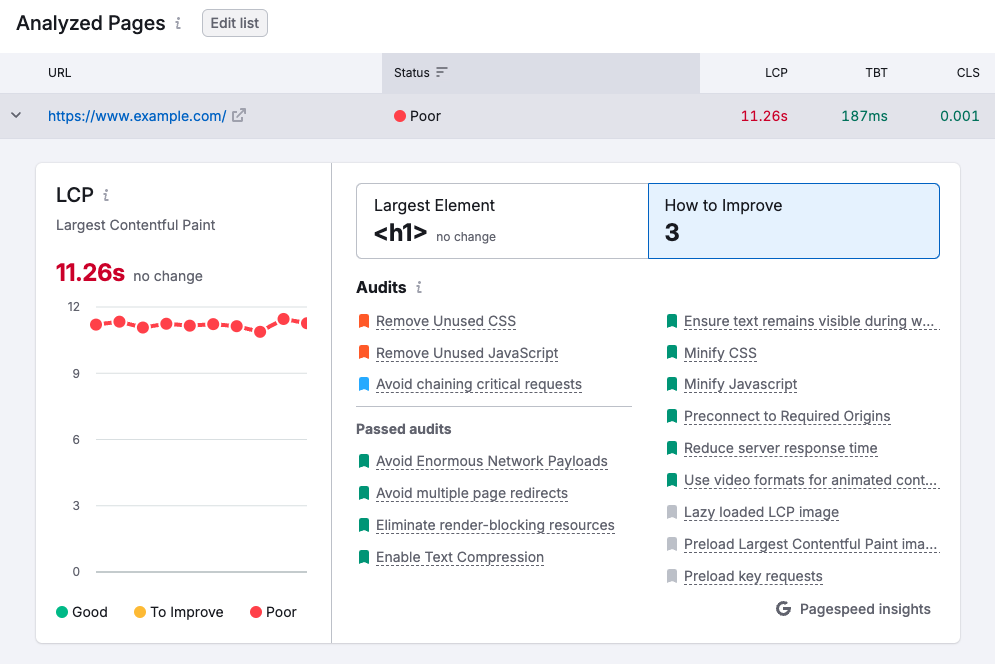
The audits SEMrush shows come from Google's free Lighthouse tool, which provides suggestions like removing unused CSS, removing unused JavaScript, and avoiding critical request chains.
Does SEMrush report synthetic or real user Core Web Vitals?
SEMrush reports data from synthetic performance tests that's collected in a lab testing environment. That means only the initial page load is tested, and interaction metrics like Interaction to Next Paint are not supported.
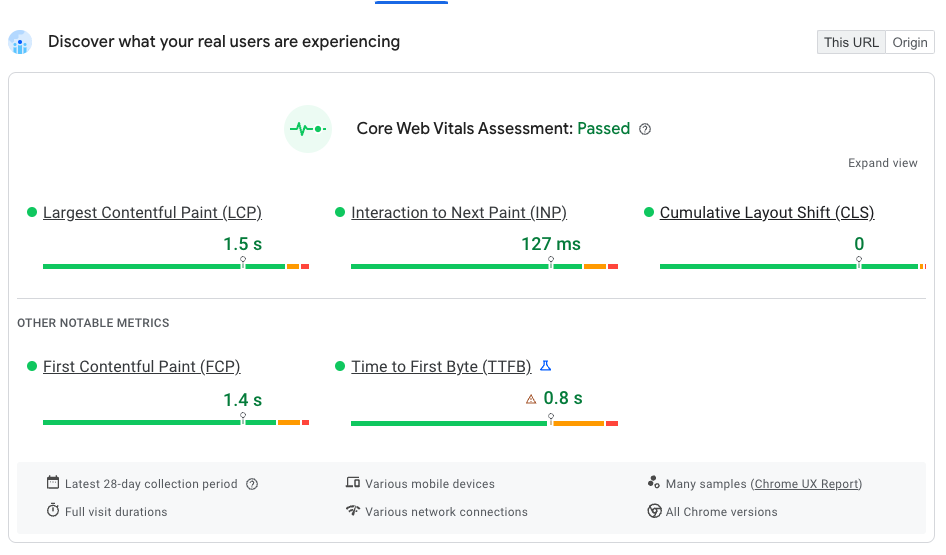
However, what matters for Google SEO is real user monitoring data from the Chrome User Experience Report (CrUX).
Is SEMrush Core Web Vitals data reliable?
Seeing poor scores in SEMrush does not mean that you have Core Web Vitals issues on your website. For example, the page above with a Largest Contentful Paint score of 11.2 seconds actually passes Google's Core Web Vitals assessment with an LCP score of 1.5 seconds!
SEMrush is also built on simulated rather than measured performance data. That means the same synthetic testing limitations that make PageSpeed Insights unreliable also make SEMrush data unreliable.
To get reliable synthetic metrics and CrUX data, try the free DebugBear speed test.
How to fix Core Web Vitals issues on your website
To get the best insight into your web vitals metric you need to combine three components:
- High-quality synthetic data
- Google CrUX reporting
- Real user monitoring
DebugBear is a Core Web Vitals monitoring tool that can help you check your Core Web Vitals, identify specific performance optimizations, and pass Google's web vitals assessment.
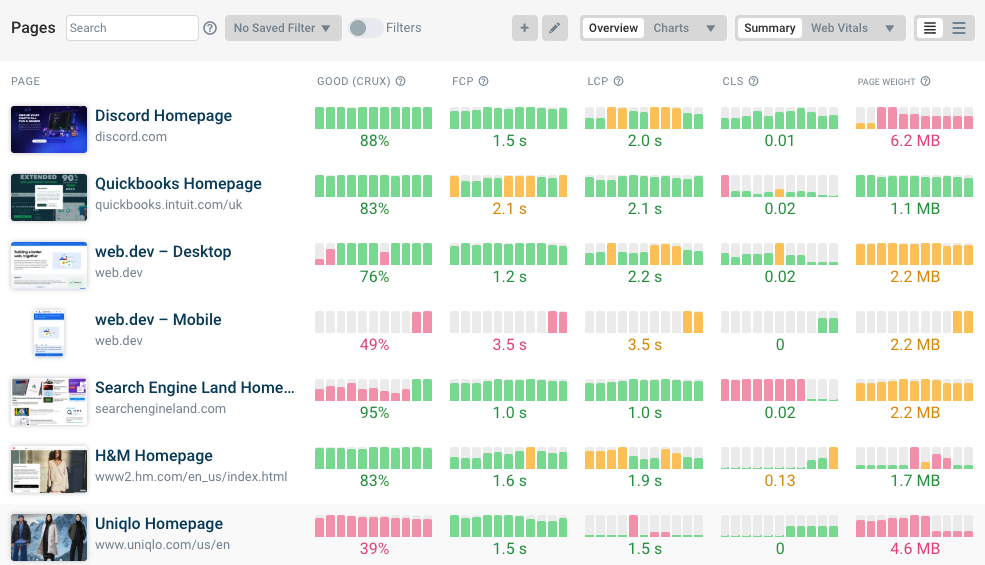
You can track high-level performance metrics for your own website and your competitors, and then deep-dive into technical aspects slowing down your pages.
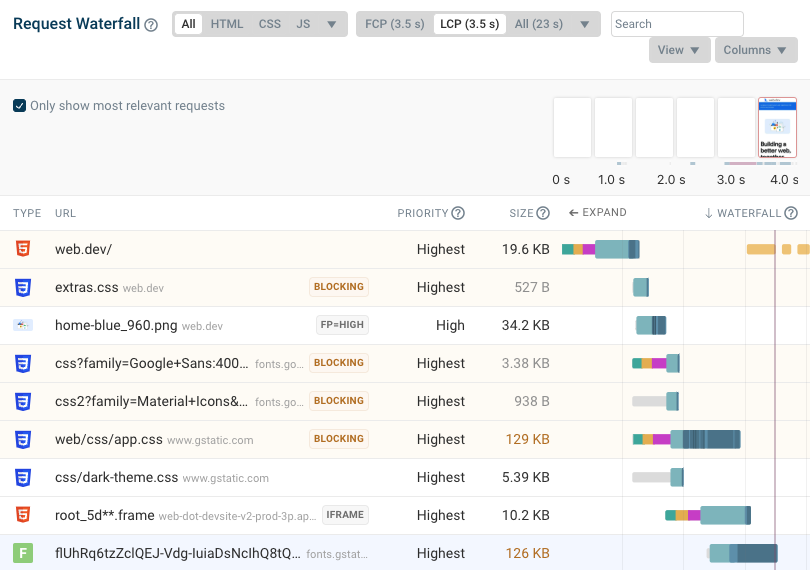
Perform detailed performance analysis with request waterfalls and custom recommendations. Each test result also includes a full Lighthouse test report.
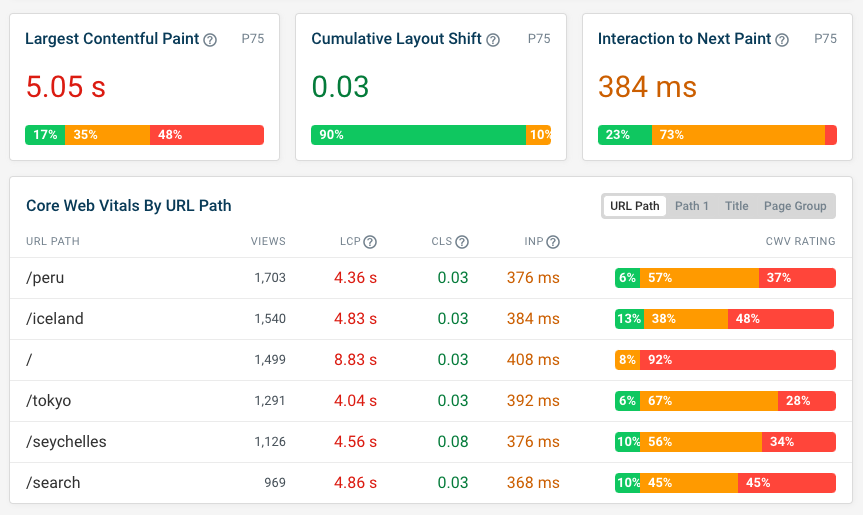
Our real-user monitoring product provides real-time data on how fast your website is for actual visitors. Identify specific slow pages on your website and identify what causes these performance issues.
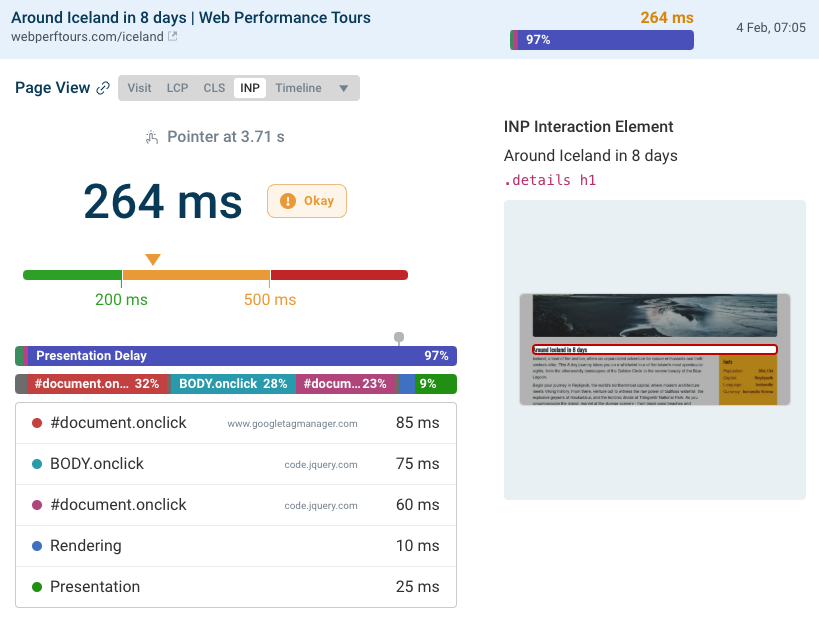
You'll also get detailed analytics for the Interaction to Next Paint metric. For example, you can see:
- What element a user interacted with
- Whether the page was still loading at that point
- What specific scripts delayed the interaction


Monitor Page Speed & Core Web Vitals
DebugBear monitoring includes:
- In-depth Page Speed Reports
- Automated Recommendations
- Real User Analytics Data