
Conducting a website health check helps you identify ways to improve your website for your visitors and get more business from your website.
This article takes a look at different aspects of website health, and what you can do to check how your website is doing.
What is a healthy website?
A healthy website provides a good experience for visitors and delivers good results for the business. If your website isn't working correctly, visitors won't become customers.
Google has defined the Core Web Vitals as a set of user experience metrics:
- Largest Contentful Paint: how quickly does your website load
- Cumulative Layout Shift: is the layout stable once the page has rendered?
- Interaction to Next Paint: does the page respond quickly to user input?
These metrics don't just matter to users, but Google also uses them as a ranking factor. Doing well on them can get you more organic search traffic.
A healthy website should also be accessible, secure, and optimized for SEO.
Check Google Core Web Vitals
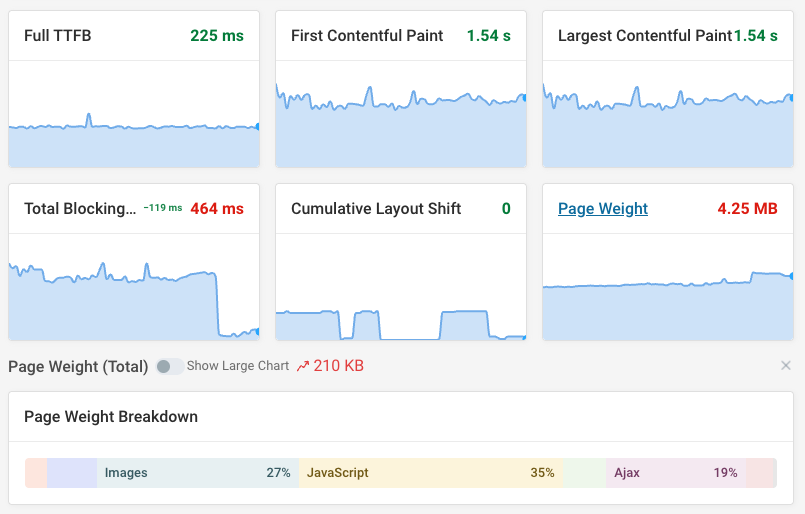
A first step to check your website health is to measure Core Web Vitals. You can use DebugBear's free website speed test to do that.
To pass the web vitals assessment you need to provide a good experience across all three metrics to at least 75% of your visitors.
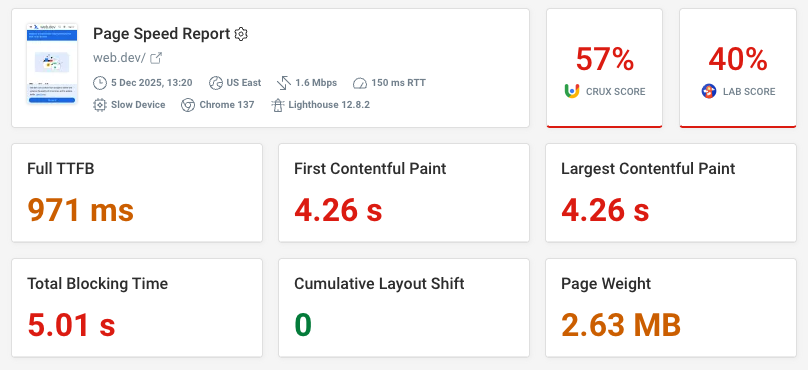
The speed test result shows the overall score for your website at the top of the report. In this case, only 57% of visitors have a good overall experience, so there's room for optimization. This is based on real user data from Google's Chrome User Experience Report (CrUX).
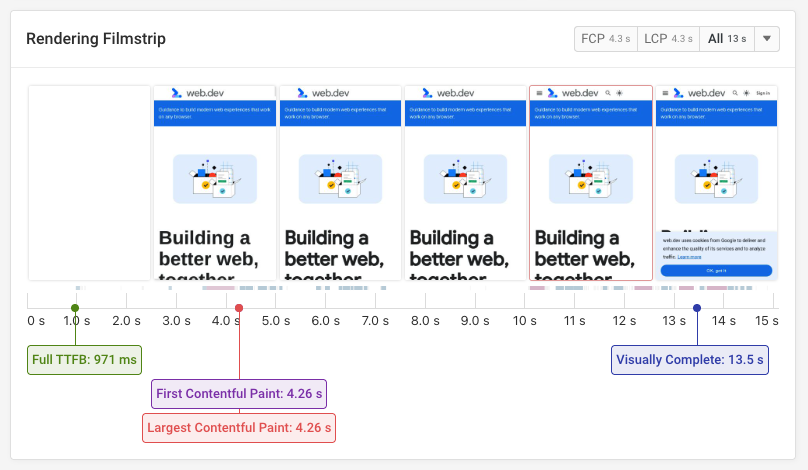
The filmstrip view shows you how a visitor experiences how your website loads. Unlike the overall CrUX assessment this is based on an on-demand lab-based test.
The website first starts blank, then content starts to appear. At first a fallback font is used, but then changes to the web font once it's downloaded.
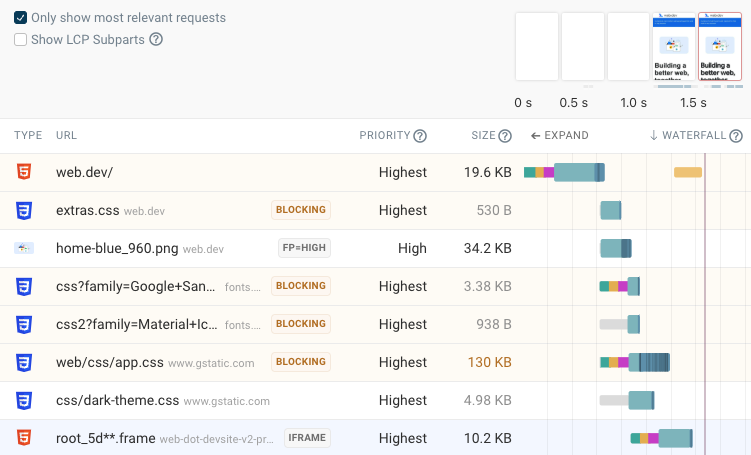
The request waterfall view shows you when different resources load, which in turn determines when content becomes visible to a visitor.
Waterfalls are a great tool to help understand your website and optimize website performance.
The speed test result also includes a list of specific performance recommendations that would make your website faster.
Check Accessibility and SEO
Google's PageSpeed Insights tool doesn't just test page speed but also provides scores for accessibility and SEO. For a focused SEO audit, try our website SEO checker.
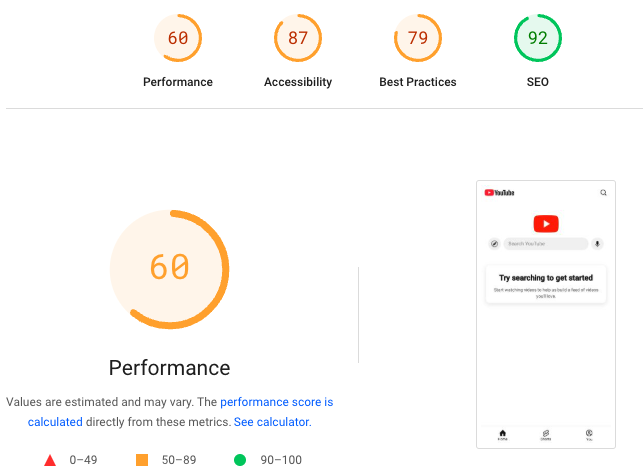
PageSpeed Insights shows the CrUX performance data at the top and then provides Performance, SEO, Best Practices, and Accessibility scores under the Diagnose performance issues heading.
PageSpeed Insights is based on Google's free Lighthouse tool, which is also integrated into other website performance testing and monitoring tools.
If you scroll down to the relevant category you can find specific information about the issue on your website.
For example, in the Accessibility section Google detects insufficient contrast between background and foreground colors. If there is not enough contrast that makes it difficult to read the text content of an element.
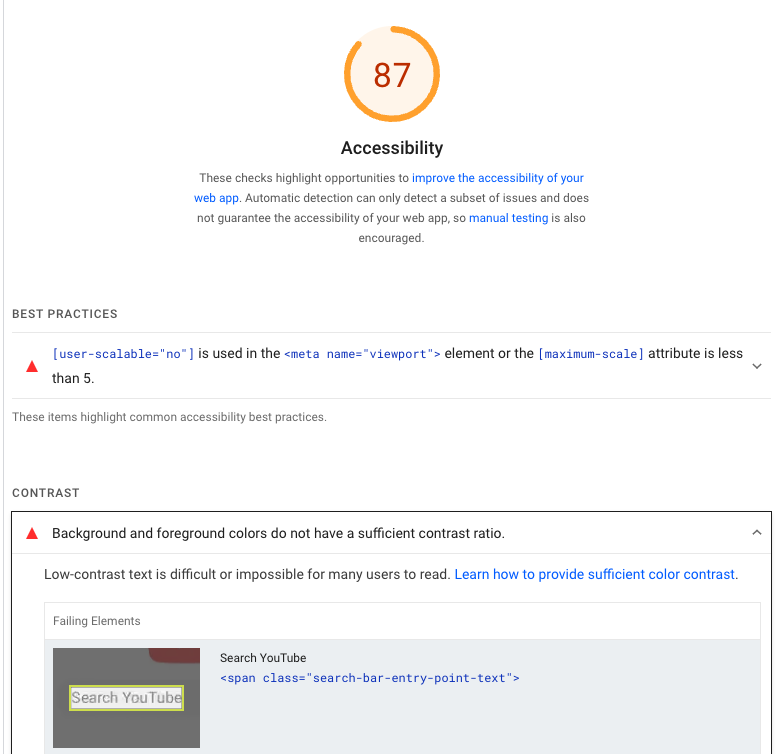
Keep in mind that Lighthouse can't test all aspects of accessibility and you need to manually check accessibility for best results.
View website issues in Google Search Console
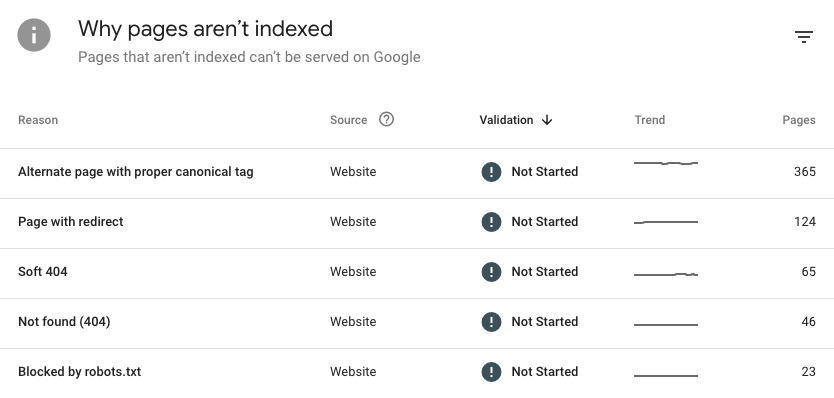
Search Console is another great tool to check for website health issues from an SEO point of view.
It shows you how much search traffic your website gets, and what keywords you're ranking for.
You also get insight into specific technical issues that may affect whether your content ranks in Google. For example, you can see different reasons why Google can't index content on your website.
Improving WordPress website health
If you've got a WordPress site, we have a dedicated guide to WordPress speed that explains:
- How to check site health in WordPress
- Whether hosting is impacting page speed
- How your theme and plugins contribute to performance
You can also look for a managed WordPress optimization service to improve your site health. Many agencies can optimize WordPress sites and manage them on your behalf. For example, Sitecare offers a Core Web Vitals guarantee to their clients!
Tools to check and improve website health
We've touched on a few tools you can use to check your website already, but there are many website optimization tools available.
Tools like Ahrefs and SEOTesting can provide more detailed insight into how optimized your website is for search engine traffic.
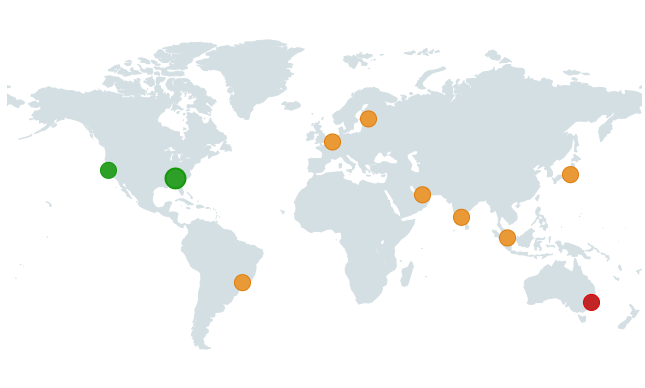
Content Delivery Networks (CDNs) are a great way to provide good performance across different global locations and automatically apply optimizations like enabling text compression or optimizing images.
To see if global performance is an issue you can run a free global TTFB test. If you get visitors across the world this will tell you if performance is an issue for some of them.
Continuously check for website issues
Optimizing your website health isn't a one-off effort. Once you're in a good place you need to make sure to stay there and quickly detect issues as they come up.
DebugBear's website performance monitoring service can test your website continuously and alert you to regressions.
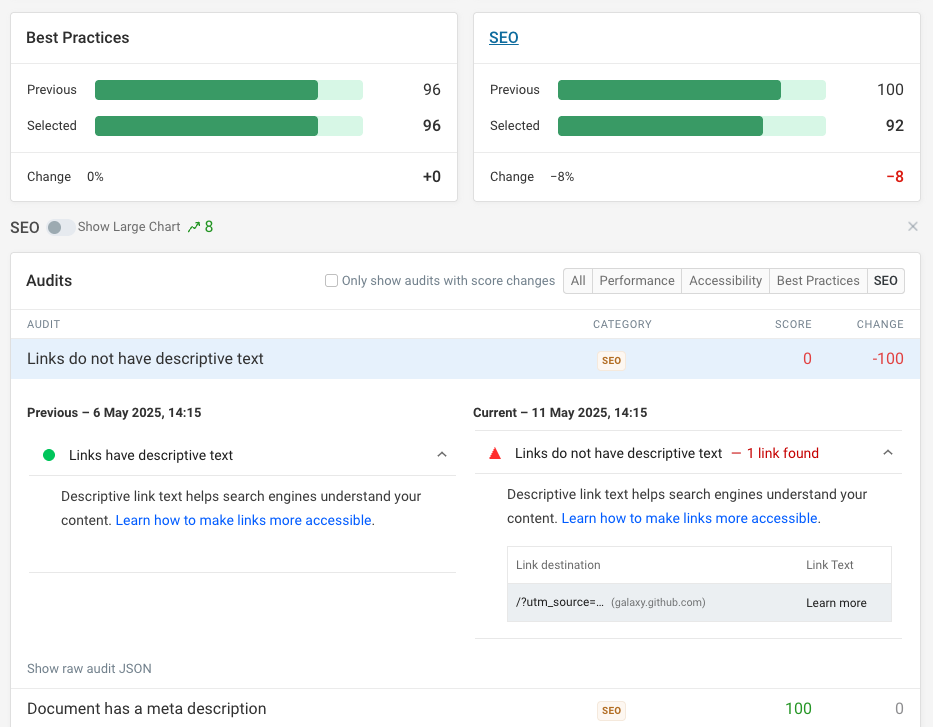
After getting notified about a new problem you can compare test results before and after the change, to see exactly what changed.
In this example we can see a regression in the SEO score. A new link without descriptive text was introduced on the page, in this case titled "Learn more".
Check user experience with real user monitoring
With real user monitoring you can see how fast your website is for every visitor, and identify opportunities to improve experience for specific visitor segments.
By tracking conversions you can also measure the business impact of your optimizations and see how performance metrics and conversions correlate.
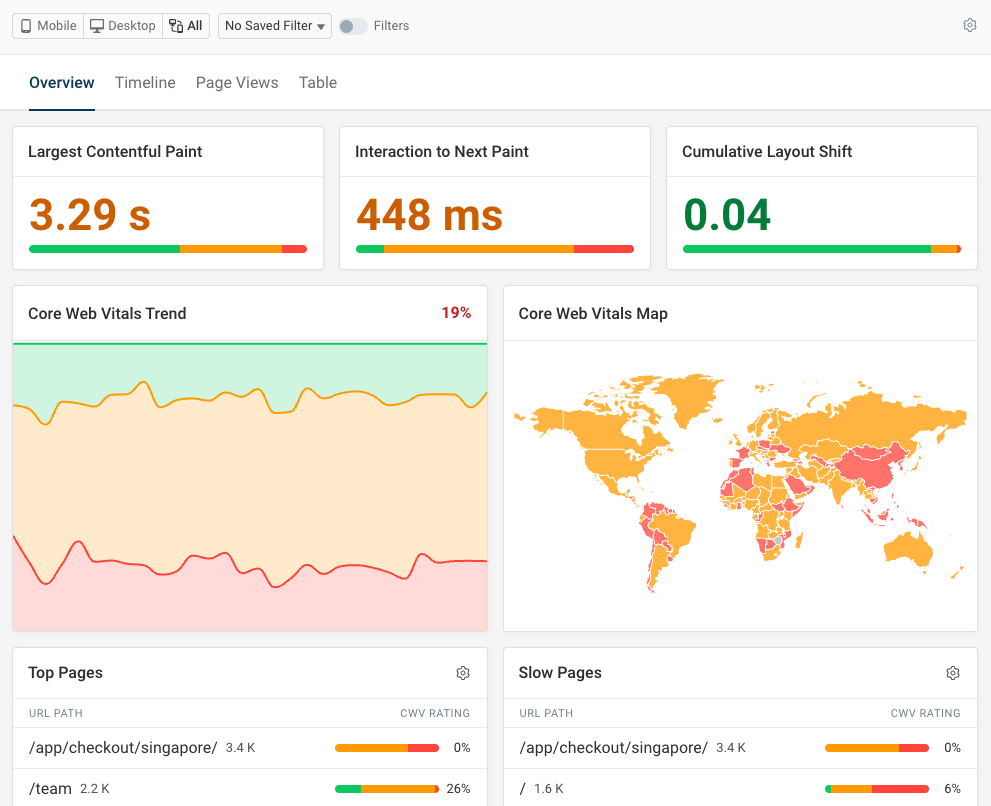
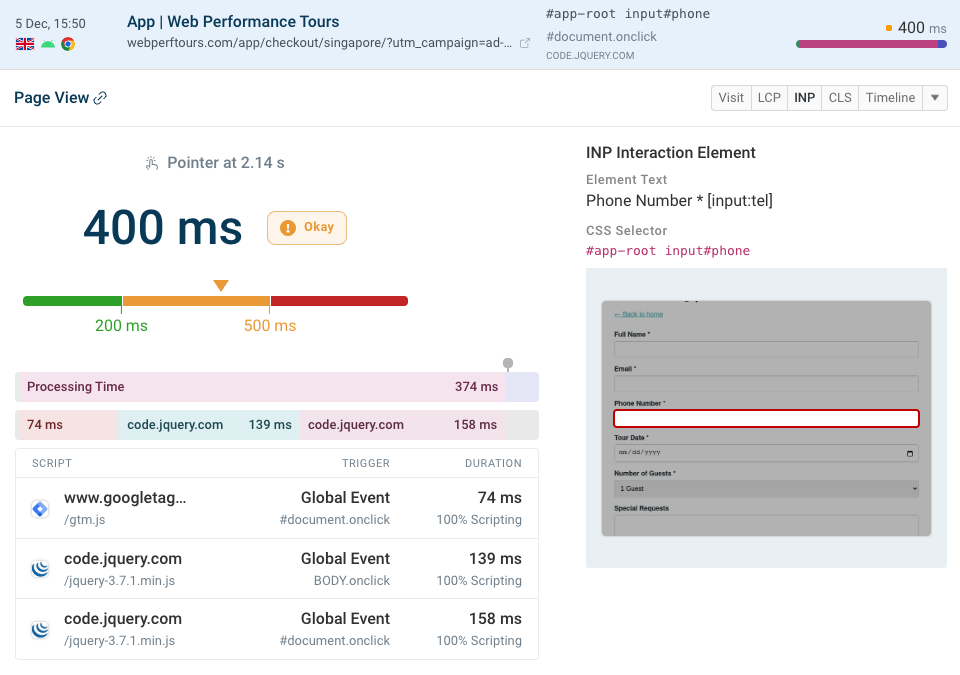
Detailed debug data can help you fix slow interactions. For example you can see what pages have poor INP scores, what page elements result in a slow interaction, and what specific scripts caused a delay.
Sign up for a free trial to get started with comprehensive website monitoring to optimize your website health.


Monitor Page Speed & Core Web Vitals
DebugBear monitoring includes:
- In-depth Page Speed Reports
- Automated Recommendations
- Real User Analytics Data