
Online business need to monitor their infrastructure and make sure end users have a good experience. Dynatrace is one tool that can provide this functionality for IT teams.
In this article we'll look at the functionality that Dynatrace provides and what alternatives make sense for different uses cases.
What to look for in a Dynatrace alternative
Dyntrace is a comprehensive website, cloud, and application monitoring tool. Depending on your needs you'll need to look for another full-service solution or a focussed service that addresses a particular need.
Dynatrace covers many different features:
- Synthetic website monitoring
- Real user monitoring
- Cloud infrastructure monitoring
- Application performance monitoring
- Application security monitoring
What solution is right for you also depends whether you are looking for detailed observability for devops and development teams, or a more user-focussed digital experience solution that also covers business and marketing needs.
What are the best Dynatrace alternatives?
While the best option depends on the needs of your team, in this article we'll look at the following solutions:
- DebugBear
- DataDog
- NewRelic
- Grafana
- Sentry
DebugBear: For Core Web Vitals And Performance
DebugBear can help you if you care about end user experience and the loading speed of your website. Unlike Dynatrace, it has a big focus on Google's Core Web Vitals metrics. Web Vitals impact SEO, so DebugBear caters to both development and marketing teams.
Instead of covering the whole range of monitoring observability features, DebugBear specializes in synthetic website monitoring and real user monitoring.
You can track performance of your website over time and see how it impacts your visitors.
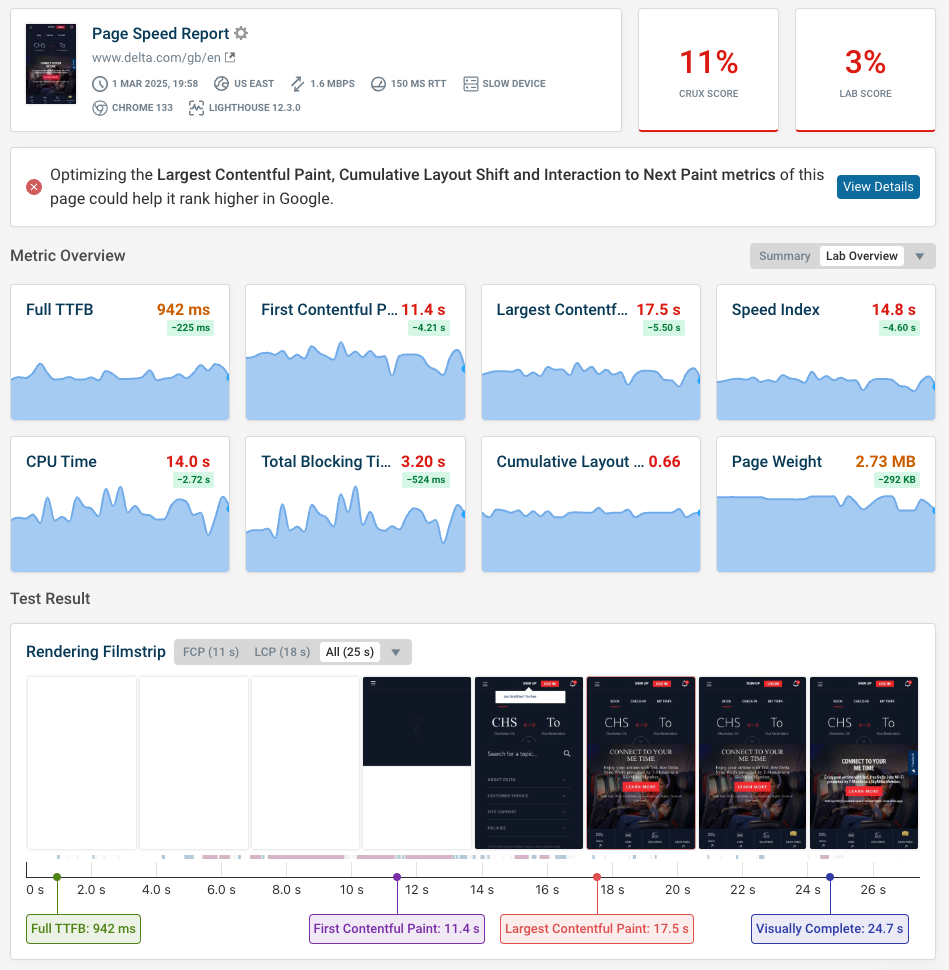
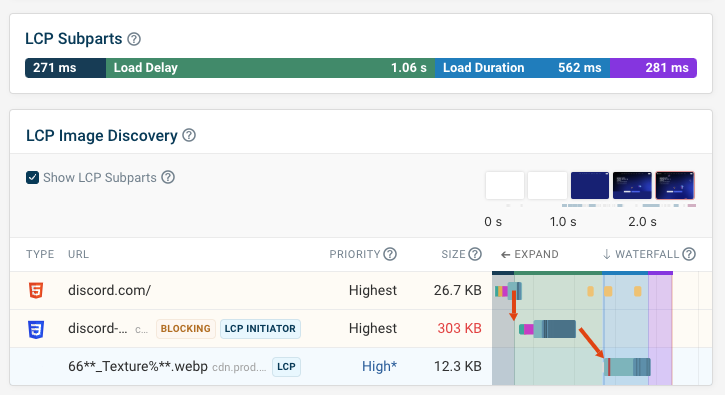
The request waterfall features provides detailed insight into the loading speed of your website, including:
- Time to First Byte
- Render-blocking requests
- Request chains
- Resource priorities
- Main thread CPU tasks
You can either see a focussed analysis for a specific performance metrics like the Largest Contentful Paint or view every resource loaded by the page.
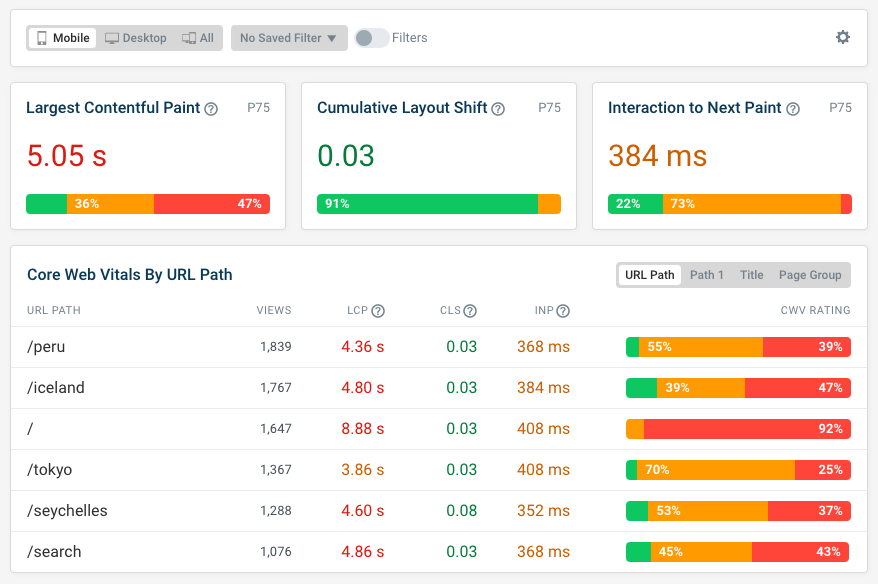
The real user monitoring data shows high-level Core Web Vitals metrics across your website. You can segment the data by properties like device type, network speed, country, as well as custom tags.
While synthetic testing needs to be set up for specific page URLs on your website, real user data covers all pages that get traffic. You can identify where on your site visitors commonly have poor experiences and then dive into the data to debug the issues.
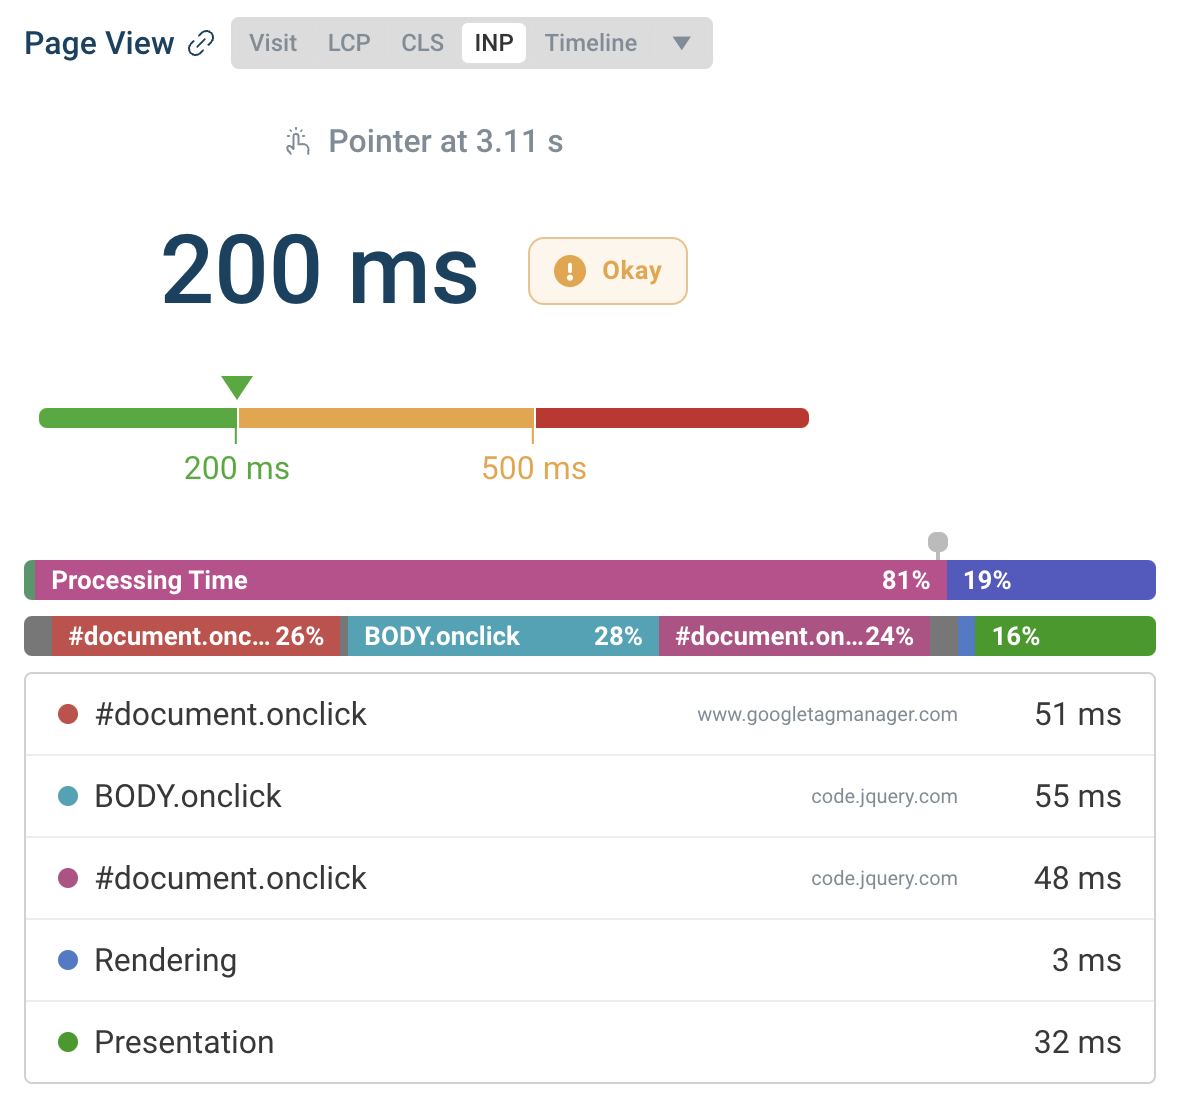
Debugging poor Interaction to Next Paint scores is often difficult. DebugBear real user monitoring tells you:
- What pages have poor INP
- What UI elements cause slow interactions
- What scripts delay the interaction
The screenshot below shows INP data for specific page view on a website.
While Dynatrace has usage-based pricing, DebugBear's pricing is based on a fixed-price starting at $125/mo.
DataDog: Comprehensive Modern Cloud Monitoring
Like Dynatrace, DataDog covers many different monitoring and observability features like performance, security, log management, network monitoring, and custom analytics.
DataDog provides in-depth monitoring that integrate closely with your development and release workflow. The company was founded 5 years after Dynatrace, and offers a more modern product overall.
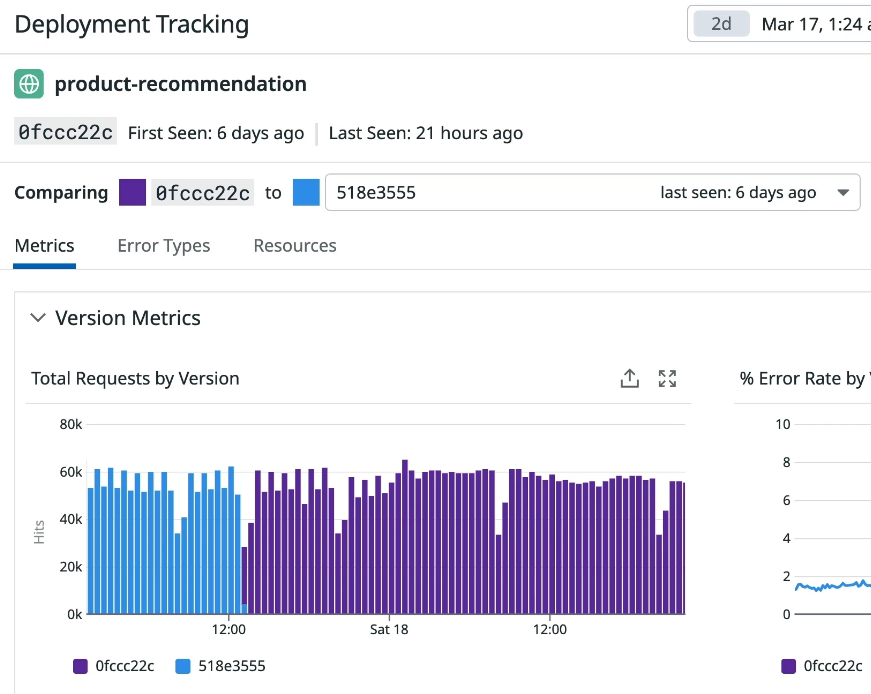
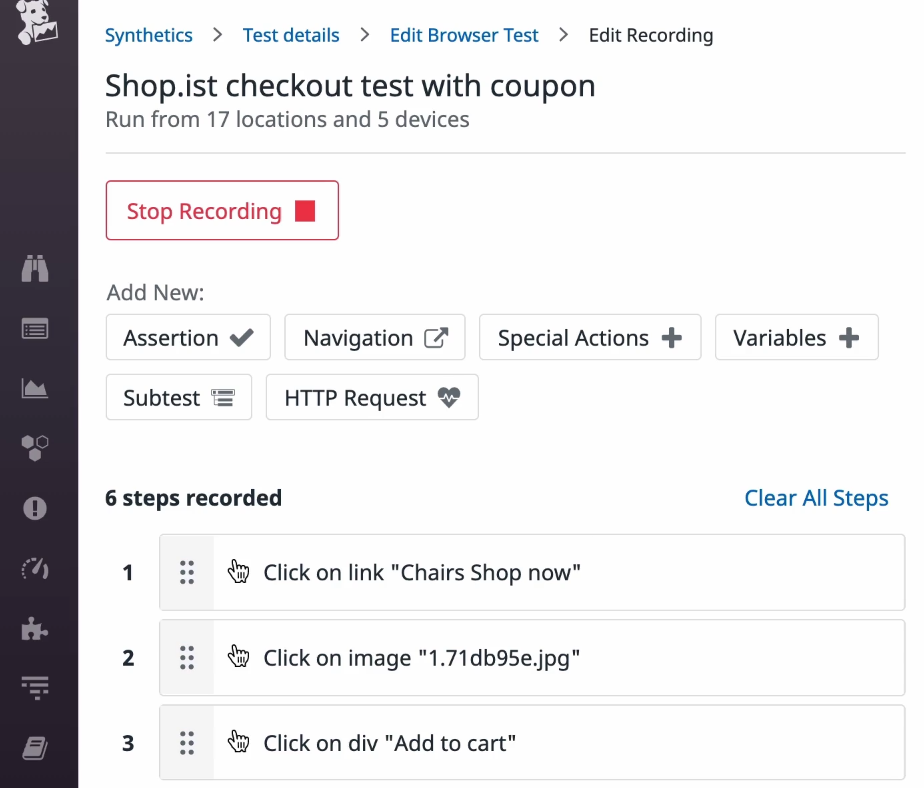
DataDog synthetic monitoring focusses more on technical reporting than web vitals and Lighthouse scores.
However, it provides great support for transaction monitoring with an intuitive visitor flow builder.
Pricing is usage-based, depending on how many servers you need to monitor, how many synthetic tests you run, and how many visitors are tracked on your website.
New Relic: In-depth observability
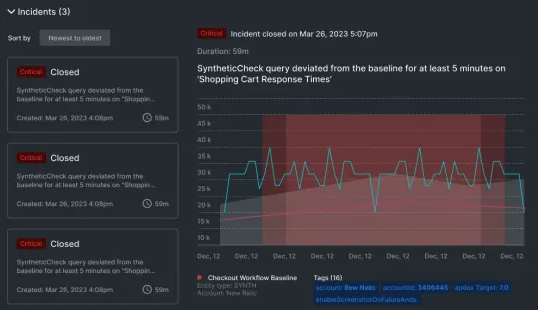
New Relic provides a solution to monitor your entire website infrastructure and application code.
After setting up monitoring you can configure alerting criteria and incident reporting to stay on top of website availability and performance.
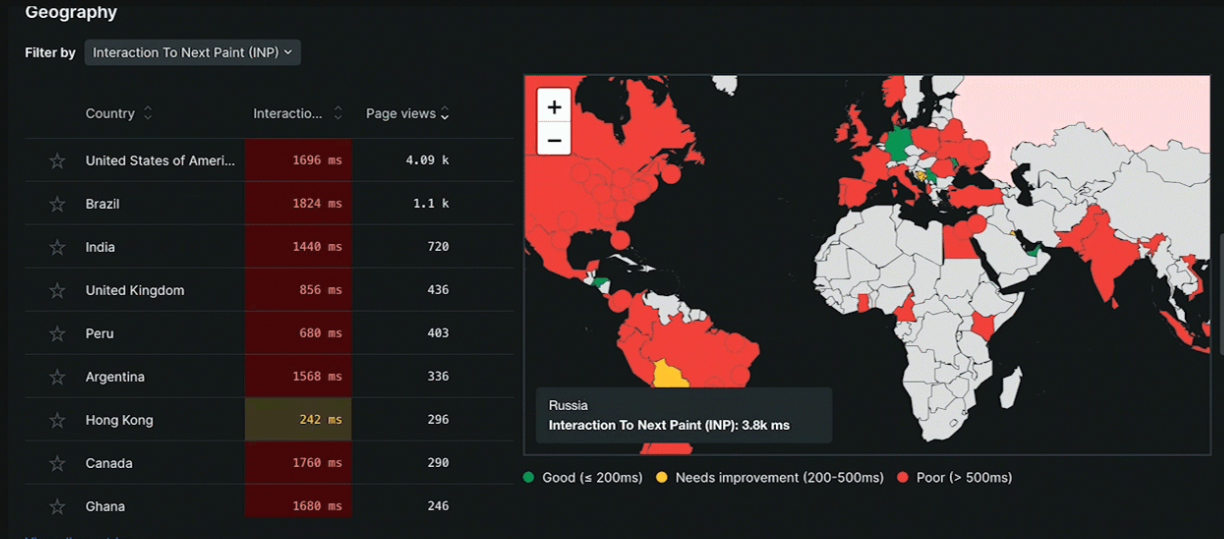
New Relic also include real user Core Web Vitals monitoring, for example showing you performance scores across the world, along with the view count for different countries, pages, and browsers.
New Relic has a free tier with a data ingestion limit of 100 gigabytes a month. Beyond that you need to pay by amount of data ingested as well as per user. To upgrade, you need to contact New Relic for a custom contract.
Grafana: Open source Dynatrace alternative
Grafana offers open source tooling, a hosted cloud service, and more advanced enterprise features. It's geared towards technical teams and supports both front-end monitoring and backend performance monitoring.
You can create detailed custom dashboards to keep track of your infrastructure and get alerted to potential issues.
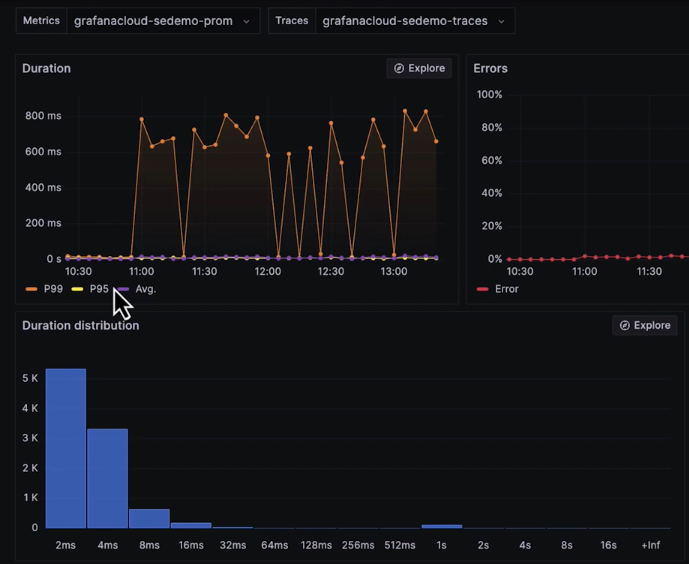
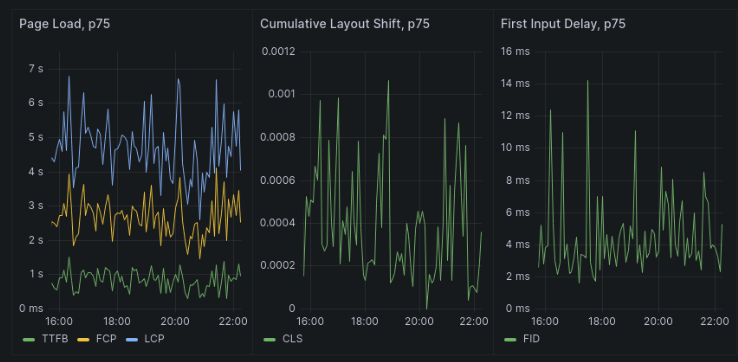
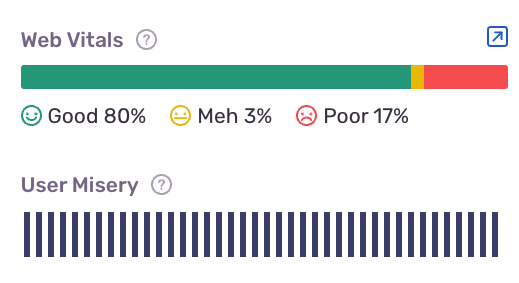
Grafana also provides real user monitoring including web vitals reporting. However, the reporting is built around the general-purpose dashboards rather than a more a purpose-built interface.
You can report metrics at different percentiles and see how website experience varies between different visitors.
You can self-host Grafana for free or sign up for the Grafana Cloud free tier. Paid plans start from $19/mo or $299/mo with 24-hour support.
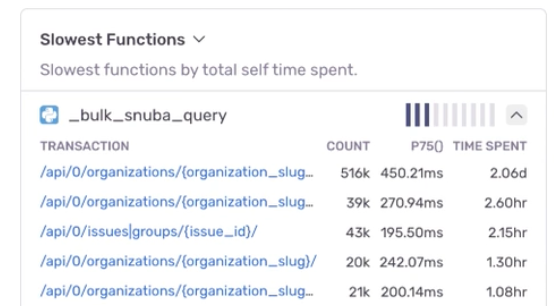
Sentry: Monitoring For Developers
Sentry provides a more focussed application monitoring product for developers. It offers error monitoring, uptime monitoring, real user performance data, and backend performance insights.
Core Web Vitals reporting is included in the real user monitoring functionality.
Grafana does not run scheduled synthetic tests, but instead has a focus on real world application performance.
The profiling data data provides detailed performance insights for developers, making it easy to pinpoint what caused site speed issues.
Sentry has a free tier with paid plans starting at $26/mo. Beyond that, pricing is usage-based.
How to pick a Dynatrace alternative
Website and application monitoring tools usually provide a free trial or free tier, allowing you to experiment with different solutions to see how well they work for your use case.
Other than features, price plays a big role when deciding what monitoring solution to go with. A fixed-price subscription may present a higher minimum cost, but also allows you to control your expenses.
Usage-based pricing will grow over time as your team and data processing needs grow and you need to make sure to review costs periodically. A less comprehensive alternative to Dynatrace that's less geared to enterprise clients likely allows you to reduce overall costs.
Enterprise features like SSO or advanced user management often come with additional costs and longer-term commitments.
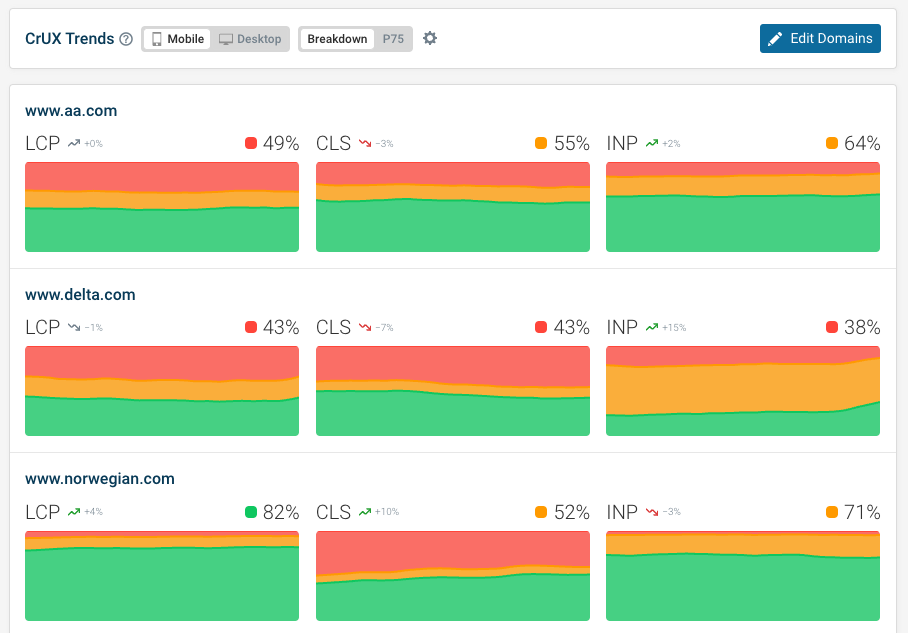
Benchmarking Google CrUX Data
Many general-purpose observability platforms don't include reporting for the Chrome UX Report data that matters for Google rankings.
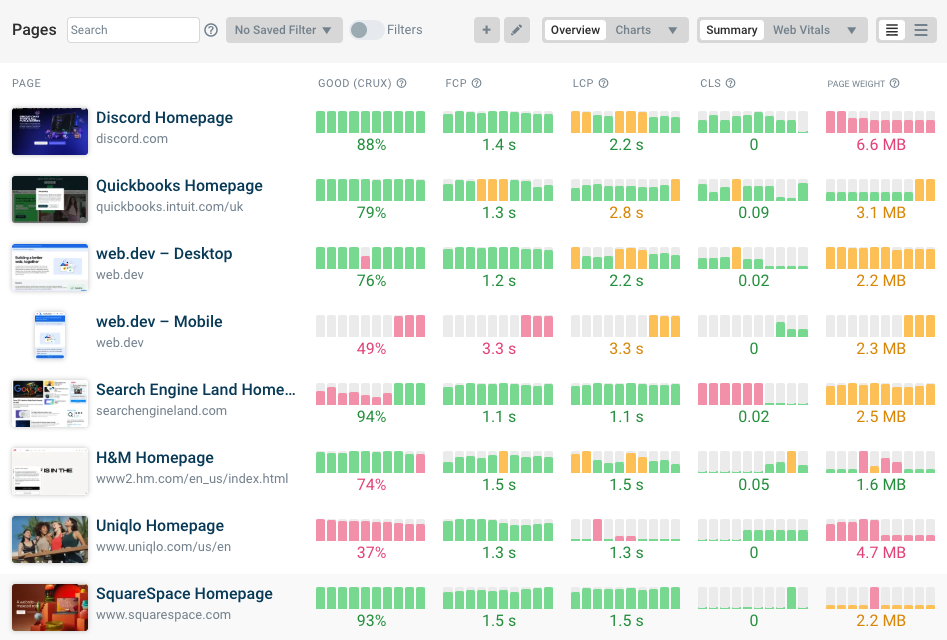
DebugBear includes this data with each scheduled tests as well as providing a dashboard to benchmark performance in your industry.
Performance monitoring features to look for
When considering a Dynatrace alternative to track web performance, check whether the following is available, depending on the needs of your team:
- Front-end and backend monitoring
- Synthetic request waterfalls
- Customizable dashboards
- Detailed Core Web Vitals reporting
- Customizable alerting
- Different global test locations
- Integrations with other tools like Slack
Find alternatives for specific uses cases
If you're looking for a new tool, it makes sense to compare different options across specific feature sets. These articles take explain what's available for different product niches:
- Real user monitoring tools: measure end user experience
- Synthetic monitoring tools: run scheduled performance tests
- Website performance monitoring tools: track different types of performance data
You can also read our guide to different types of monitoring to learn more about what each product types adds to an overall solution.
Get insight into your front-end performance
If you're looking for a website monitoring solution to improve your Core Web Vitals, DebugBear provides detailed insight for that specific use case.
Collect performance data from different sources and get reporting in an interface that's built to help you identify performance optimizations. Sign up for a free trial.


Monitor Page Speed & Core Web Vitals
DebugBear monitoring includes:
- In-depth Page Speed Reports
- Automated Recommendations
- Real User Analytics Data