A Late Network Request Adjusted The Page Layout
To identify potential causes of layout shifts on a page you can run a website test using a tool like PageSpeed Insights or the DebugBear speed test.
This article will explain what it means when a poor CLS score is caused by a late network request adjusting the page layout.
What does it mean when a request causes a layout shift
Layout shifts can be caused by page resources loading on the page. For example, new content might appear after a JavaScript file has loaded.
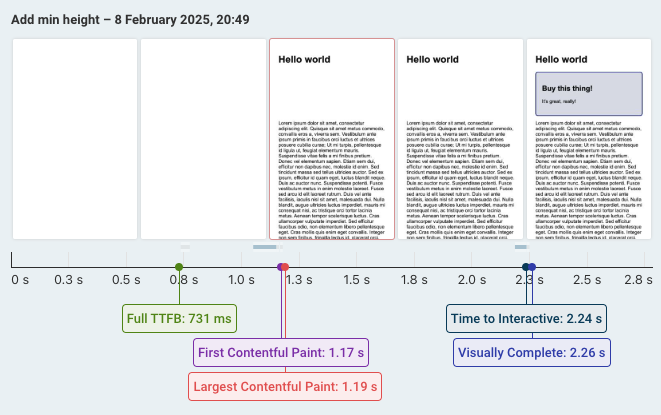
The filmstrip below shows an example of a layout shift caused by an ad appearing on the page.
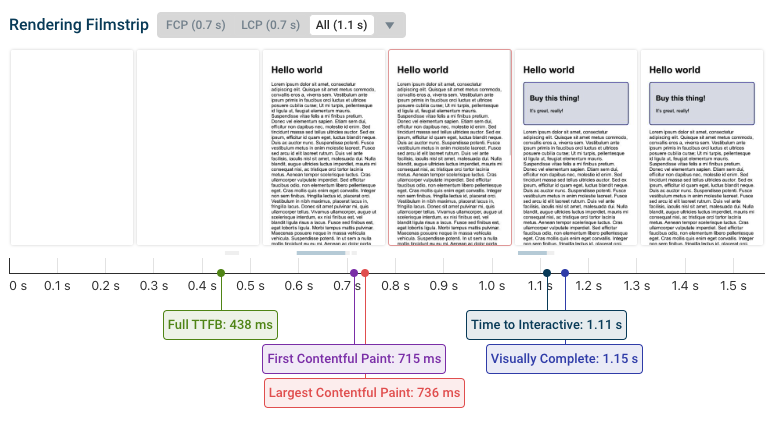
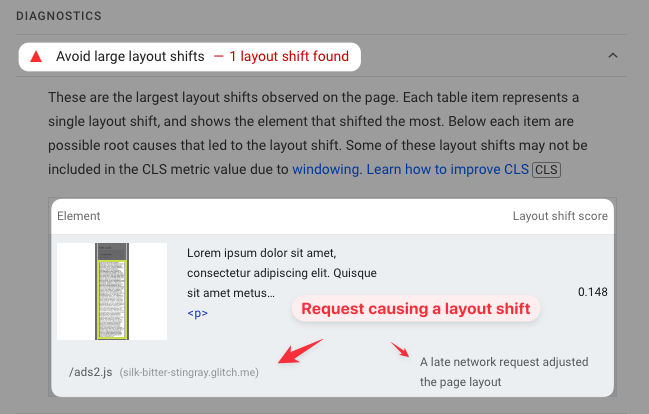
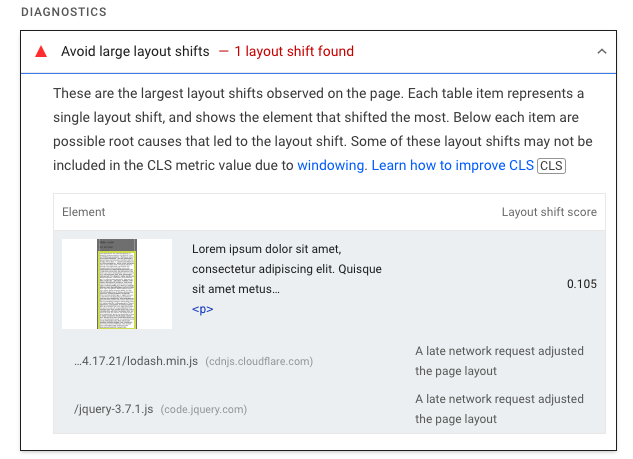
If we open the Avoid large layout shifts audit in Lighthouse we can see that the layout shift is attributed to a late network request adjusting the page layout. In this case, the request is ads2.js.
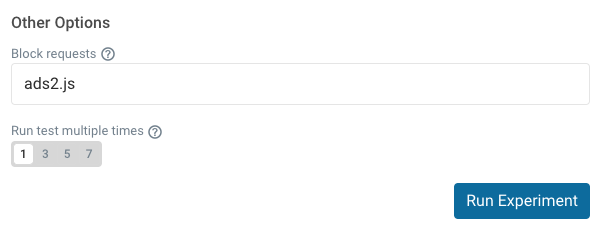
To confirm whether that's actually the case we can use the request blocking feature in Chrome DevTools or run an experiment in DebugBear.
In the experiments UI we have to enter the name of the resource we want to block and then click Run Experiment.
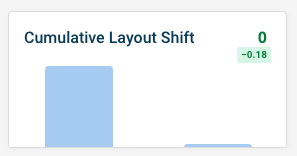
After running the test we can see that blocking the requests fixes the CLS issue on the page. Removing ads from a website probably isn't the actual way to solve the issue, but blocking the request confirms that the ads script is causing the layout shift.
Lighthouse will not attribute layout shifts to requests that are not render-blocking.
How to fix the layout shift
Now that we know that the appearance of the ad is causing the layout shift we can look for a fix.
When content appears later it's usually best to set a CSS min-height on the container that the content is added to. In this example, we can add this code to the page:
<style>
  #ads {
    min-height: 146px;
  }
</style>
Running another experiment confirms that this fixes the layout shift while still making sure the ad appears when it's ready.
Is the layout shift attribution in Lighthouse reliable?
The layout shift attribution is only an estimate to help you identify potential layout shift culprits.
Sometimes the attribution won't be correct. For example, here's another page with an ads script causing a layout shift. However, Lighthouse is listing two scripts that are unrelated to the shift happening on the page.
If blocking the script does not resolve the layout shift then you need to investigate exactly what's happening on your page and what other page resources are responsible for those layout changes.
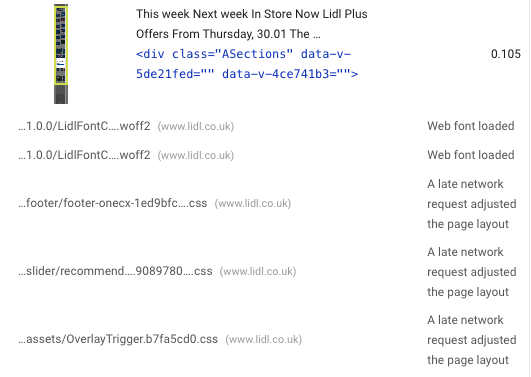
Sometimes you will see multiple possible layout shift causes reported for different files and cause types. For example, here both web font loading and late network requests are listed as potential causes.
Get additional debug data for layout shifts
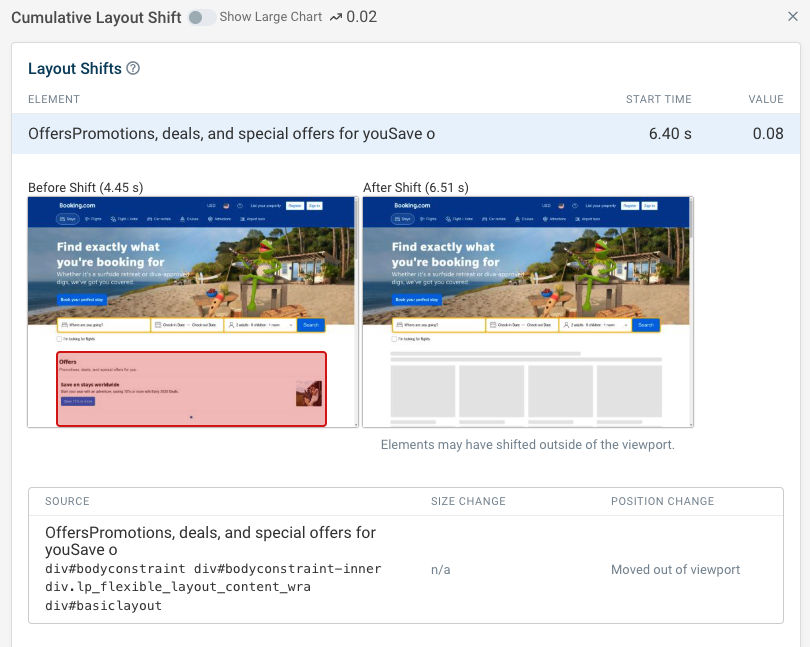
When running synthetic tests with DebugBear you'll get additional reporting on layout shifts and other aspects of page speed and user experience.
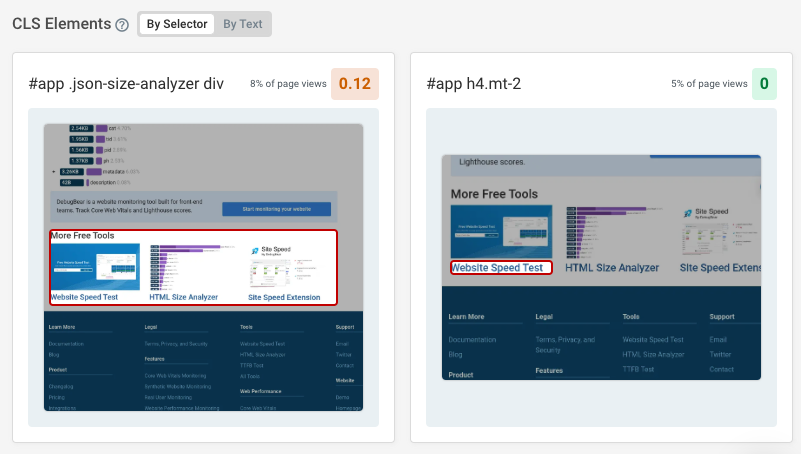
For example, you can see what the page looked like before and after the shift, as well as getting a list of all elements that have shifted if there's more than one.
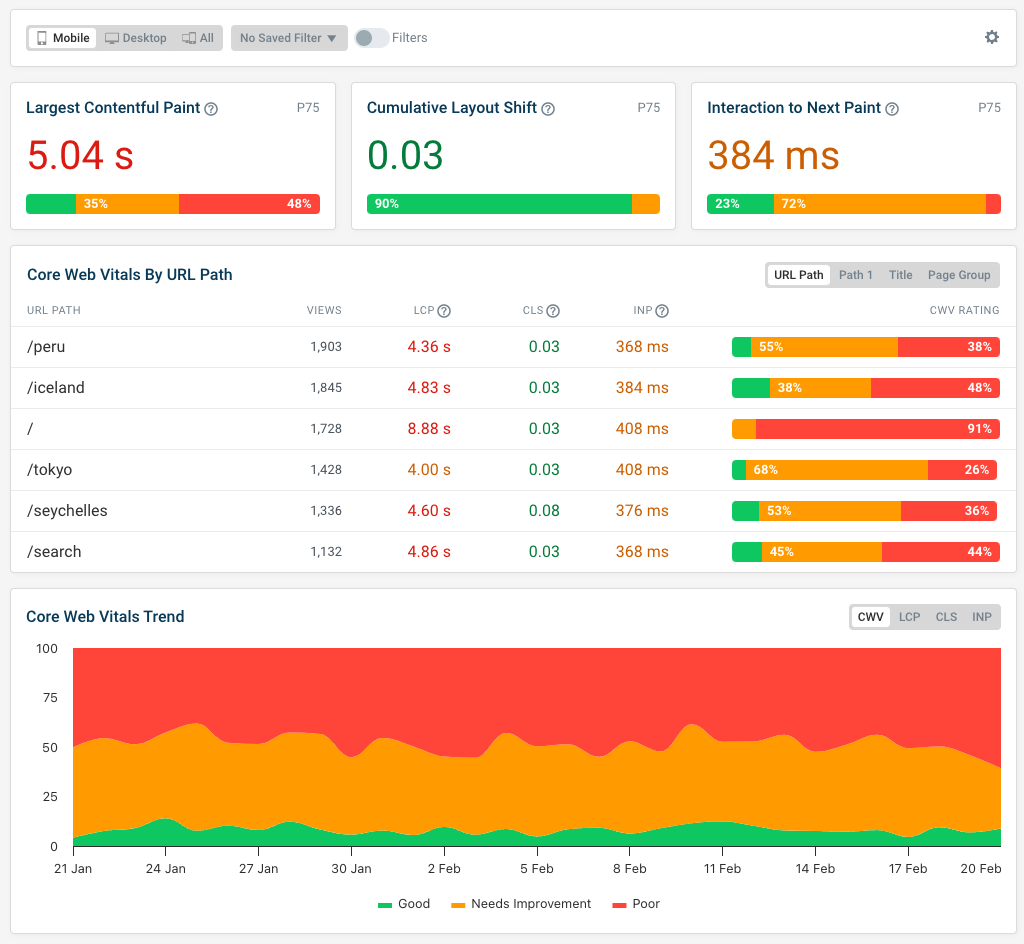
Monitor your Cumulative Layout Shift score
DebugBear offers comprehensive Core Web Vitals monitoring to help you fix web performance issues on your website:
- Synthetic tests
- Google CrUX reporting
- Real user monitoring
Real user monitoring is particularly helpful for Cumulative Layout Shifts, as many shifts only happen after a user interaction. Synthetic testing won't surface these problems, but real user data lets you identify what these shifts are and what triggered them.
Track all your Core Web Vitals over time, get the debug data you need to fix issues, try out potential optimizations, and get alerts when something goes wrong.


Monitor Page Speed & Core Web Vitals
DebugBear monitoring includes:
- In-depth Page Speed Reports
- Automated Recommendations
- Real User Analytics Data