This month we've upgraded to the latest Lighthouse, Chrome, and Web Vitals JavaScript library. We've also introduced CrUX Round Trip Time data and have published several new articles and videos to help you optimize your website performance.
Upgrade to Lighthouse 12.1 / Chrome 126
We've upgraded to Lighthouse version 12.1 and Chrome version 126 - your lab tests automatically benefit from these upgrades. The updated Lighthouse reports brings several improvements:
- New
layout-shiftsaudit showing estimated root causes for layout shifts. - The
aria-conditional-attr,aria-deprecated-roleandaria-prohibited-attrAxe checks have been added to the accessibility category. - Various performance improvements and bug fixes.
See the full Lighthouse changelog for more details.

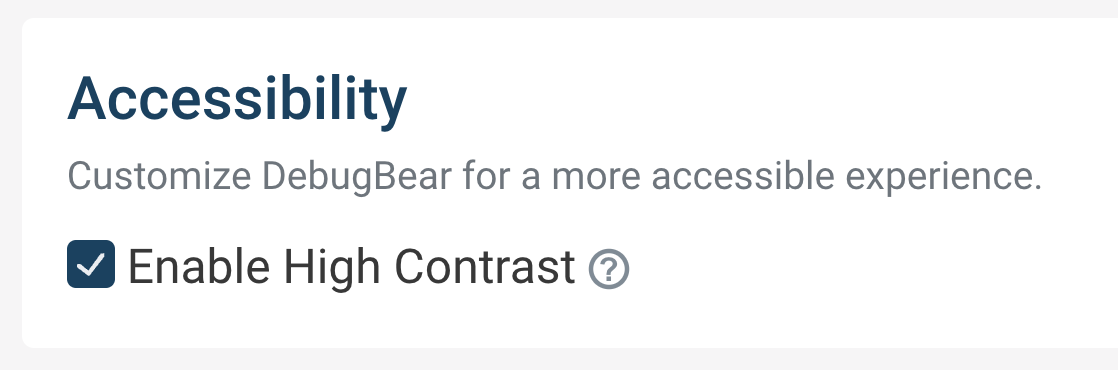
High contrast mode for accessibility
You can now enable a high contrast mode to increase color differentiation on the dashboard. This can help accommodate color blindness and other visual impairments.
To enable this feature:
- While logged into DebugBear, go to Account > My Account.
- Toggle on Enable High Contrast.
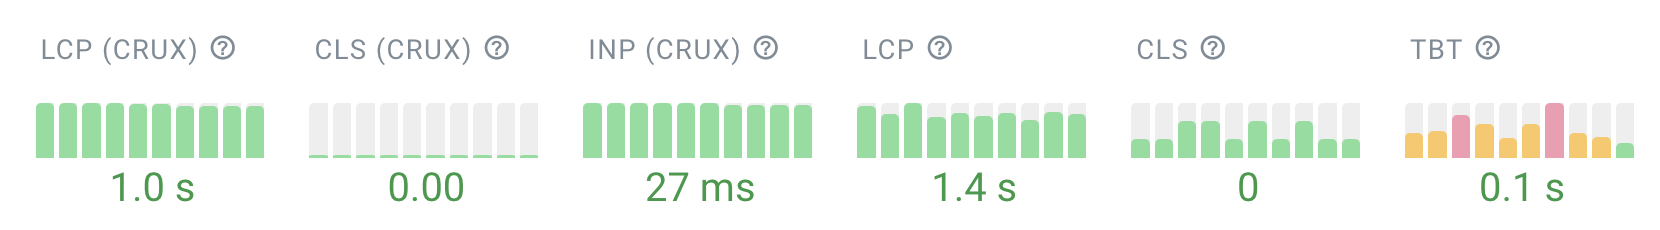
Here's a before and after example.
Before (default mode):
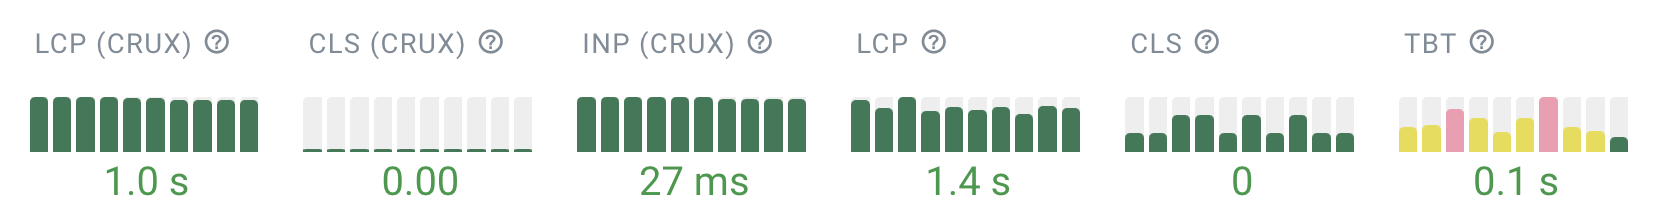
After (high contrast mode):
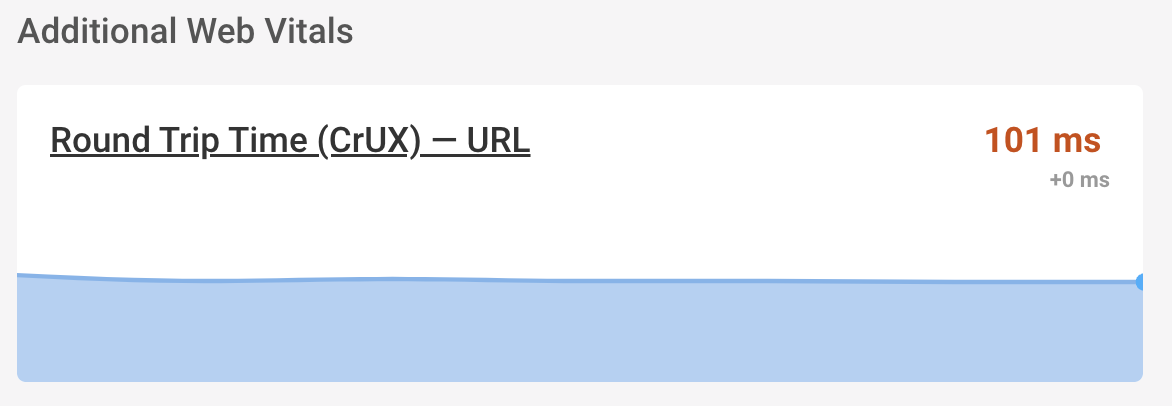
CrUX Round Trip Time (RTT) data
We now show Round Trip Time data from the Chrome User Experience Report (CrUX). This metric measures network latency and can help you understand how long it takes for a user's device to send a request to a server and receive a response.
You can:
- View this feature in a live sample report.
- Find this data in your own lab test results:
- On a website lab test result, select Web Vitals in the sidebar.
- Observe the Round Trip Time (CrUX) in the Additional Web Vitals section.
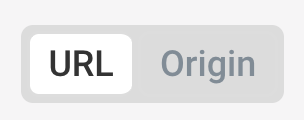
When browsing CrUX data, you can switch between URL and Origin level data to compare performance across different pages or websites.
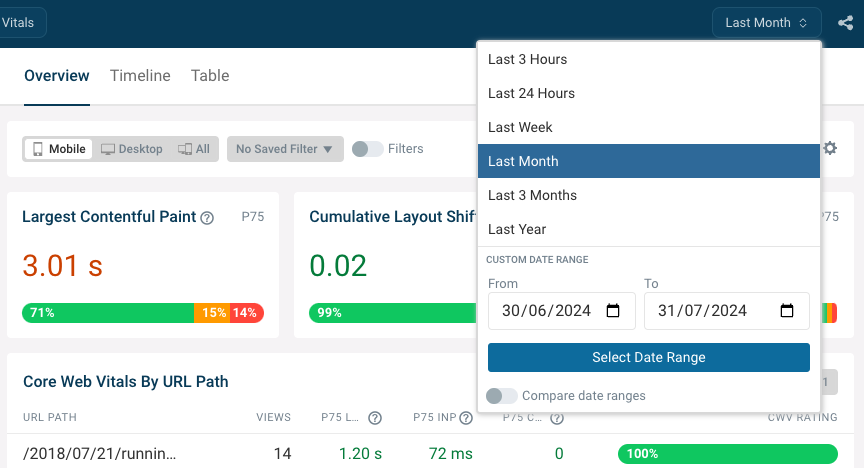
New RUM filter options for "Last year" and "Last 3 hours"
Our lab tests and real user monitoring dashboards now lets you see data for the last 12 months, or for just the last 3 hours.
Web Vitals v4 rollout
Web Vitals v4 is being rolled out on 1st August 2024. This update brings small changes to some metrics other than the Core Web Vitals. Key updates include:
- Changes to the INP breakdown attribution (generally increasing "Processsing Time")
- More detailed navigation type breakdown, e.g. showing whether the back/forward cache was hit or if the page as pre-rendered
- Tweaks to TTFB attribution
With our upgrade to Web Vitals v4, you benefit from greater reliability in our measurements and better alignment with Google's Core Web Vitals.
New case studies, videos, and articles
We've published a wealth of new content to help you understand and optimize web performance:
Videos
Master Core Web Vitals in One Hour: The Ultimate Website Optimization Guide
Dive deep into web performance debugging and optimization with this comprehensive guide. Learn practical tips and tricks to improve your website's Core Web Vitals scores and overall user experience.
Interaction to Next Paint Revealed: 5 Truths That Will Speed Up Your Site
Learn the truth about Interaction to Next Paint (INP). In this video, we debunk 5 common INP misconceptions that might be holding your website back.

One-Click Web Performance Fixes Are Finally Here
In this video, we show how to optimize the Largest Contentful Paint (LCP) element on popular websites like HBO, H&M, and Curry's through actionable recommendations and one-click experiments. Useful for developers looking to fix their website performance without having to figure out what code is needed.
Articles
Avoid Overusing fetchpriority="high"
The Fetch Priority API can optimize loading speed, but when used incorrectly, it can slow down your website. Learn how to use fetchpriority correctly.
Avoid An Excessive DOM Size For Better Web Performance
An excessively large DOM can significantly impact website performance. This article explains the importance of DOM size optimization and suggests strategies to resolve issues related to large DOMs.
How To Fix Missing INP Attribution Data With The LoAF API
Learn why INP attribution data sometimes shows an empty string for the source URL and what you can do about it using the Long Animation Frames (LoAF) API.
We've been busy creating a number of other articles and resources, go and check them out!
- A Guide to Website Monitoring: Explore different types of website monitoring and their use cases.
- Synthetic Monitoring vs. Real User Monitoring: Compare these two monitoring approaches and learn when to use each.
- Chrome Extension Statistics: Data From 2024: Get insights into Chrome extension usage and popularity in 2024.
- What Elements Contribute to Interaction to Next Paint?: Understand which page elements are considered for INP measurements.
- Debunking 5 Myths About Interaction to Next Paint (INP): Clear up common misunderstandings about how INP works.
Case Studies
How Namu Travel improved organic traffic by 15% with DebugBear
Learn how Namu Travel, a travel agency, improved their website performance and increased organic traffic by 15% using DebugBear.

How SiteCare offers their clients a Core Web Vitals guarantee
We spoke with Ryan Sullivan, SiteCare's chief of staff, about how they use DebugBear to monitor and improve Core Web Vitals for their clients' websites.
We hope these new features and resources help you optimize your website performance even further. If you want to stay up to date with our latest content, follow us on Twitter, subscribe on YouTube and subscribe to our mailing list below: