What Are Largest Contentful Paint Resource Types?
Google recently started providing an LCP resource type breakdown in the CrUX report. In this article we'll look at why this is significant and what it means for subpart reporting for Largest Contentful Paint.
What are LCP resource types?
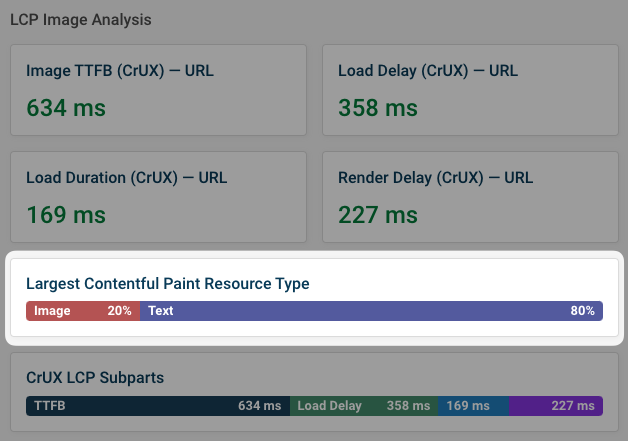
The resource type for the LCP metric tells you whether the largest content element on the page is a text element or an image. Text elements will typically have a better LCP score, as less data needs to be loaded to display text content.
Google publishes LCP resource type breakdowns as part of the Chrome User Experience (CrUX) report. CrUX data is collected from real Chrome users.
Different visitors will have a different LCP resource type for the same page. That's because different content was in the viewport depending on their device size, or because the server delivered different content to them.
You can see a real user LCP resource type breakdown for CrUX data using DebugBear's free website speed test. The resource type data is in the Web Vitals tab.
What LCP elements count as image resources?
CrUX counts image elements and background images as image resources. If the LCP element is a video or GIF then it does not count as an image resource.
What is the role of resource types for LCP subpart data?
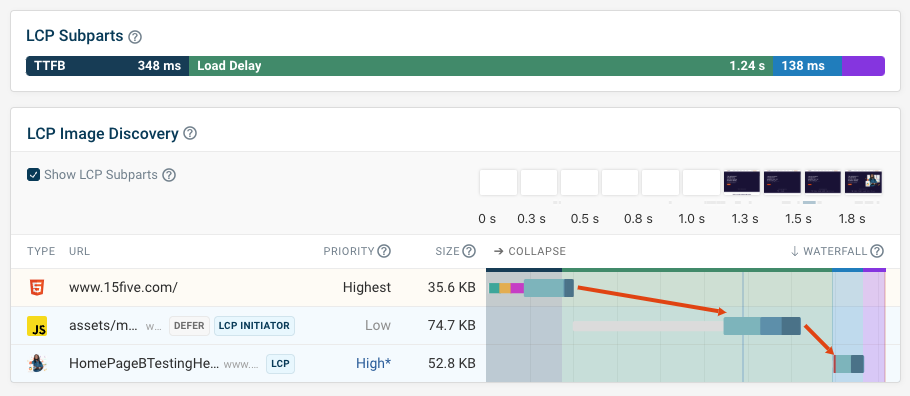
Subparts are a way to break up the Largest Contentful Paint metric into three components:
- Time to First Byte (TTFB): measures server response time
- Resource Load Delay: measures how quickly the browser discovers the LCP image
- Resource Load Duration: measures how long it takes to download the LCP image
- Element Render Delay: measures how soon after loading content is displayed
Load Delay and Load Duration only apply if the LCP resource type is image. For text content their values will always be zero.
Because of that, the CrUX subpart breakdown only includes page views where the LCP element was an image. If text was also included that would understate the Load Delay and Load Duration values, making the data less useful for optimizing your website.
If the LCP element on your website is usually text, then optimizing the CrUX subpart won't have a big impact on your overall Largest Contentful Paint score.
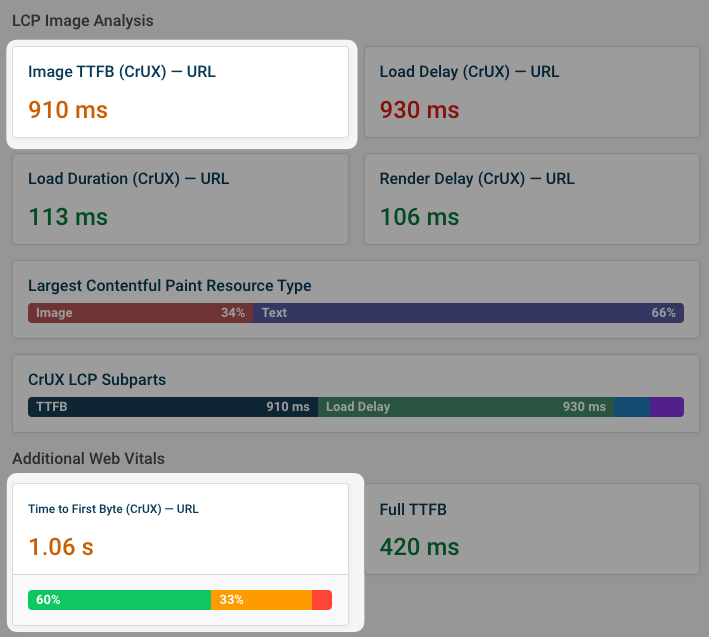
Image TTFB vs. overall TTFB
Google CrUX data now reports two separate Time to First Byte values:
- Image TTFB: only covers visits where the LCP element was an image
- Overall TTFB: includes all page views
That means if you use the subparts to diagnose image LCP scores the TTFB will accurately reflect visits where that subpart applies.
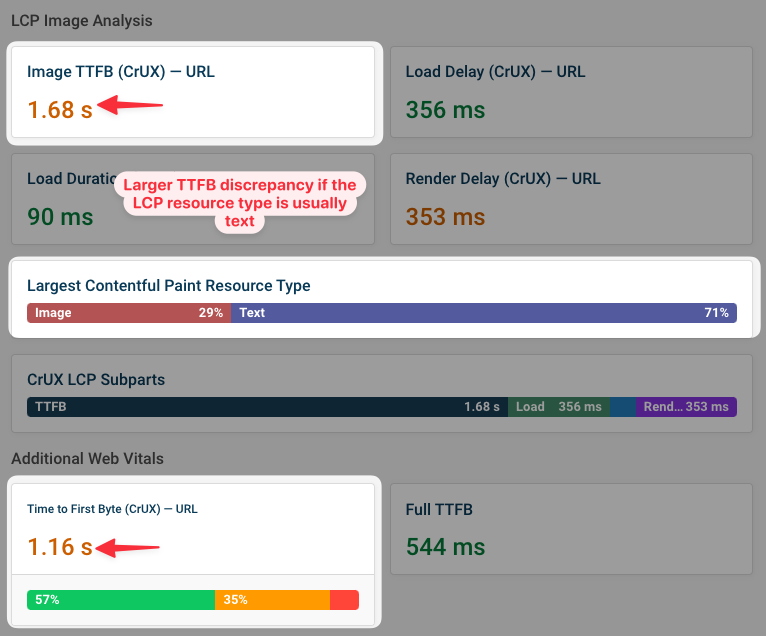
Usually, the TTFB metric isn't very different between the two resource types, so the image-specific value will be close to the overall score. The greater the percentage of visits with an image LCP type, the more likely it is that the two TTFB values are very close together.
However, sometimes you might see a larger discrepancy. For example, this might happen if logged out visitors usually get an image as the largest content element while logged-in users see text.
How to break down LCP resource types in real user monitoring
You can also break down real user monitoring data on DebugBear by resource type. Resource types are split into these categories:
- General content: paragraphs, divs, spans, etc.
- Images
- Headings
- Background images
- Video frames and posters
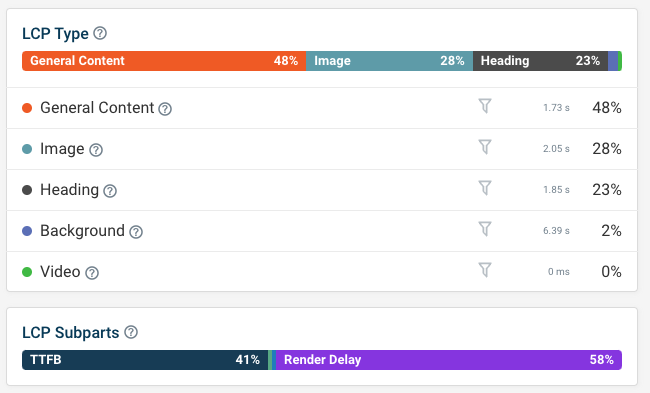
To match what you get in the CrUX report, filter your data to only include images and background images.
LCP subpart data in CrUX and navigation types
CrUX only reports subpart data for "standard" navigation types like entering a URL in the browser, clicking on a link, or reloading a page.
If a page is restored from the back/forward cache or pre-rendered by the browser, then the page view is not counted.
Monitoring LCP breakdown data
DebugBear is a Core Web Vitals monitoring tool that helps you keep track of LCP resource types and subparts across three different data types:
- Scheduled lab-based testing
- Google CrUX data
- Real user monitoring
Our synthetic tests are a great way to get a deeper insight into what's happening on your page and contributing to each of the LCP subparts.
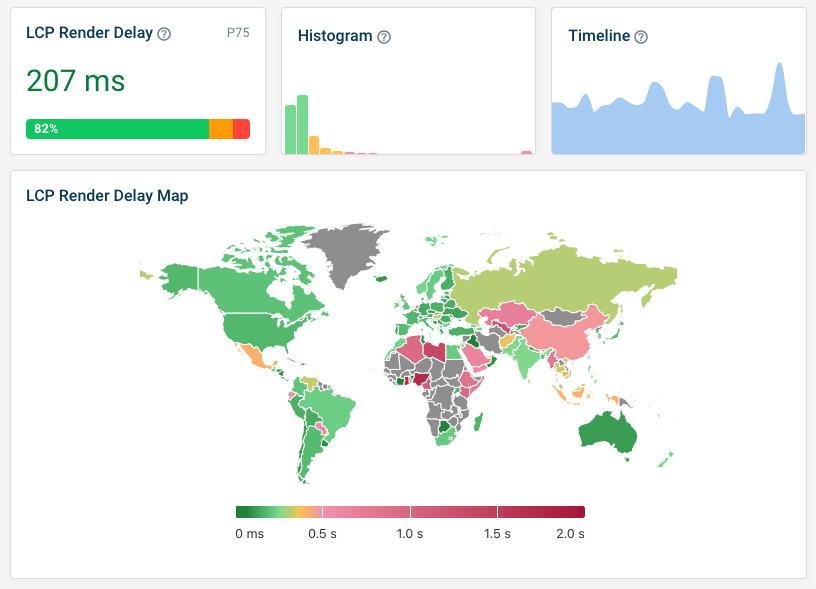
Our real user data includes dashboards for each subpart, letting you see how your metric is trending over time and how factors like visitor country and device speed impact your performance.
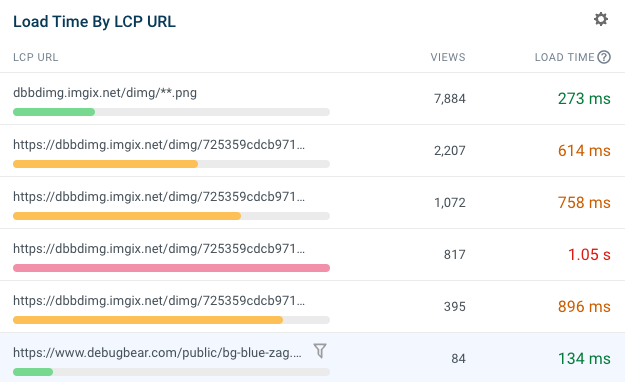
When debugging LCP components like resource load time it's also important to know what that image resource actually is!
DebugBear RUM can show you a breakdown of the most common LCP image URLs on your website, so you can focus on optimizing those images.
Try DebugBear with a free 14-day trial.


Monitor Page Speed & Core Web Vitals
DebugBear monitoring includes:
- In-depth Page Speed Reports
- Automated Recommendations
- Real User Analytics Data