Request Initiator Chains In Chrome DevTools
Identifying network request chains is an important part of optimizing website performance.
In this article we'll explain what a request initiator is, what sequential request chains mean for website speed, and how you can identify them on your website.
What are request initiators?
When navigating to a web page, at first the browser only loads the HTML document. Then the HTML code references other resources that need to be loaded, and the browser initiates those requests.
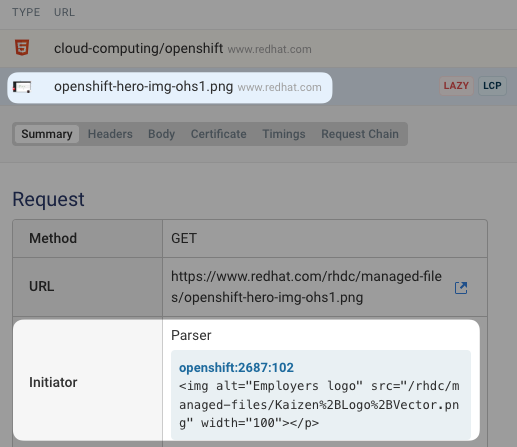
You can see an example of a request waterfall below, showing how the HTML initiates an image request.
If we expand the first request we can see exactly what code in the HTML triggered the image request. Here the initiator type is "Parser", because the HTML parser discovered the reference to the new resource.
What are request initiator chains?
The resources requested by the HTML can in turn trigger requests for more resources. These relationships are referred to as request initiator chains.
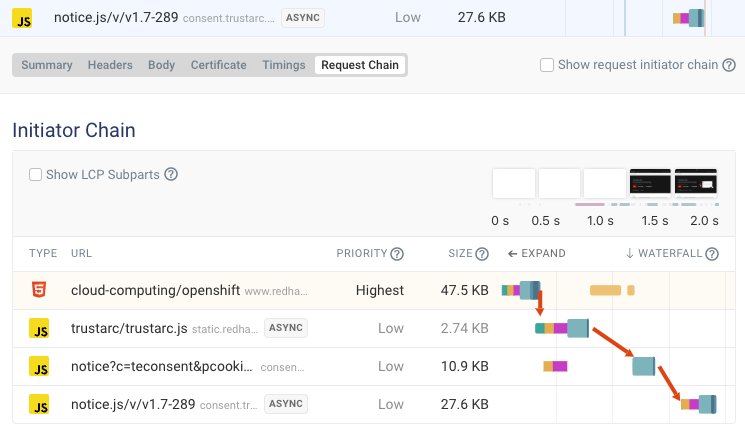
Here we can see an example where a JavaScript file depends on two other scripts and the document HTML.
Run a website speed test with DebugBear to see these chains for your own website. Expand a request and then click Request Chain
How to view initiators in Chrome DevTools
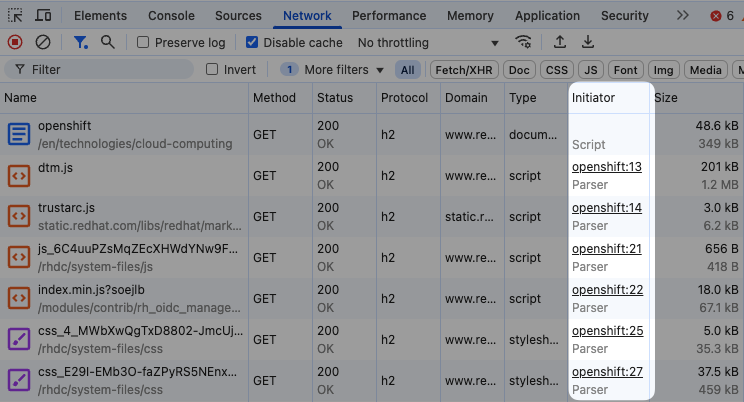
The Initiators column in the Network tab of Chrome's developer tools shows you what triggered each request.
If you've got Big request rows enabled DevTools will also show you the initiator type.
Viewing the request initiator chain in Chrome DevTools
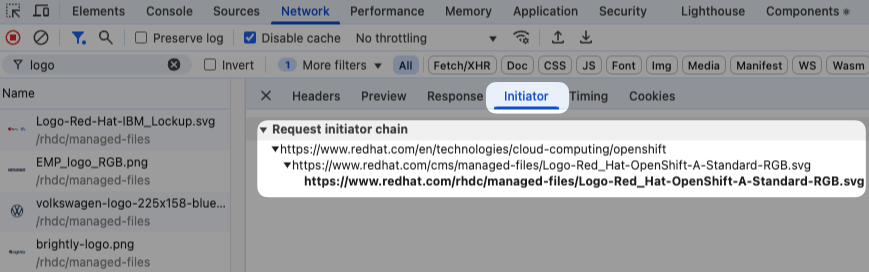
To view the request initiator chain leading up to a request, click on the request in the Network tab and then open the Initiator tab.
This will show the request URL in bold, as well as its dependencies and any dependents. For example, here the /rhdc SVG file was loaded because the previous request to /cms returned a redirect. The image in turn was originally loaded because it is referenced in the HTML code.
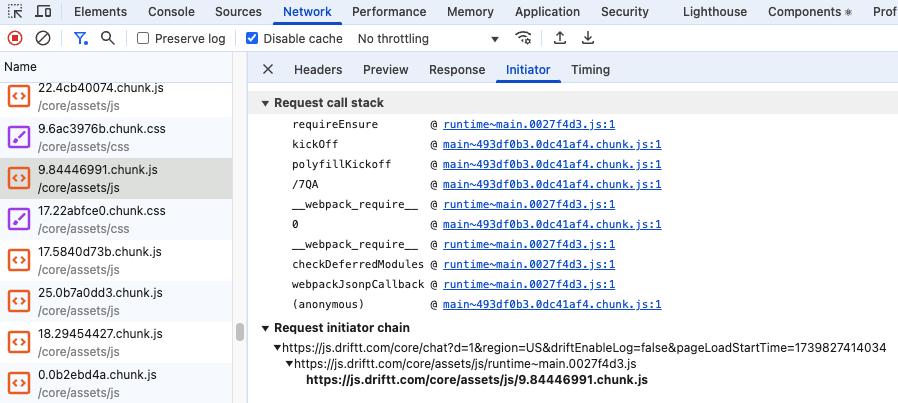
Request call stack
If the request was triggered by JavaScript execution, Chrome will also show a request call stack. The call frame at the top is where the request was actually triggered. The call frame at the bottom is when the code that led to the request first started running.
How to view request dependencies in DebugBear
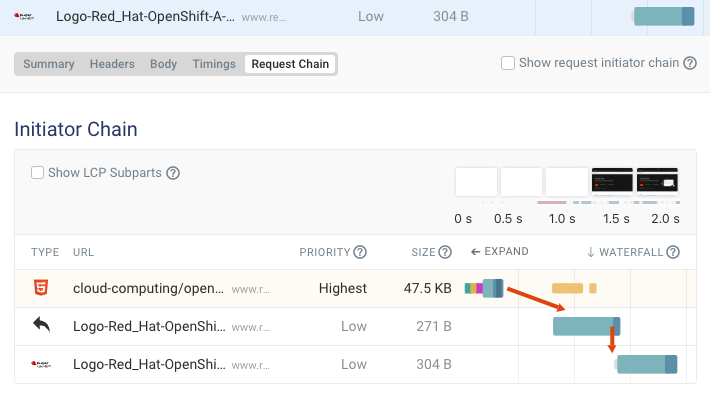
Another way to view the request initiator chain is to use synthetic website monitoring in DebugBear.
Click on the request in the test result. The request chain tab shows all resources that depend on each other in a filtered waterfall view.
Viewing dependents / initiated requests
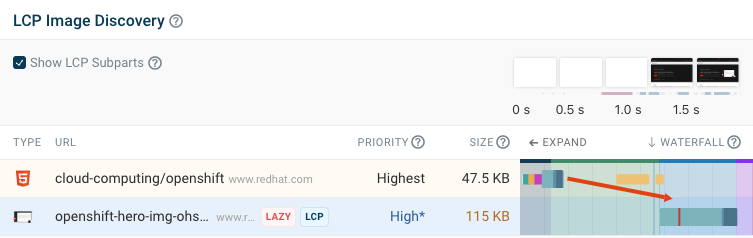
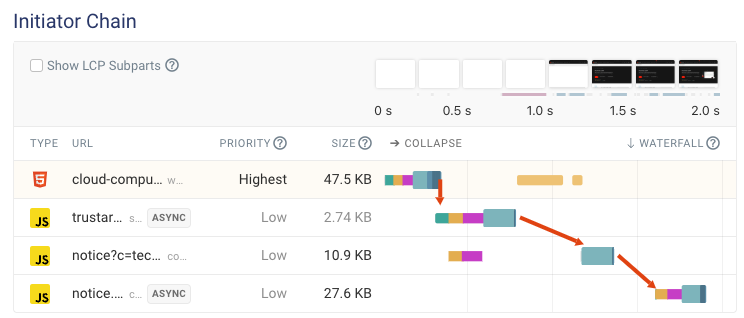
If a request triggers other requests, DebugBear also shows an Initiated requests view. These are requests that depend on the current selected request.
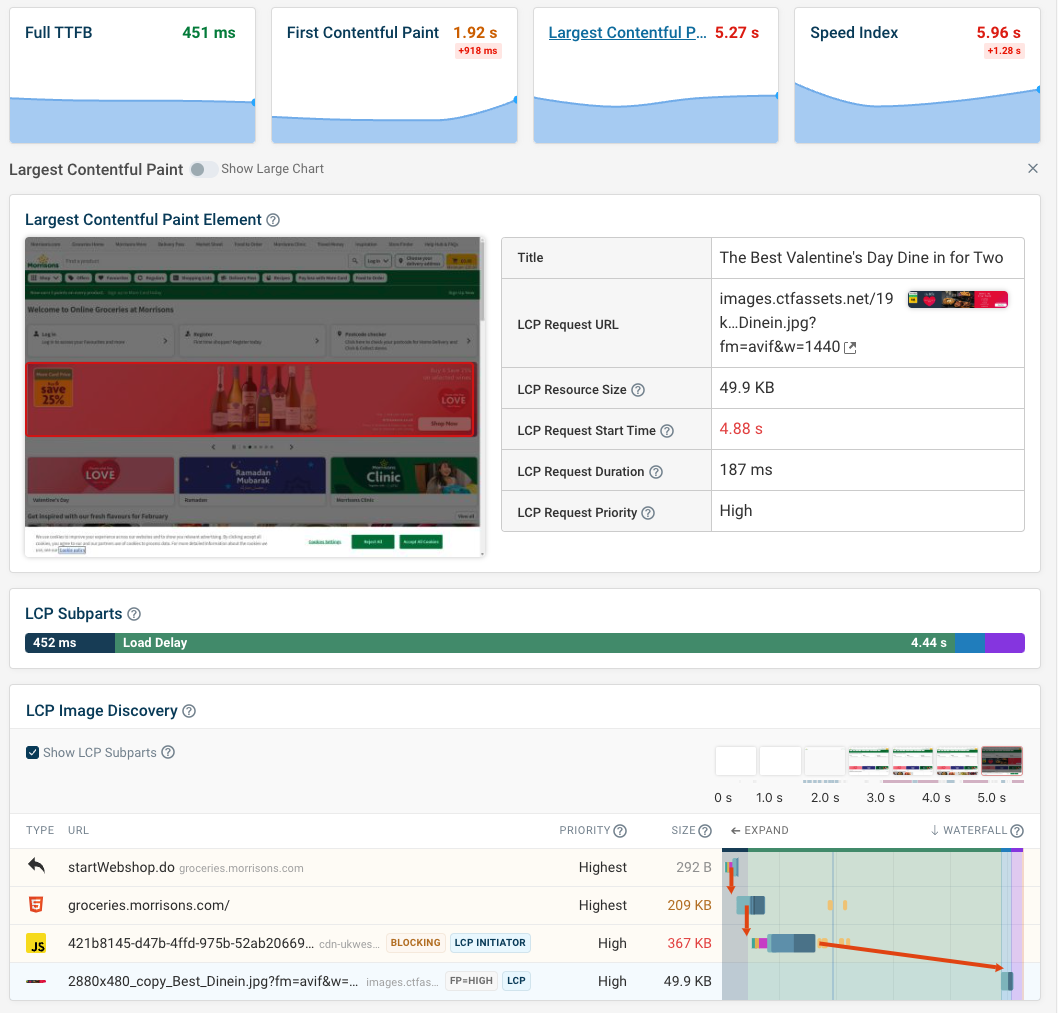
You can see an example here. In this case the CSS file is responsible for triggering the Largest Contentful Paint image to load, which is why it's marked as the LCP Initiator.
Types of request initiator
Common request initiator types include:
- Parser: the request was triggered by parsing CSS or HTML
- Script: JavaScript code was responsible for the request
- Redirect: A redirect status code like 301
- Other: Any other request triggers
What causes "Other" request initiators?
The Other category includes a variety of request triggers, for example:
- The initial navigation to a page
- Link preload response headers
- Favicon requests
Getting more insights into request performance
DebugBear allows you to monitor your performance over time, understand the role of different resources on the page, and get insights into how to load them more quickly.
Compare requests between different test results, check cache status and other response headers, and see what requests are sharing a connection.
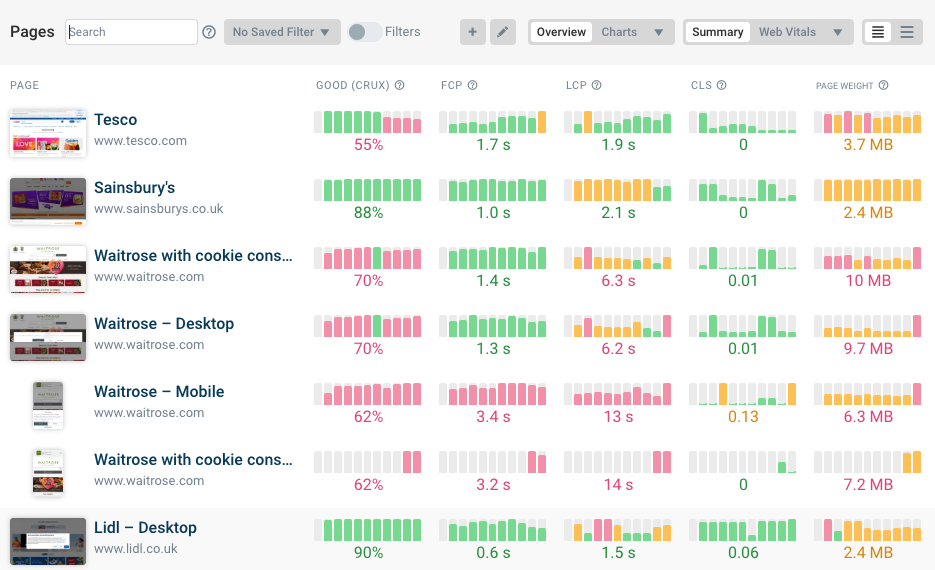
Set up monitoring for different page URLs to track page speed and Core Web Vitals metrics over time.
You can also track your competition and benchmark your website performance within your industry.
DebugBear combines three types of monitoring for comprehensive coverage:
- Lab-based tests
- Data from Google's Chrome UX Report
- Real user monitoring data


Monitor Page Speed & Core Web Vitals
DebugBear monitoring includes:
- In-depth Page Speed Reports
- Automated Recommendations
- Real User Analytics Data