Waiting For Server Response Too Long In Chrome DevTools
Find out what you can do if Chrome's developer tools are reporting long server response wait times.
What does "waiting for server response time" measure in Chrome?
You can see how long a request spends waiting for a server response in the Network tab of Chrome's developer tools.
If this value is high it typically means the server spent a long time processing the request and generating a response. As a result, the browser spent a lot of time waiting without being able to start rendering the page.
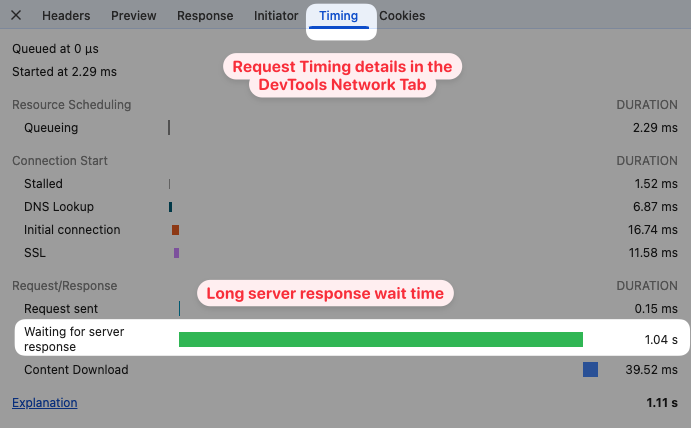
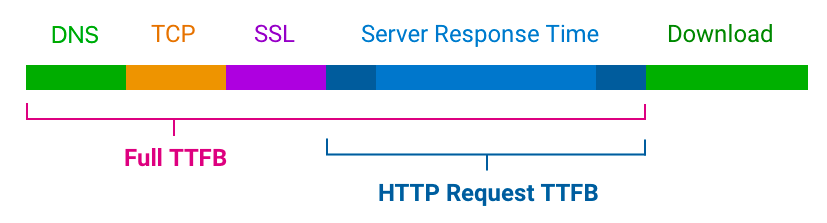
When loading a page, the Time to First Byte is a key performance metric. Long wait times don't suggest any issues with establishing a server connection.
Instead, you need to optimize the initial server response time for your website.
How to reduce wait time
To reduce wait time you either need to bypass the server processing entirely by caching responses on a Content Delivery Network, or you need to speed up the request processing on your server.
For example, you can:
- Upgrade your server hosting infrastructure
- Profile and optimize your backend code
- Analyze database queries and add indexes to make them faster
- Avoid making requests to third-party APIs when handling requests
Read our detailed guide to reducing response time for more specific tips for your website.
If you're using WordPress, we also have a dedicated guide on how to speed up WordPress sites.
Sometimes you'll find that the first page view is slow, but subsequent visits are fast. If that's the case, it could be due to caching. When you first open the page the cache is empty and the server needs to generate the page HTML from scratch. But with the next request the server can immediately serve the previously saved response, until the cached response expires.
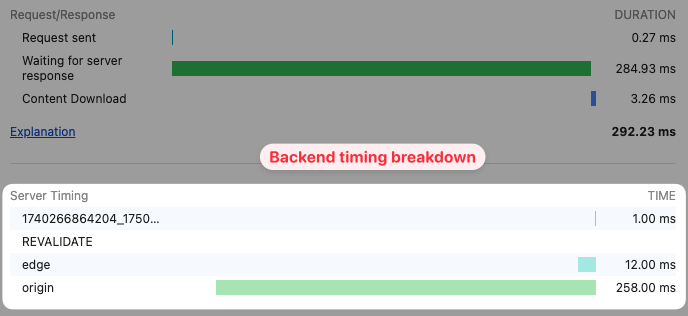
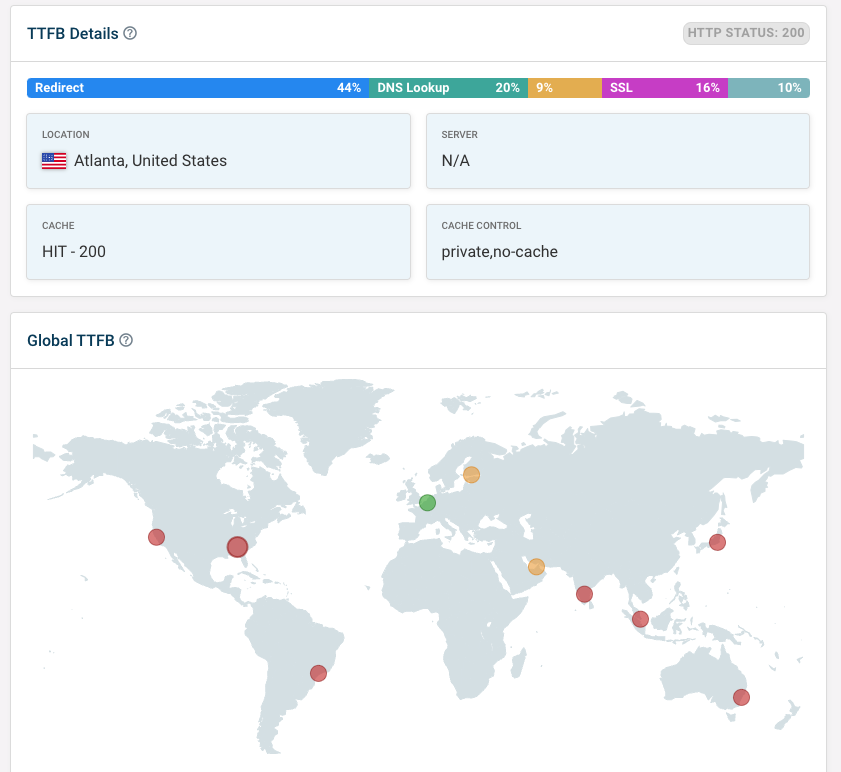
Server-timing headers
Normally the backend server acts as a black box when requesting resources from it. Visitors to your website don't get insight into how requests are processed.
However, the Server-Timing header allows your servers to report how long different parts of your infrastructure spent handling the request.
If your backend supports it, you can find this breakdown below the server response time information. In the example below we can see that a CDN is set up and that the request was processed at a CDN edge node for 12 milliseconds. However, the request was forwarded to the origin server, which spent 258 milliseconds processing it.
Test your website and check real user metrics
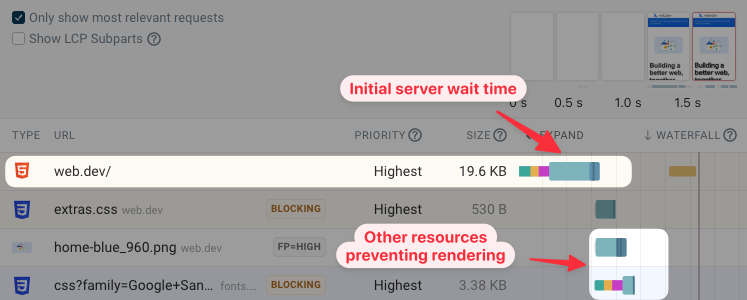
To get more detailed insights into your website performance you can run a website speed test. This will tell you how long it took for your server to provide the initial HTML response and what else contributed to page load delays.
Thanks to Google's Chrome UX Report, you can also see how fast your website is for actual visitors, and how much their experience varies. For example, in the screenshot below 7% of visitors don't wait for a long time, but 41% wait for 1.8 seconds or more.
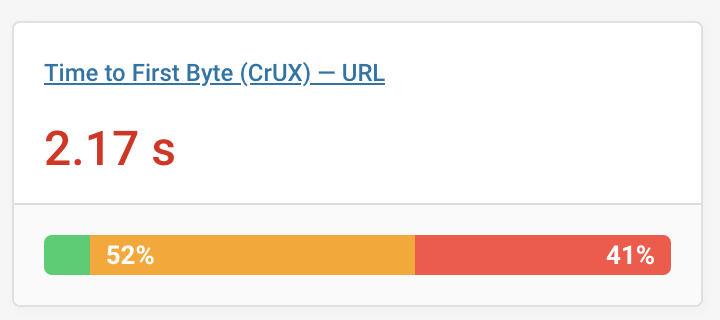
Note that this is TTFB data, so it doesn't just include the server response time itself.
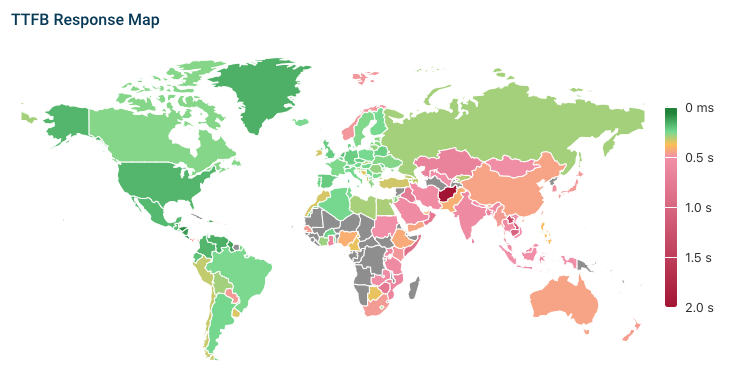
Check wait time from different locations
Sometimes server response time depends on where the user is testing the website from. This could be due to general network latency, or due to different cache statuses across different locations.
Running a global TTFB check will tell you how server wait time varies across the world.
Try monitoring response time and overall performance over time
If you're regularly encountering performance issues on your website, try using synthetic monitoring to regularly test your website and measure its load time.
That way you'll get alerted to regressions and can inspect request details if you observe poor performance.
You can also track real user monitoring data to identify differences in global performance and how visitors are impacted in different situations.
For example, if you see that some visitors have good performance while others wait significantly longer, this often indicates issues with cache expiry or cache status differences based on the visitor's location.


Monitor Page Speed & Core Web Vitals
DebugBear monitoring includes:
- In-depth Page Speed Reports
- Automated Recommendations
- Real User Analytics Data